Cryo soft X-ray tomography and deep-ultraviolet transmittance imaging reveal partitioning of neutral lipids in a lipid droplet core. Furthermore, deep-ultraviolet transmittance and tryptophan/tyrosine auto-fluorescence multimodal imaging on living cells were combined to obtain complementary information on organelle chemical contents.
Keywords: lipid droplets, label-free imaging, deep UV, fluorescence, transmittance, yeast, synchrotrons, cro-SXT
Abstract
A lipid droplet (LD) core of a cell consists mainly of neutral lipids, triacylglycerols and/or steryl esters (SEs). The structuration of these lipids inside the core is still under debate. Lipid segregation inside LDs has been observed but is sometimes suggested to be an artefact of LD isolation and chemical fixation. LD imaging in their native state and in unaltered cellular environments appears essential to overcome these possible technical pitfalls. Here, imaging techniques for ultrastructural study of native LDs in cellulo are provided and it is shown that LDs are organized structures. Cryo soft X-ray tomography and deep-ultraviolet (DUV) transmittance imaging are showing a partitioning of SEs at the periphery of the LD core. Furthermore, DUV transmittance and tryptophan/tyrosine auto-fluorescence imaging on living cells are combined to obtain complementary information on cell chemical contents. This multimodal approach paves the way for a new label-free organelle imaging technique in living cells.
1. Introduction
Lipid droplets (LDs) are the lipid-storage organelles in cells (Olzmann & Carvalho, 2019 ▸; Pyc et al., 2017 ▸). LDs receive a lot of attention as their abnormal dynamics are associated with several diseases (obesity, diabetes, atherosclerosis and myopathies) (Welte, 2015 ▸). LDs are also promising sources of lipids for the development of derived products, such as biofuels and new molecules for food, medicine and cosmetics (Dyer et al., 2008 ▸). Thus, understanding the dynamics and structure of LDs is of major importance for society. Recent advances in LD biology have revealed that the organelle is much more complex and heterogeneous than expected. Intracellular LD heterogeneity occurs partly because of the evolution of LDs during the life cycle of the organelle, from birth to death, but it also appears to be related to the diversity of LD cellular roles (Thiam & Beller, 2017 ▸; Hashemi & Goodman, 2015 ▸). Furthermore, LDs are in close contact or tightly associated with other organelles such as endoplasmic reticulum (Jacquier et al., 2011 ▸), vacuoles (Bouchez et al., 2015 ▸), peroxisome and mitochondria (Gao & Goodman, 2015 ▸). New rapid non-invasive imaging tools are required for exhaustive studies of unaltered LD dynamics, as well as studies of LD relationships with other intracellular compartments.
On the ultrastructural scale, intra LD heterogeneity is evident, but it is still under debate for the central lipid core (Ohsaki et al., 2014 ▸). LDs consist mainly of neutral lipids, triacylglycerols (TAGs) and/or steryl esters (SEs), stabilized in the cytoplasmic environment by a phospholipid monolayer and some proteins (Kory et al., 2016 ▸). Historically, structural data on central lipid cores were obtained on purified LDs using cryoelectron microscopy (Tauchi-Sato et al., 2002 ▸) or small-angle X-ray scattering (SAXS) (Czabany et al., 2008 ▸). These ex cellulo approaches revealed ordered LD cores. Czabany and colleagues proposed an ‘ordered shells’ model, essentially a TAG inner core surrounded by SE concentric layers. Electron microscopy on adipocyte ultrathin sections also revealed core partitioning depending on lipid incorporation (Cheng et al., 2009 ▸). Nevertheless, this lipid segregation inside the lipid core could be an artefact of LD isolation or chemical fixation (Ohsaki et al., 2014 ▸). Preservation of an LD in its native form and in its unaltered cellular environment appears essential to overcome these possible technical pitfalls. Recent technical advances offer this opportunity. Observations of LDs maintained in cellulo were performed on 200 nm vitreous lamellae of HeLa cells using cryo-focused ion beam/scanning electron microscopy (cryo-FIB). Concentric rings were observed, reinforcing the model of lipid concentric layers in LD cores (Mahamid et al., 2019 ▸).
To improve our knowledge on LD ultrastructure in a preserved cellular environment, we used imaging techniques that do not require chemical fixation and are suitable for observations of intact cells. We performed observations on Saccharomyces cerevisiae to take advantage of this well described model. LDs and all the intracellular compartments are easy to identify using conventional microscopy techniques, and a set of yeasts with contrasted LD morphologies and LD lipid contents are available (Fei et al., 2008 ▸; Sandager et al., 2002 ▸).
First, we performed cryo soft X-ray tomography (cryo-SXT) on vitrified S. cerevisiae with a nanometric spatial resolution (30 nm half pitch) in a volume of a few micrometres. This technique is well suited for studying cell architecture and organelle partitioning and interactions in intact cells (Müller et al., 2012 ▸; Parkinson et al., 2008 ▸). The contrast is directly dependent on the X-ray absorbance. Thus, carbon-rich organelles such as LDs absorb soft X-rays much more strongly than other organelles and become very distinctive (Seo et al., 2017 ▸; Pérez-Berná et al., 2016 ▸; Uchida et al., 2011 ▸).
Second, we used synchrotron deep-ultraviolet (DUV) illumination allowing label-free imaging in living cells. DUV imaging was originally developed for label-free fluorescent analysis of biological samples. It has been successfully used to identify tissue organization in mammalian muscle fibres (Chagnot et al., 2015 ▸) and in plant vascular tissue (Jamme et al., 2013 ▸). Information was obtained at the micrometre scale and on fixed material but DUV imaging can also be used on living material at 110 nm spatial resolution (following the Rayleigh criterion) (Jamme et al., 2010 ▸) with preservation of cell viability (Cinquin et al., 2015 ▸). We investigated living-cell imaging using DUV transmittance (TRANS) imaging. This technique was developed on living mammalian cells for protein and DNA mapping based on their absorbance properties (Cheung et al., 2011 ▸; Zeskind et al., 2007 ▸). The technical challenge was to transpose these methodologies to living yeast. Unlike mammalian cells, yeasts are not adherent. Furthermore, yeasts are ten times smaller (5 µm versus 50 µm) than mammalian cells. Here, we provide LD ultrastructural data in a native environment using a new multimodal label-free imaging method.
2. Materials and methods
2.1. Strains and culture conditions
The strains used are listed in Table 1 ▸. Strains wild type (WT) W303, triple mutant (TM) Dga1+ and TM Are2+ are in kind gifted from Sten Stymne Laboratory (Sandager et al., 2002 ▸). Cells were grown in rich medium supplemented with 2%(w/v) glucose. All cultures were grown in conical flasks containing 1/5 volume of medium and incubated at 28°C in an orbital shaker with an agitation rate of 200 r.p.m.
Table 1. Yeast strains used in this study.
| Name | Strain | Relevant genotype | Experiment | Source and reference |
|---|---|---|---|---|
| WT | W303 | MATa | Cryo-SXT | Sten Stymne Laboratory (Sandager et al., 2002 ▸) |
| TM Dga1+ | W303 | MATα Are1Δ::HIS3, Are2Δ::LEU2, Lro1Δ::URA3 | Cryo-SXT | Sten Stymne Laboratory (Sandager et al., 2002 ▸) |
| TM Are2+ | W303 | MATα Are1Δ::HIS3 Dga1Δ::KanMX4 Lro1Δ::URA3 | Cryo-SXT | Sten Stymne Laboratory (Sandager et al., 2002 ▸) |
| WT | BY4741 | MATa | DUV | Euroscarf |
| Sei1Δ | BY4741 | MATa Ylr404wΔ::KanMX4 | DUV | Euroscarf |
2.2. Cryo soft X-ray tomography
4 µl of cell suspension (∼108 cells ml−1) was deposited on plasma-cleaned quantifoil gold-finder grids and vitrified by plunge freezing using a Leica Automatic Plunge Freezer EM GP2. Cryo soft X-ray tomography data were collected at the MISTRAL beamline (ALBA Synchrotron, Barcelona, Spain) (Sorrentino et al., 2015 ▸). The vitrified grids were transferred to the beamline under cryogenic and vacuum conditions. The datasets were acquired at an energy of 520 eV with an exposure time of 1 s, in a tilt range from −65 to 65° with 1° steps. Alignment of the tilted series was performed with IMOD (Kremer et al., 1996 ▸). The final reconstructions were performed using Tomo3D (Agulleiro & Fernandez, 2015 ▸).
2.3. Full-field DUV microscopy
Synchrotron DUV microscopy was performed at the DISCO beamline at the SOLEIL synchrotron radiation facility (Gif-sur-Yvette, France) on the TELEMOS microscope (Jamme et al., 2013 ▸). Cells were deposited on quartz slides or a silicon surface and were observed under DUV excitation using a Zeiss AxioObserver Z1 through a 100× Zeiss ultrafluar glycerine immersion objective (numerical aperture of 1.25). The fluorescence was recorded under 275 nm excitation using a dichroic mirror at 300 nm (Omega Optical Inc.) and a 327–353 emission bandpass filter (Omega Optical Inc.) for tryptophan/tyrosine (TRP/TYR) auto-fluorescence, and under 340 nm excitation using a dichroic mirror at 410 nm (Omega Optical Inc.) and a 420–480 emission bandpass filter (Omega Optical Inc.) for DPH fluorescence with an exposure time of 5000 ms. The transmittance signal was recorded under 275 nm excitation after reflection in the silicon mirror using a 50/50 dichroic mirror with a 285/14 emission bandpass filter with an exposure time of 500 ms. Z vertical acquisitions were performed with a 300 nm step size following the Nyquist criterion. Images were recorded on a PIXIS 1024 BUV (Princeton) EM-CCD. For DPH staining, cells were incubated for 15 min at room temperature at the final concentrations recommended by the supplier (Thermo Fisher Scientific).
2.4. Point spread function deconvolution
The Point spread function (PSF) describes how a point in the sample is imaged by microscope optics. The brightness of every point in the image is linearly related through convolution to the fluorescence of each point in the object. To calculate the deconvolution, the PSF of the whole system was recorded with calibrated fluorescent beads (0.17 µm TetraSpeck Molecular Probes, Life Technologies). This experimental PSF was then applied to the Z stack of images using a deconvolution classical maximum-likelihood estimation (Huygens software, SVI, The Netherlands). The Z step was 200 nm and the acquisition time was 10 s.
3. Results
3.1. LD neutral lipid content can modify lipid core organization
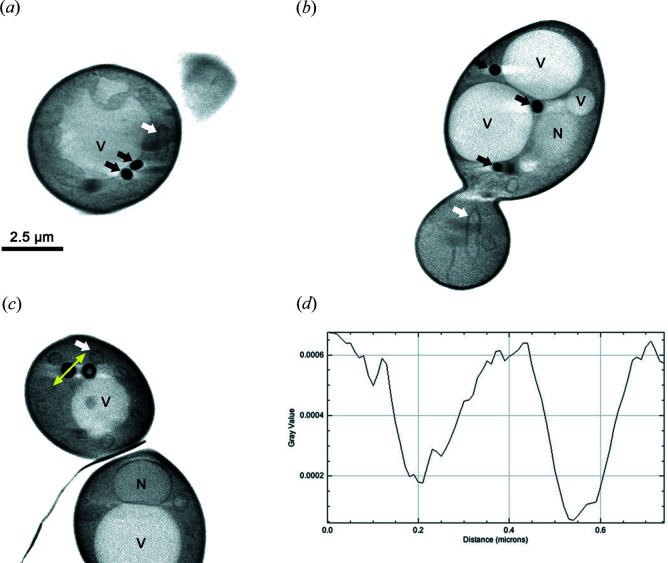
LD core ultrastructural organization was shown in S. cerevisae using SAXS on purified organelles but was not visible on cell thin sections using conventional electron microscopy (Czabany et al., 2008 ▸). We investigated if LD lipid core arrangement could be observed using another imaging technique, cryo-SXT. In this case, vitrification is the only sample preparation step required and therefore the cells are in a close-to-native state. In S. cerevisiae, neutral lipid synthesis is dependent on four acyl-transferases, Dga1p and Lro1p for TAGs and Are1p and Are2p for SEs (Sandager et al., 2002 ▸). We performed cryo-SXT on both the WT and TM strains with only one of these acyltransferases, leading to cells producing only TAG (TM Dga1+) containing LDs and SE containing LDs (TM Are2+). 3D reconstructions were obtained from a series of tilted projections. The transmitted signal of the projections is directly related to the elemental concentration of the different features inside the cells. Virtual slices of the volumes revealed contrasted morphology of LDs in these three strains. LDs in WT [n = 20, Fig. 1 ▸(a), black arrows] and TM Dga1+ [n = 18, Fig. 1 ▸(b), black arrows] homogeneously absorbed X-rays with lipids inside the core. LDs in TM Are2+, containing only SEs, presented a core with a low-transmittance external black ring and a high-transmittance heart [n = 12, Fig. 1 ▸(c)], as confirmed by the LD intensity plot profile [Fig. 1 ▸(d)]. These results show that in SE-containing LDs the heart of the core does not contain as much carbon-rich material as the WT or TAG containing LDs, and SEs are confined at the periphery of the LD core.
Figure 1.
LD core heterogeneity revealed by cryo-SXT. WT, TM Dga1+ and TM Are2+ cells were vitrified on transmission electron microscopy gold grids using plunge freezing in liquid ethane, and observed under the transmission X-ray microscope of the MISTRAL beamline from the ALBA synchrotron. The tomographies were reconstructed from a series of tilt projections. The virtual reconstructed slices are from WT cell (a), TM Dga1+ cell (b) and TM Are2+ cell (c). (d) The LD intensity plot profile from the TM Are2+ cell was obtained along the line segment visualized by the yellow double arrow in panel (c). Nucleus (N), vacuole (V), LD (black arrow) and mitochondria (white arrow).
3.2. LDs are high-absorbance organelles at 275 nm excitation
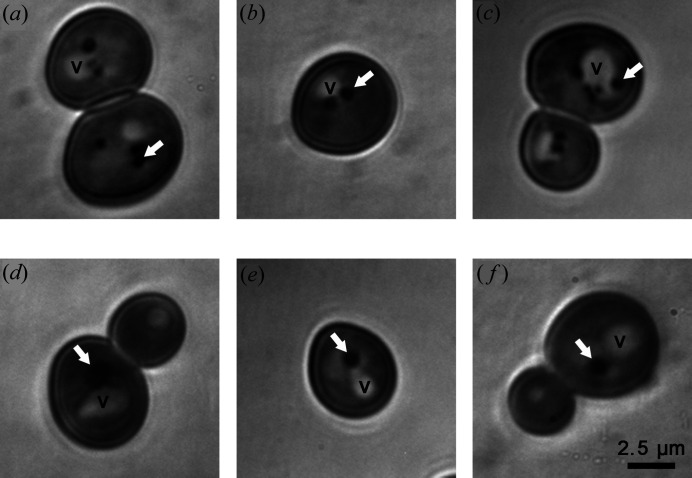
SEs in S. cerevisiae LDs are mainly ergosterol esters (Czabany et al., 2008 ▸). To go further in SE partitioning in LD cores in living yeasts, we took advantage of an ergosterol absorbance spectra range between 240 and 300 nm with two main peaks at 270 and 280 nm, which is compatible with DUV illumination. We performed DUV transmittance (TRANS) imaging at 275 nm excitation on cells deposited on a reflective surface. The TRANS contrast generated by the absorbance properties of the cell material after reflection was collected. Observations were performed on cells containing LDs with distinguished morphologies to clearly identify LDs, as no previous literature was available on LD TRANS imaging. We chose WT cells with a few 250 nm average diameter LDs (Vindigni et al., 2013 ▸) and Sei1Δ mutant cells with one supersized LD per cell (Fei et al., 2008 ▸). We observed contrasting signals inside the cells. In WT cells [Figs. 2 ▸(a), 2(b) and 2(c)], we observed one white organelle with a high TRANS signal, multiple black round organelles with low TRANS signal and a medium TRANS signal corresponding to cytoplasm. In Sei1Δ mutant cells [Figs. 2 ▸(d), 2(e) and 2(f)], we observed white organelles with high TRANS signal and one black round organelle with a low TRANS signal. WT cell and Sei1Δ mutant-cell TRANS image comparison allowed the identification of vacuoles as high TRANS signal organelles and LDs as black round structures with low TRANS signal (Fig. 2 ▸, white arrows), probably because of LD high ergosterol content.
Figure 2.
LD imaging using DUV transmittance microscopy. WT (a), (b), (c) and Sei1Δ (d), (e), (f) cells were observed using DUV transmittance microscopy. LD (white arrow), vacuole (V).
3.3. DUV TRANS imaging confirms lipid-core partitioning
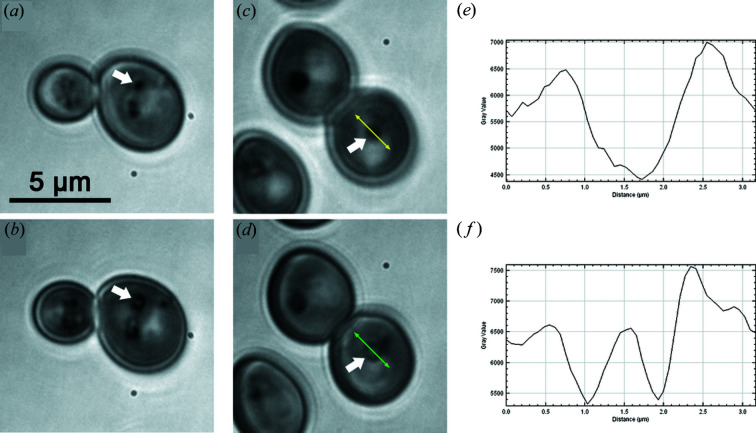
Image stacks obtained using cryo-SXT revealed the ultrastructural partitioning of SE-containing LDs. To investigate ultrastructural partitioning using TRANS imaging, we examined LDs at different Z positions in the cell. TRANS Z stacks revealed transmittance partitioning within LDs in WT cells [Figs. 3 ▸(a), and 3(b), white arrow] and Sei1Δ [Figs. 3 ▸(c) and 3(d), white arrow] mutant cells. LDs appear as low TRANS structures at the surface [Figs. 3 ▸(a) and 3(c)] and as donut-like structures with a low TRANS ring and a high TRANS heart from afar [Figs. 3 ▸(b) and 3(d)], as confirmed by the intensity plot profiles on LDs from Sei1Δ mutant cells at different Z stages [Figs. 3 ▸(e) and 3(f)]. We concluded that LD cores are made of a low TRANS peripheral layer compatible with an ergosterol-rich peripheral ring. These observations and the previous results obtained using cryo-SXT support a possible physiological partitioning of SEs at the periphery of LDs.
Figure 3.
LD core heterogeneity revealed by DUV transmittance microscopy. WT (a), (b) and Sei1Δ (c), (d) cells were observed using DUV transmittance microscopy. 300 nm Z stacks were performed. LD surface (a), (c) and LD internal structure (b), (d) were imaged. LD intensity plot profiles from Sei1Δ LD surface (e) and Sei1Δ LD internal structure (f) were obtained along the line segments visualized by the yellow and green double arrows, respectively. LD (white arrow).
3.4. Combination of DUV TRP/TYR and TRANS imaging improves LD identification during label-free imaging
Then, we investigated LD core lipid partitioning on WT cells and Sei1Δ mutant cells using DUV fluorescence imaging. Cells were deposited on a quartz slide and observed under DUV illumination at 275 nm with an emission bandpass filter ranging from 327 to 353 nm, corresponding mainly to TRP and TYR auto-fluorescence (Jamme et al., 2013 ▸). The recorded image stacks were contaminated by out-of-focus contributions that can be reduced by image-restauration techniques (Van Kempen et al., 1997 ▸). The visualization of contrasted signals inside the cells revealed protein-concentration heterogeneity at the subcellular level. Fluorescence microscopy showed a high TRP/TYR fluorescence for the cytoplasm and organelles with different levels of auto-fluorescence after illumination at 275 nm [Figs. 4 ▸(a) and 4(b)]. Some high TRP/TYR fluorescence bright structures, which remain to be identified, were observed [Fig. 4 ▸(a), grey arrow]. In contrast, some low TRP/TYR fluorescence organelles were visible. Identification of LDs was not trivial. The use of DPH, a vital neutral lipid probe with a maximum excitation compatible with DUV (340 nm), was necessary [Figs. 4 ▸(c) and 4(d)]. In Sei1Δ mutant cells, we identified LDs as low TRP/TYR organelles [Figs. 4 ▸(e) and 4(f), white arrows]. TRP/TYR fluorescence LDs were not distinguishable from the high TRP/TYR fluorescence signal of the cytoplasm in WT cells (data not shown) because of the smaller size of LDs. Vacuoles were identified as low TRP/TYR organelles because of their size and location inside the cell. The exploration of DUV fluorescence Sei1Δ mutant-cell Z stacks did not permit the observation of LD core partitioning, in contrast to DUV TRANS imaging.
Figure 4.
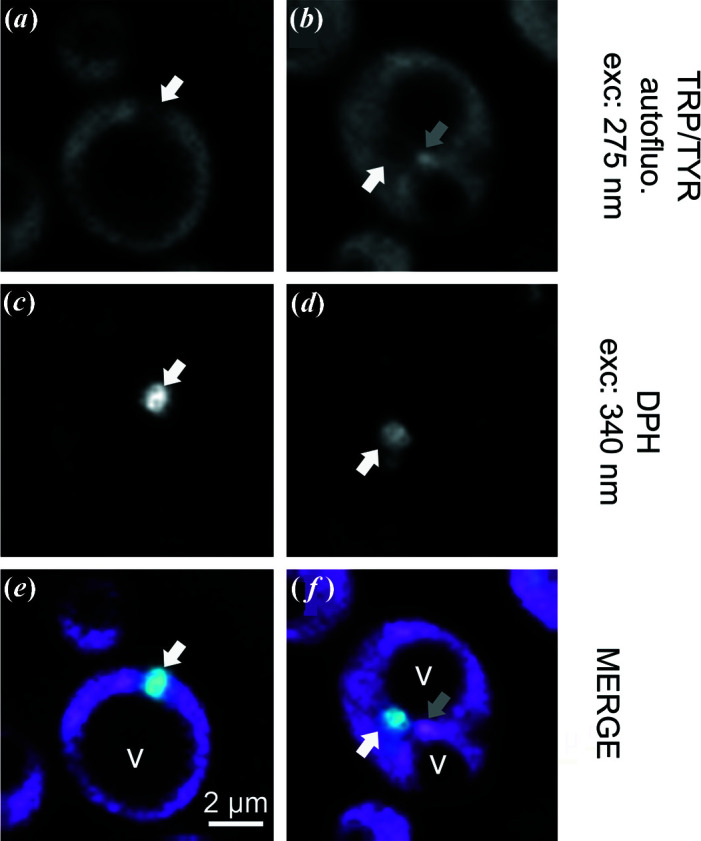
LD imaging using DUV fluorescence microscopy. Sei1Δ cells incubated with DPH stain were observed using DUV fluorescence microscopy at 275 nm and 340 nm excitations to obtain TRP/TYR autofluorescence (a, b) and LD localization (c, d), respectively. Merged images (e, f) were presented with TRP/TYR and DPH fluorescences as pink and blue signals, respectively. LD (white arrow), unidentified TRP/TYR fluorescent structure (grey arrow), vacuole (V).
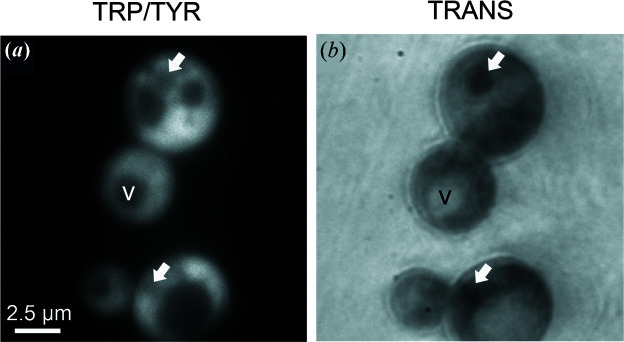
We also explored the technical feasibility of performing DUV multimodal imaging on living S. cerevisiae. Sei1Δ mutant cells were deposited on a reflective silicon surface and subjected to 275 nm illumination. Fluorescence [Fig. 5 ▸(a)] and TRANS [Fig. 5 ▸(b)] images were sequentially recorded, and cell and organelle heterogeneity were observed.
Figure 5.
LD imaging using DUV multimodal microscopy. Sei1Δ cells were observed using TRP/TYR autofluorescence (a) and transmittance (b) imaging at 275 nm. LD (white arrow), vacuole (V).
TRANS and fluorescence DUV imaging gave different and complementary information on cell chemical content. Vacuoles and LDs were not distinguishable using TRP/TYR imaging. By combining multimodal images, we were able to clearly identify LDs as low TRP/TYR fluorescence and high TRANS organelles (Fig. 5 ▸, white arrows).
4. Discussion
Our objective was to investigate the structure of LD lipid cores using nondestructive cell imaging such as cryo-SXT and DUV microscopy. DUV microscopy does not necessitate any special sample preparation whereas cell vitrification is necessary for cryo-SXT. This instantaneous freezing does not induce lipid-phase transition, such as suggested to be occurring during LD isolation procedures (Lei et al., 2019 ▸). Thus, our sample preparation conditions are free of artefacts and therefore compatible with LD lipid core structural investigations.
Observation of LDs with contrasted neutral lipid content revealed a peculiar core structural organization in SE-rich LDs. Lowering TAG content in TM Are2+ LDs induces a SE structuration at the periphery of the LD core, without any SE colonization of the central part. Whereas, when TAGs are present, LDs appear homogeneously filled with carbon-dense lipids. LDs structural features seem not to be restricted to yeast models and have previously been visualized, for instance, in a subclass of LDs in fibroblast cells using cryo-SXT (Groen et al., 2019 ▸). The nature of the central low carbon-density ‘hole’ in TM Are2+ LDs remains a mystery. Proteins were also found inside the LD lipid core (Robenek et al., 2011 ▸; Cermelli et al., 2006 ▸). The presence of proteins in the low carbon-density heart of the SE-rich LD core could be investigated, for instance, by looking at the nitrogen absorption edge using soft X-ray spectroscopic imaging at the MISTRAL beamline.
Structural changes induced by modification of the TAG/SE ratio are documented for lipoproteins. Higher SE content in low-density lipoproteins (LDLs) increases the lipid-phase transition temperature, favours structural changes at biological temperatures (from melted core to crystalized/organized core with probable lipid-phase separation), and modifies shape and protein association properties of the LDL surface (Lei et al., 2019 ▸; Sherman et al., 2003 ▸). We could hypothesize that the same behaviour could occur for cytoplasmic LDs as we observed notable structural differences between TAG-containing LD cores and LD cores with SE only. In our case, this structural LD core modification was not associated with intracellular modification of LD shape, but we did not exclude possible modification of LD surface properties. Modification of LD structure induced by neutral lipid content could be a way to modify the physiological state and dynamics of cytoplasmic LDs, as observed for LDL. Recently, LD structural changes in HeLa cells during the cell cycle were observed using cryo-FIB. These data support such models of LD dynamic control (Mahamid et al., 2019 ▸).
DUV light provided by the DISCO beamline enabled imaging of organelles in the living unicellular yeast. As the resolution is directly related to the wavelength, working in DUV makes it possible to naturally increase the lateral resolution to 110 nm, allowing visualization of structures like contact zones between two organelles or intra-organelle structural partitioning. DUV LD TRANS revealed LD core chemical heterogeneity with a low-transmittance ring and a high-transmittance central heart at 275 nm excitation. This shows that LDs are well organized structures in living cells.
Yeast LDs contain TAGs and ergosterol esters. The ergosterol absorbance spectra range was between 240 and 300 nm with two main peaks at 270 and 280 nm. With 275 nm excitation, we recorded transmittance signals for ergosterol and by-products present in cellular membranes, but also in LDs. In WT yeasts, like in Sei1Δ strains (Fei et al., 2011 ▸), the LDs mainly contain ergosterol esters and TAGs in the same proportion. Unlike ergosterol, TAGs do not absorb at 275 nm. Consequently, the low-transmittance ring and the high-transmittance heart could correspond to ergosterol and TAG-containing structures, respectively. Such LD structural organization was observed for purified LDs using SAXS (Czabany et al., 2008 ▸) and for LDs in vitreous lamellae using cryo-FIB (Mahamid et al., 2019 ▸). Here, we strengthen the concentric layer model of LD core structural organization using the fast-imaging technique in living cells.
We also constructed dedicated procedures for the combination of TRANS and TRP/TYR auto-fluorescence imaging on living cells. This DUV multimodal imaging gave different and complementary information on cell chemical content. This technique improves identification of intracellular compartments at the subcellular level based on their dual chemical-imaging signature. This powerful and original multimodal-imaging technique paves the way for the constitution of an organelle atlas in living cells.
In conclusion, both cryo-SXT and DUV imaging provide structural and chemical information at different scales. By combining these synchrotron techniques, we integrated data from the submicrometre scale to the micrometre scale. In particular, for LD structure, the organelle ultrastructure has been investigated in connection with the cellular organization thanks to the scales covered by the two techniques. Each of these synchrotron techniques also present unique assets. Cryo-SXT provides a resolution compatible with the fine ultrastructure of cellular compartments (Groen et al., 2019 ▸), while DUV imaging offers dynamics of biological processes such as cellular divisions, a follow up of the intracellular fate of external molecules (Vergalli et al., 2018 ▸), and abiotic and biotic stress responses.
Acknowledgments
We thank Isabelle Bouchez, Fernanda Fonseca, Stéphanie Passot and Caroline Pénicaud for their implication in the yeast lipid project and for critical reading of the manuscript. We are grateful to ALBA and SOLEIL staff for smooth running of the facilities. We thank the Imagerie Gif platform for plunge-freezing technical support. The authors declare no competing or financial interests.
Funding Statement
This work was funded by ALBA synchrotron grant 2015021150. SOLEIL synchrotron grants 20140219, 20141082, and 20150869. Saclay Plant Sciences-SPS grant ANR-17-EUR-0007.
References
- Agulleiro, J. I. & Fernandez, J. J. (2015). J. Struct. Biol. 189, 147–152. [DOI] [PubMed]
- Bouchez, I., Pouteaux, M., Canonge, M., Genet, M., Chardot, T., Guillot, A. & Froissard, M. (2015). Biol. Open, 4, 764–775. [DOI] [PMC free article] [PubMed]
- Cermelli, S., Guo, Y., Gross, S. P. & Welte, M. A. (2006). Curr. Biol. 16, 1783–1795. [DOI] [PubMed]
- Chagnot, C., Vénien, A., Peyrin, F., Jamme, F., RéFrégiers, M., Desvaux, M. & Astruc, T. (2015). Analyst, 140, 4189–4196. [DOI] [PubMed]
- Cheng, J. L., Fujita, A., Ohsaki, Y., Suzuki, M., Shinohara, Y. & Fujimoto, T. (2009). Histochem. Cell Biol. 132, 281–291. [DOI] [PubMed]
- Cheung, M. C., Evans, J. G., McKenna, B. & Ehrlich, D. J. (2011). Cytometry A, 79, 920–932. [DOI] [PMC free article] [PubMed]
- Cinquin, B., Maigre, L., Pinet, E., Chevalier, J., Stavenger, R. A., Mills, S., RéFrégiers, M. & Pagès, J. M. (2015). Sci. Rep. 5, 17968. [DOI] [PMC free article] [PubMed]
- Czabany, T., Wagner, A., Zweytick, D., Lohner, K., Leitner, E., Ingolic, E. & Daum, G. (2008). J. Biol. Chem. 283, 17065–17074. [DOI] [PubMed]
- Dyer, J. M., Stymne, S., Green, A. G. & Carlsson, A. S. (2008). Plant J. 54, 640–655. [DOI] [PubMed]
- Fei, W., Shui, G., Gaeta, B., Du, X., Kuerschner, L., Li, P., Brown, A. J., Wenk, M. R., Parton, R. G. & Yang, H. (2008). J. Cell Biol. 180, 473–482. [DOI] [PMC free article] [PubMed]
- Fei, W., Shui, G., Zhang, Y., Krahmer, N., Ferguson, C., Kapterian, T. S., Lin, R. C., Dawes, I. W., Brown, A. J., Li, P., Huang, X., Parton, R. G., Wenk, M. R., Walther, T. C. & Yang, H. (2011). PLoS Genet. 7, e1002201. [DOI] [PMC free article] [PubMed]
- Gao, Q. & Goodman, J. M. (2015). Front. Cell. Dev. Biol. 3, 49. [DOI] [PMC free article] [PubMed]
- Groen, J., Conesa, J. J., Valcárcel, R. & Pereiro, E. (2019). Biophys. Rev. pp. 611–619. [DOI] [PMC free article] [PubMed]
- Hashemi, H. F. & Goodman, J. M. (2015). Curr. Opin. Cell Biol. 33, 119–124. [DOI] [PMC free article] [PubMed]
- Jacquier, N., Choudhary, V., Mari, M., Toulmay, A., Reggiori, F. & Schneiter, R. (2011). J. Cell Sci. 124, 2424–2437. [DOI] [PubMed]
- Jamme, F., Kascakova, S., Villette, S., Allouche, F., Pallu, S., Rouam, V. & RéFrégiers, M. (2013). Biol. Cell, 105, 277–288. [DOI] [PubMed]
- Jamme, F., Villette, S., Giuliani, A., Rouam, V., Wien, F., Lagarde, B. & RéFrégiers, M. (2010). Microsc. Microanal. 16, 507–514. [DOI] [PubMed]
- Kory, N., Farese, R. V. Jr & Walther, T. C. (2016). Trends Cell Biol. 26, 535–546. [DOI] [PMC free article] [PubMed]
- Kremer, J. R., Mastronarde, D. N. & McIntosh, J. R. (1996). J. Struct. Biol. 116, 71–76. [DOI] [PubMed]
- Lei, D., Yu, Y., Kuang, Y. L., Liu, J., Krauss, R. M. & Ren, G. (2019). Biochim. Biophys. Acta Mol. Cell. Biol. Lipids, 1864, 260–270. [DOI] [PMC free article] [PubMed]
- Mahamid, J., Tegunov, D., Maiser, A., Arnold, J., Leonhardt, H., Plitzko, J. M. & Baumeister, W. (2019). Proc. Natl Acad. Sci. USA, 116, 16866–16871. [DOI] [PMC free article] [PubMed]
- Müller, W. G., Bernard Heymann, J., Nagashima, K., Guttmann, P., Werner, S., Rehbein, S., Schneider, G. & McNally, J. G. (2012). J. Struct. Biol. 177, 179–192. [DOI] [PMC free article] [PubMed]
- Ohsaki, Y., Suzuki, M. & Fujimoto, T. (2014). Chem. Biol. 21, 86–96. [DOI] [PubMed]
- Olzmann, J. A. & Carvalho, P. (2019). Nat. Rev. Mol. Cell Biol. 20, 137–155. [DOI] [PMC free article] [PubMed]
- Parkinson, D. Y., McDermott, G., Etkin, L. D., Le Gros, M. A. & Larabell, C. A. (2008). J. Struct. Biol. 162, 380–386. [DOI] [PMC free article] [PubMed]
- Pérez-Berná, A. J., Rodríguez, M. J., Chichón, F. J., Friesland, M. F., Sorrentino, A., Carrascosa, J. L., Pereiro, E. & Gastaminza, P. (2016). ACS Nano, 10, 6597–6611. [DOI] [PubMed]
- Pyc, M., Cai, Y., Greer, M. S., Yurchenko, O., Chapman, K. D., Dyer, J. M. & Mullen, R. T. (2017). Trends Plant Sci. 22, 596–609. [DOI] [PubMed]
- Robenek, H., Buers, I., Robenek, M. J., Hofnagel, O., Ruebel, A., Troyer, D. & Severs, N. J. (2011). J. Lipids, 2011, 409371. [DOI] [PMC free article] [PubMed]
- Sandager, L., Gustavsson, M. H., Ståhl, U., Dahlqvist, A., Wiberg, E., Banas, A., Lenman, M., Ronne, H. & Stymne, S. (2002). J. Biol. Chem. 277, 6478–6482. [DOI] [PubMed]
- Seo, A. Y., Lau, P. W., Feliciano, D., Sengupta, P., Gros, M. A. L., Cinquin, B., Larabell, C. A. & Lippincott-Schwartz, J. (2017). eLife, 6, 27. [DOI] [PMC free article] [PubMed]
- Sherman, M. B., Orlova, E. V., Decker, G. L., Chiu, W. & Pownall, H. J. (2003). Biochemistry, 42, 14988–14993. [DOI] [PubMed]
- Sorrentino, A., Nicolás, J., Valcárcel, R., Chichón, F. J., Rosanes, M., Avila, J., Tkachuk, A., Irwin, J., Ferrer, S. & Pereiro, E. (2015). J. Synchrotron Rad. 22, 1112–1117. [DOI] [PubMed]
- Tauchi-Sato, K., Ozeki, S., Houjou, T., Taguchi, R. & Fujimoto, T. (2002). J. Biol. Chem. 277, 44507–44512. [DOI] [PubMed]
- Thiam, A. R. & Beller, M. (2017). J. Cell Sci. 130, 315–324. [DOI] [PubMed]
- Uchida, M., Sun, Y., McDermott, G., Knoechel, C., Le Gros, M. A., Parkinson, D., Drubin, D. G. & Larabell, C. A. (2011). Yeast, 28, 227–236. [DOI] [PMC free article] [PubMed]
- Van Kempen, G. M. P., Van Vliet, L. J., Verveer, P. J. & Van Der Voort, H. T. M. (1997). J. Microsc. 185, 354–365.
- Vergalli, J., Dumont, E., Pajović, J., Cinquin, B., Maigre, L., Masi, M., RéFrégiers, M. & Pagés, J. M. (2018). Nat. Protoc. 13, 1348–1361. [DOI] [PubMed]
- Vindigni, J. D., Wien, F., Giuliani, A., Erpapazoglou, Z., Tache, R., Jagic, F., Chardot, T., Gohon, Y. & Froissard, M. (2013). Biochim. Biophys. Acta, 1828, 1881–1888. [DOI] [PubMed]
- Welte, M. A. (2015). Curr. Biol. 25, R470–R481. [DOI] [PMC free article] [PubMed]
- Zeskind, B. J., Jordan, C. D., Timp, W., Trapani, L., Waller, G., Horodincu, V., Ehrlich, D. J. & Matsudaira, P. (2007). Nat. Methods, 4, 567–569. [DOI] [PubMed]


