

Summary
Multiparental genetic mapping populations such as nested‐association mapping (NAM) have great potential for investigating quantitative traits and associated genomic regions leading to rapid discovery of candidate genes and markers. To demonstrate the utility and power of this approach, two NAM populations, NAM_Tifrunner and NAM_Florida‐07, were used for dissecting genetic control of 100‐pod weight (PW) and 100‐seed weight (SW) in peanut. Two high‐density SNP‐based genetic maps were constructed with 3341 loci and 2668 loci for NAM_Tifrunner and NAM_Florida‐07, respectively. The quantitative trait locus (QTL) analysis identified 12 and 8 major effect QTLs for PW and SW, respectively, in NAM_Tifrunner, and 13 and 11 major effect QTLs for PW and SW, respectively, in NAM_Florida‐07. Most of the QTLs associated with PW and SW were mapped on the chromosomes A05, A06, B05 and B06. A genomewide association study (GWAS) analysis identified 19 and 28 highly significant SNP–trait associations (STAs) in NAM_Tifrunner and 11 and 17 STAs in NAM_Florida‐07 for PW and SW, respectively. These significant STAs were co‐localized, suggesting that PW and SW are co‐regulated by several candidate genes identified on chromosomes A05, A06, B05, and B06. This study demonstrates the utility of NAM population for genetic dissection of complex traits and performing high‐resolution trait mapping in peanut.
Keywords: nested‐association mapping, pod weight, seed weight, association mapping, linkage mapping, candidate genes, peanut
Introduction
Peanut (Arachis hypogaea L.) is a cash crop with high market and nutritional values. The major focus of breeding is to increase the yield, which is directly proportional to the number of pods per plant, pod weight and seed weight (Gomes and Lopez, 2005). Preferences related to traits such as oil contents, oleic acid contents, relatively large seed size and testa colour drive demand from industries and consumers ensuring higher prices in national and international markets (Gangurde et al., 2019; Venuprasad et al., 2011). Earlier reports on correlation between seed mass, oil and protein contents showed linear increases in oil and protein contents with increased seed mass (Dwivedi et al., 1990). Significant variation is available in the cultivated gene pool for seed weight, and several conventional breeding programs are also targeting for large‐seeded peanut (Venuprasad et al., 2011). Some earlier reports on the inheritance of pod and seed size in peanut showed that large pod and seed size were dominant to small pod and seed (Balaiah et al., 1977; Layrisse et al., 1980), while other studies reported small pods to be dominant over large pods (Gibori et al., 1978). Seed size also had been reported to be controlled by a single gene (Balaiah et al., 1977), three genes (Pattanashetti et al., 2008) or five genes (Martin, 1967). Others suggested quantitative inheritance of seed weight with additive gene action (Garet, 1976), epistatic effects (Upadhyaya et al., 1992) or maternal inheritance (Hariprasanna et al., 2008).
Quantitative trait locus (QTL) mapping studies have been used in peanut for genetic dissection of complex traits, mainly based on biparental populations (Guo et al., 2016; Kumar et al., 2019; Pandey et al., 2017a, 2017b; Wang et al., 2017), including peanut pod size and weight (Chavarro et al., 2019; Hake et al., 2017; Luo et al., 2017). Multiparental mapping populations or next‐generation mapping populations, such as NAM (nested‐association mapping) and MAGIC (Multi‐parent Advanced Generation Inter‐Cross), have already shown their potential in maize (Yu et al., 2008), wheat (Mackay et al., 2014) and soybean (Xavier et al., 2015). Multiparent populations have advantages over biparental populations as they produce additional recombination breakpoints and increase the allelic diversity and power of QTL detection (Yu et al., 2008). Availability of a high‐density genotyping platform with uniformly distributed genomewide genetic markers is critical for high‐resolution genetic dissection of complex traits and tracking the favourable alleles in a breeding population (Pandey et al., 2012; Pandey et al., 2016; Varshney et al., 2013). Reference genome sequences of both wild diploid progenitors A. ipaensis and A. duranensis (Bertioli et al., 2016; Chen et al., 2016; Lu et al., 2018), as well as allotetraploid cultivated peanut A. hypogaea (Bertioli et al., 2019; Chen et al., 2019; Zhuang et al., 2019), have recently been assembled by the international peanut community and are important resources for sequence‐based trait mapping and candidate gene discovery. This has also facilitated the development of high‐resolution SNP arrays in peanut (Clevenger et al., 2017; Pandey et al., 2017b), which have shown great utility in fine trait mapping in other crops such as rice (Thomson et al., 2017), soybean (Xavier et al., 2018), maize (Yan et al., 2010), wheat (Wang et al., 2014), chickpea (Roorkiwal et al., 2018) and pigeonpea (Saxena et al., 2018; Yadav et al., 2019).
Several years ago, U.S. peanut research community developed two NAM mapping populations with two common parents (Tifrunner and Florida‐07) and eight diverse, unique parents, resulting in 16 biparental recombinant inbred line (RIL) families in order to maximize genetic diversity while meeting practical breeding objectives (Holbrook et al., 2013). The primary objective of this developed genetic resource was to share these populations with the peanut research community and to undertake high‐resolution phenotyping of these populations (Chu et al., 2018; Holbrook et al., 2013). The parents represent a wide range of agronomic, morphological and disease resistance traits, and some biparental populations have been studied for resistance to early and late leaf spot diseases (Chu et al., 2019; Clevenger et al., 2018). These two NAM populations thus could combine the strengths of both linkage and association mapping since the NAM populations have higher power QTL detection as compared with biparental mapping populations (Guo et al., 2016; Wang et al., 2017; Yu et al., 2008). Most importantly, this combination of power and resolution could resolve associations down to the gene level in identified genomic regions. Using a subset of Set A of this collection (Holbrook et al., 2013) which was only available at that time, we assembled two NAM populations with a 2 × 4 design, NAM_Tiftunner (581 lines) and NAM_Florida‐07 (496 lines), to demonstrate both utility and power of the NAM approach for trait dissection of 100‐pod weight (PW) and 100 seed weight (SW) in peanut. These populations were genotyped using the Axiom_Arachis 58K SNP array (Clevenger et al., 2017; Pandey et al., 2017b) and phenotyped for 2 years of 2015 and 2016, followed by QTL linkage mapping and genomewide association study (GWAS). This report demonstrates the utility and power of the NAM approach in peanut by producing a high‐density genetic map and identifying QTLs and SNP–trait associations (STAs) with greater significance than those observed in biparental populations (Chavarro et al., 2019; Hake et al., 2017; Luo et al., 2017) in pod and seed weights. These identified markers and candidate genes shed light on potential mechanisms controlling pod and seed development in peanut and may serve as useful markers in molecular breeding programs.
Results
Phenotypic variation for pod weight and seed weight in NAM populations
Significant variation was recorded for 100 pod weight (PW) and 100 seed weight (SW), and the mid‐parental values for PW and SW were close to the population mean. Violin plots showed normal distribution for PW and SW for both populations (Figure 1). Transgressive segregants were observed for PW and SW among the RILs, indicating multigenic inheritance of the traits. There were significant positive correlations between pod weight and seed weight in all two years environments. Little variation was observed between the seasons for PW and SW (Figure 1a, 1B; Tables S1 and S2; Figure S1).
Figure 1.
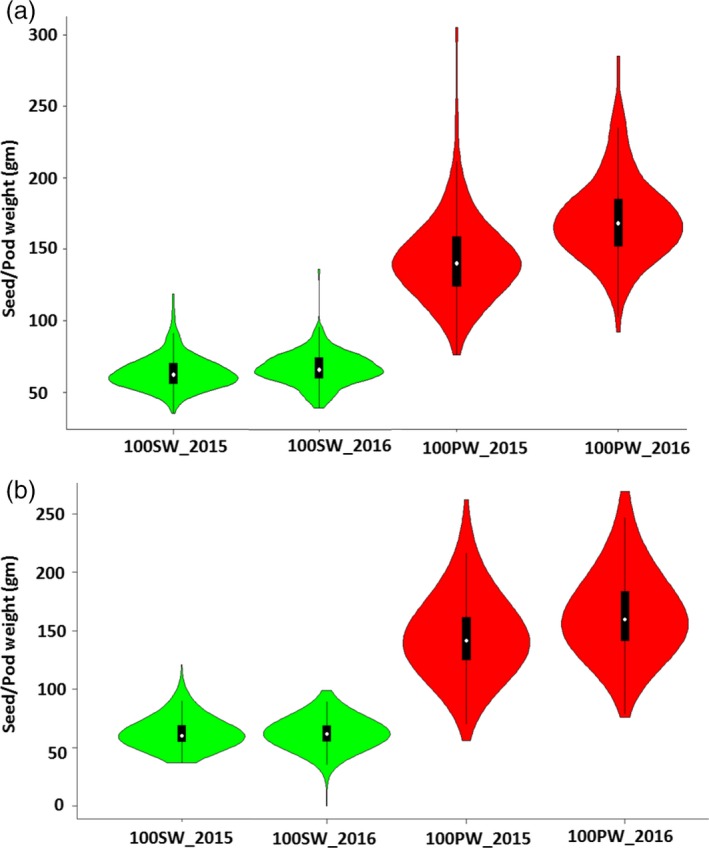
Violin plots represent the variation available in phenotypic data for pod weight and seed weight in nested‐association mapping (NAM) populations. (a) NAM_Tifrunner and (b) NAM_Florida‐07 during season 2015 and 2016.
High‐density genetic maps for NAM populations
A total of 3874 polymorphic SNPs were used in genetic map construction in NAM‐T. A genetic map was constructed with a total of 3311 polymorphic SNPs spanning 20 linkage groups (Figure 2a). This genetic map achieved a distance of 2,585.9 cM with a map density of 0.77 cM/locus. A total of 1663 and 1678 SNP loci were mapped to the A‐ and B‐ subgenomes, covering 1249 cM and 1336 cM, respectively. The A‐ and B‐ subgenomes achieved a map density of 0.75 and 0.79 cM/locus. The number of mapped loci ranged from 109 on A01 to 238 on B02, while the length of the LGs ranged from 90 cM for A01 to 225 cM for A04. B04 was the densest linkage group with 224 SNP loci mapped achieving a map density of 2.3 loci/cM.
Figure 2.
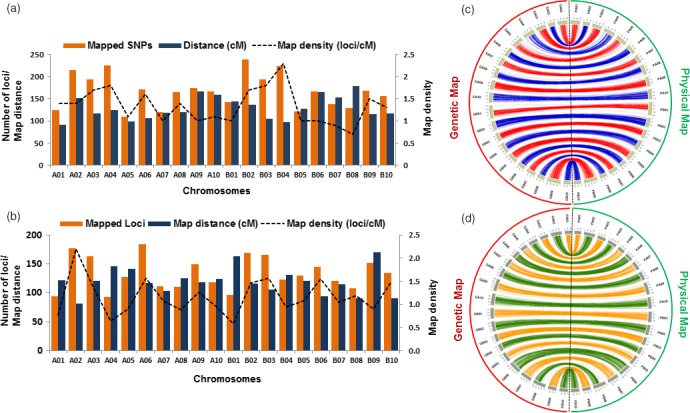
Summary of genetic maps. (a) NAM_Tifrunner, (b) NAM_Florida‐07 with mapped loci, map distance (cM) and map density (loci/cM), (c) collinearity of genetic map with reference genomes (A and B subgenomes) using NAM_Tifrunner population. (d) Collinearity of genetic maps with reference genomes (A and B subgenome) constructed using NAM_Florida‐07 population. The prefix G stands for genetic map on left‐hand side whereas, prefix P stands for corresponding physical map on right‐hand side.
Similarly, a total of 2860 poly‐high‐resolution SNPs were used for construction of a dense genetic map for NAM‐F. A dense genetic map was constructed with 2668 SNPs with a map distance of 2393.4 cM and marker density of 1.1 SNP/cM (Figure 2b). There were 192 SNPs not considered for linkage analysis because of segregation distortion or lack of linkage. A total of 1 326 SNP loci were mapped in the A subgenome spanning 1 197.1 cM, whereas 1 342 SNP loci were mapped in the B subgenome spanning 1 196.3 cM distance. The marker density in both subgenomes was 1.1 loci/cM. The lowest numbers of SNPs were mapped on A04 (93 SNP loci) with the lowest marker density of 0.64 SNP loci/cM. The highest numbers of SNPs (184 SNP loci) were mapped on A06 with a marker density 1.57 SNP loci/cM. A02 had 177 SNPs mapped but had the highest marker density of 2.19 SNPs/cM. Mapping statistics for both NAM populations can be found in (Table S3).
Highly collinear genetic and physical map
Both genetic maps showed good collinearity with the reference genome sequences of progenitors, A. duranensis and A. ipaensis. Syntenic regions between the genetic maps (cM) and physical maps (Mb) could be clearly observed on circos plots (Figure 2c,d).
QTLs for pod weight (PW) and seed weight (SW) in NAM‐T and NAM‐F populations
This study revealed several genomic regions using Joint Inclusive Composite Interval Mapping (JICIM) for PW and SW in both NAM populations (Table 1). A total of 19 QTLs for PW and SW were identified in NAM‐T, whereas 23 QTLs for PW and SW were identified in NAM‐F. The majority of the genomic regions with major effects were identified on chromosomes A05 and B05.
Table 1.
QTLs identified for pod and seed weights in nested‐association mapping (NAM) populations, NAM_Tifrunner (NAM‐T) and NAM_Florida‐07 (NAM‐F)
| QTL name | Chr | Year | Position (cM) | Left flanking marker | Right flanking marker | Marker interval (cM) | LOD | PVE (%) |
|---|---|---|---|---|---|---|---|---|
| QTLs identified in NAM‐T | ||||||||
| 100 Pod weight | ||||||||
| qPW_A05‐1 | A05 | 2015, 2016 | 62 | Affx‐152071156 | Affx‐152081918 | 3.4 | 9.4 | 32.6 |
| qPW_A05‐2 | A05 | 2015, 2016 | 18.1 | Affx‐152072578 | Affx‐152034828 | 1.2 | 9.8 | 33.3 |
| qPW_A05‐3 | A05 | 2015, 2016 | 25.3 | Affx‐152034514 | Affx‐152068537 | 2.1 | 12.1 | 30.4 |
| qPW_A06 | A06 | 2015 | 62.1 | Affx‐152028854 | Affx‐152042541 | 0.7 | 4.1 | 10.6 |
| qPW_B05 | B05 | 2015, 2016 | 53.2 | Affx‐152030151 | Affx‐152052489 | 0.6 | 8 | 34.3 |
| qPW_B06‐1 | B06 | 2015 | 86.2 | Affx‐152074118 | Affx‐152039395 | 5 | 3.8 | 22.1 |
| qPW_B06‐2 | B06 | 2015 | 56.3 | Affx‐152063867 | Affx‐152068866 | 6.2 | 6.1 | 16 |
| qPW_B07 | B07 | 2016 | 23.2 | Affx‐152075138 | Affx‐152061032 | 0.8 | 3.6 | 16.3 |
| 100 Seed weight | ||||||||
| qSW_A05‐1 | A05 | 2015, 2016 | 18.2 | Affx‐152072578 | Affx‐152034828 | 1.2 | 5.7 | 30.6 |
| qSW_A05‐2 | A05 | 2015, 2016 | 62.6 | Affx‐152071156 | Affx‐152081918 | 3.4 | 5.3 | 20.1 |
| qSW_A06‐1 | A06 | 2016 | 65.5 | Affx‐152028938 | Affx‐152030506 | 0.8 | 3.7 | 18.2 |
| qSW_A06‐2 | A06 | 2015 | 55.4 | Affx‐152050526 | Affx‐152049487 | 1.4 | 3.1 | 11.8 |
| qSW_A08 | A08 | 2016 | 92.5 | Affx‐152034595 | Affx‐152050655 | 2.9 | 3.4 | 25.3 |
| qSW_B05 | B05 | 2015, 2016 | 53.1 | Affx‐152030151 | Affx‐152052489 | 0.6 | 4.3 | 26.1 |
| qSW_B06‐1 | B06 | 2016 | 55.8 | Affx‐152026905 | Affx‐152044809 | 2.5 | 5.1 | 24.4 |
| qSW_B06‐2 | B06 | 2015 | 86.7 | Affx‐152074118 | Affx‐152040518 | 1.7 | 3.8 | 22.1 |
| qSW_B07‐1 | B07 | 2015 | 43.6 | Affx‐152070761 | Affx‐152061732 | 0.9 | 8.7 | 25.3 |
| qSW_B07‐2 | B07 | 2016 | 147.2 | Affx‐152034806 | Affx‐152027501 | 9.4 | 10.8 | 19.8 |
| qSW_B09 | B09 | 2015, 2016 | 61.3 | Affx‐152030882 | Affx‐152074441 | 2.8 | 4.5 | 19.2 |
| QTLs identified in NAM‐F | ||||||||
| 100 Pod weight | ||||||||
| qPW_A05‐3 | A05 | 2015, 2016 | 5.2 | Affx‐152077044 | Affx‐152051452 | 4.8 | 4.9 | 26.1 |
| qPW_A05‐2 | A05 | 2015, 2016 | 140.1 | Affx‐152026889 | Affx‐152055218 | 14 | 4.3 | 21.8 |
| qPW_A05‐1 | A05 | 2015, 2016 | 16.4 | Affx‐152083713 | Affx‐152066050 | 7.5 | 3.9 | 27.4 |
| qPW_A06‐1 | A06 | 2015 | 32.5 | Affx‐152031222 | Affx‐152041766 | 1.5 | 4 | 13 |
| qPW_A09‐1 | A09 | 2016 | 105.6 | Affx‐152070384 | Affx‐152079906 | 2.7 | 5.3 | 16.3 |
| qPW_B05‐1 | B05 | 2015, 2016 | 88.3 | Affx‐152038129 | Affx‐152069488 | 0.9 | 3.3 | 27 |
| qPW_B05‐2 | B05 | 2015, 2016 | 57.7 | Affx‐152078919 | Affx‐152079844 | 1.8 | 3.4 | 31 |
| qPW_B05‐3 | B05 | 2015, 2016 | 56.8 | Affx‐152031298 | Affx‐152078919 | 1 | 3.3 | 19.4 |
| qPW_B05‐4 | B05 | 2015, 2016 | 22.8 | Affx‐152076736 | Affx‐152028895 | 0.7 | 4.3 | 22 |
| qPW_B06‐2 | B06 | 2016 | 74.5 | Affx‐152080402 | Affx‐152041157 | 0.8 | 5.3 | 32.3 |
| qPW_B06‐1 | B06 | 2015 | 16.6 | Affx‐152043214 | Affx‐152073378 | 1.4 | 4.2 | 14.6 |
| qPW_B09‐1 | B09 | 2015, 2016 | 112.4 | Affx‐152065486 | Affx‐152081633 | 1.6 | 3.8 | 16.7 |
| 100 seed weight | ||||||||
| qSW_A05‐1 | A05 | 2015, 2016 | 11.2 | Affx‐152083713 | Affx‐152066050 | 7.5 | 4.2 | 28 |
| qSW_A05‐3 | A05 | 2015, 2016 | 139.3 | Affx‐152026889 | Affx‐152055218 | 14 | 7.7 | 40.3 |
| qSW_A05‐2 | A05 | 2015, 2016 | 2.2 | Affx‐152061849 | Affx‐152044122 | 2.3 | 3.4 | 17.9 |
| qSW_A06‐1 | A06 | 2015 | 82.3 | Affx‐152083869 | Affx‐152039817 | 0.4 | 4.7 | 30.7 |
| qSW_A07‐1 | A07 | 2016 | 78.3 | Affx‐152042213 | Affx‐152081932 | 1.4 | 5.8 | 34 |
| qSW_B05‐1 | B05 | 2015, 2016 | 109.4 | Affx‐152041353 | Affx‐152079400 | 0.8 | 3.4 | 21.2 |
| qSW_B05‐2 | B05 | 2015, 2016 | 57.7 | Affx‐152078919 | Affx‐152079844 | 1.8 | 4.6 | 35 |
| qSW_B05‐3 | B05 | 2015, 2016 | 22.8 | Affx‐152076736 | Affx‐152028895 | 0.7 | 9 | 40 |
| qSW_B06‐1 | B06 | 2015 | 74.6 | Affx‐152080402 | Affx‐152041157 | 0.8 | 4 | 34.3 |
| qSW_B06‐2 | B06 | 2016 | 50.2 | Affx‐152028010 | Affx‐152051179 | 0.4 | 3.6 | 35.7 |
| qSW_B06‐3 | B06 | 2015 | 81.3 | Affx‐152048400 | Affx‐152027597 | 1.5 | 7 | 36.2 |
LOD, Logarithm of odds; PVE, phenotypic variance explained.
In the NAM‐T, for the trait of PW, there were eight QTLs identified with LOD scores of 3.6 to 12.1 and PVE% of 10.6 to 34.3. The QTL qPW_B05 identified on chromosome B05 explained the highest PVE of 34.3% with LOD 8.0 for PW. There were two QTLs on chromosome A05 for PW, qPW_A05‐1 and qPW_A05‐2, with over 30% PVE, which also had significant impact on SW (qSW_A05‐1 and qSW_A05‐2), with over 20% PVE (Table 1; Figure 3b). Similarly, for the trait of SW, there were 11 QTLs identified with LOD scores of 3.1 to 10.8 and 11.8 to 30.6 PVE%. The QTL qSW_A05‐1 which was identified as a major QTL for SW (5.7 LOD and 30.6 PVE %) seems to share same genomic regions where another QTL (qPW_A05‐2) was identified for PW (9.8 LOD and 33.3 PVE %). A major QTL for SW was identified on chromosome B09 with 4.5 LOD and 19.2% PVE. One QTL on chromosome A08 was identified for SW with major effect on SW (25.3% PVE). Two QTLs were identified on chromosome B07 showing significant influence on SW. There were genomic regions mostly associated with PW and SW on chromosome A05, B05, A06 and B06 (Table 1; Figure 3b).
Figure 3.
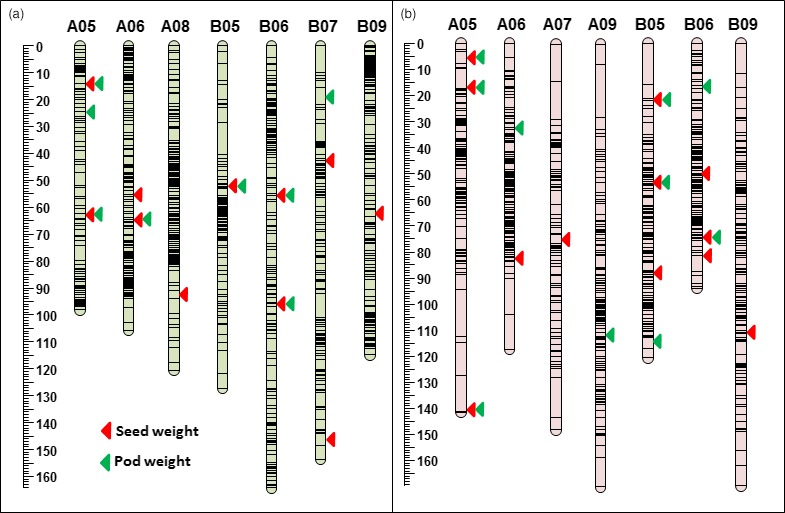
Genomic regions (QTLs) identified for pod weight (PW) and seed weight (SW) in linkage analysis. (a) QTLs identified for pod weight and seed weight using NAM_Tifrunner population. (b) QTLs identified for pod weight and seed weight using NAM_Florida‐07 population. Red triangles for SW and green triangles for PW.
In the NAM‐F, 12 QTLs were identified for PW with LOD scores of 3.3 to 5.3 and PVE from 13.0% to 32.3%, including three QTLs on chromosome A05 and four on B05 (Table 1). The highest PVE was recorded for the QTL qPW_B06‐2 mapped on chromosome B06 at 74.0 cM with LOD 5.3 and 32.3% PVE. Chromosomes A09 and B09 also showed QTLs controlling PW with 16% PVE for each QTL. Similarly, there were 11 QTLs identified for SW with LOD scores of 3.4 to 9.0 and 17.9 to 40.3 PVE%. The QTL qSW_A05‐3 for SW with the highest PVE was identified on chromosome A05 at 139.0 cM with 7.7 LOD value and 40.3% PVE (Table 1). Similarly, in the B subgenome, a QTL qSW_B05‐3 was identified on B05 at 22.0 cM for SW with 9 LOD and 39.7 PVE%. Interestingly, five genomic regions were identified as common regions for both PW and SW on chromosomes A05, B05 and B06 (Figure 3a).
GWAS for pod weight (PW) and seed weight (SW) in NAM‐T and NAM‐F populations
GWAS results on the NAM‐T population identified 24 potential STAs strongly associated with PW and SW (Table 2). A total of 18 STAs were associated with SW with P value range of 17.5–5.1. All highly associated STAs for SW were identified on chromosomes A05 and B05. Some SNPs were also identified on chromosome A06 and B06 showing minor influence on SW. Additionally, six STAs were identified on A05 and A06 chromosomes with potential candidate genes having reported roles in seed and pod development corresponding to STAs. The SNP on A05 at Affx‐152034807 showed strong association with both PW and SW in all consecutive seasons. Interestingly, all the STAs on chromosomes A05 and A06 were found consistently associated with both SW and PW in both years 2015 and 2016 with very high P values. Similarly, for PW, 20 highly significant STAs were identified with P value range of 17.5–5.3. Almost, all the SNPs identified were associated with both SW and PW on four chromosomes (A05, A06, B05 and B06). Surprisingly, five STAs were identified as unique STAs for just PW on chromosome B07. In the NAM‐T GWAS analysis, 15 SNPs on chromosomes A05, A06, B05 and B06 showed strong and equal association with PW and SW (Table 2; Figure 4; Table S4).
Table 2.
SNP–trait associations (STAs) and genes corresponding to STAs identified in the NAM_Tifrunner population
| SNP | Position in diploid genomes | STA in QTL region | Trait | Year | P val | Gene ID | Position of genes in tetraploid genome (AABB) | Function | |||
|---|---|---|---|---|---|---|---|---|---|---|---|
| Chr | Position | Chr | Start | End | |||||||
| Affx‐152078443 | A05 | 61633387 | qPW_A05‐1 | SW | 2016 | 9.2 | Aradu.398CK | Ahy05 | 69058788 | 69056547 | Leucine‐rich repeats |
| Affx‐152026623 | A05 | 93303050 | qPW_A05‐2 | SW, PW | 2015, 2016 | 10.3 | Aradu.V498C | Ahy05 | 99487216 | 99488936 | Nucleoside triphosphatases |
| Affx‐152044207 | A05 | 93522747 | qPW_A05‐2 | SW, PW | 2015, 2016 | 13.4 | Aradu.L6QML | Ahy05 | 99718318 | 99718870 | myb transcription factor |
| Affx‐152034807 | A05 | 95201614 | qPW_A05‐2 | SW, PW | 2015, 2016 | 17.5 | Aradu.H6YZR | Ahy05 | 101322384 | 101321914 | Protein kinase superfamily protein |
| Affx‐152037557 | A05 | 95646799 | qPW_A05‐2 | SW, PW | 2015, 2016 | 17.1 | Aradu.5R3CV | Ahy05 | 101804803 | 101804290 | Unknown protein |
| Affx‐152068240 | A05 | 95688122 | qPW_A05‐2 | SW, PW | 2015, 2016 | 17.4 | Aradu.4D2H2 | Ahy05 | 37914722 | 37914949 | Sphingolipid transporter |
| Affx‐152060972 | A05 | 97867243 | qPW_A05‐3 | SW, PW | 2015, 2016 | 9.2 | Aradu.217QF | Ahy05 | 104262628 | 104264458 | Pentatricopeptide repeats (PPR) |
| Affx‐152029724 | A06 | 101049365 | qPW_A06 | SW, PW | 2015, 2016 | 5.4 | Aradu.0Y2ZI | Ahy06 | 106073906 | 106074903 | Concanavalin A‐like lectin/glucanase |
| Affx‐152072200 | A06 | 101055956 | qPW_A06 | SW, PW | 2015, 2016 | 6.4 | Aradu.Z1KSU | Ahy06 | 106081510 | 106081280 | Unknown protein |
| Affx‐152042916 | A06 | 101212919 | qPW_A06 | SW, PW | 2015, 2016 | 10.4 | Aradu.X5WFU | Ahy06 | 106322915 | 106323963 | Transcription factor jumonji |
| Affx‐152034258 | A06 | 101214044 | qPW_A06 | SW, PW | 2015, 2016 | 9.9 | Aradu.X5WFU | Ahy06 | 106322915 | 106323963 | Transcription factor jumonji |
| Affx‐152044720 | A06 | 101300979 | qPW_A06 | SW, PW | 2015, 2016 | 7.7 | Aradu.5LG80 | Ahy06 | 106389203 | 106388512 | Plastid‐lipid‐associated protein (PAP) |
| Affx‐152041119 | A06 | 101302040 | ‐ | SW, PW | 2015, 2016 | 9.3 | Aradu.FL7G4 | Ahy07 | 5968474 | 5968026 | Plastid‐lipid‐associated protein (PAP) |
| Affx‐152058135 | A09 | 71878357 | ‐ | SW | 2016 | 7.4 | Aradu.20W1Q | Ahy09 | 72158341 | 72158836 | Basic leucine zipper |
| Affx‐152072236 | B05 | 17051675 | qPW_B05 | SW, PW | 2015, 2016 | 12.2 | Araip.22PIW | Ahy15 | 17648595 | 17650297 | Acyl‐CoA synthetase |
| Affx‐152073838 | B05 | 93426656 | qPW_B05 | SW, PW | 2015, 2016 | 13.9 | Araip.N2NX2 | Ahy15 | 99201207 | 99201565 | GDP‐fucose protein O fucosyltransferase |
| Affx‐152075875 | B06 | 125101917 | qPW_B06‐2 | PW | 2015 | 5.3 | Araip.YL4Q6 | Ahy16 | 138952178 | 138951677 | Uncharacterized protein |
| Affx‐152035548 | B06 | 125236516 | qPW_B06‐2 | SW, PW | 2015, 2016 | 9.3 | Araip.DII6F | Ahy16 | 139079635 | 139080408 | Transcription factor jumonji |
| Affx‐152033888 | B07 | 119939393 | qPW_B07‐2 | SW | 2016 | 5.1 | Araip.Z2RR8 | Ahy17 | 128309992 | 128309051 | Protein kinase family protein |
| Affx‐152067055 | B07 | 1931980 | qPW_B07‐1 | PW | 2016 | 5.6 | Araip.H8C7N | Ahy17 | 2860547 | 2863439 | C2H2‐like zinc finger protein |
| Affx‐152054860 | B07 | 1941111 | qPW_B07‐1 | PW | 2016 | 5.8 | Araip.G1WAG | Ahy17 | 2870129 | 2869673 | Heat‐shock protein binding |
| Affx‐152028948 | B07 | 1944622 | qPW_B07‐1 | PW | 2016 | 5.4 | Araip.05GH3 | Ahy17 | 2877877 | 2878795 | Mitochondrial transcription termination |
| Affx‐152043830 | B07 | 1945325 | qPW_B07‐1 | PW | 2016 | 5.7 | Araip.R0K9W | Ahy17 | 2877794 | 2876876 | CCCH‐type zinc finger protein |
| Affx‐152069626 | B07 | 648238 | ‐ | PW | 2016 | 6.8 | Araip.Y2DTS | Ahy17 | 1514508 | 1513921 | Polygalacturonase |
Figure 4.
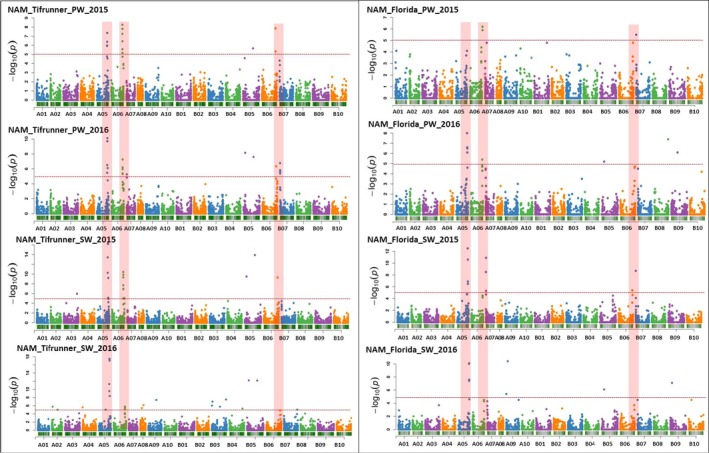
SNP–Trait Associations (STAs) for pod weight (PW) and seed weight (SW) identified using genomewide association study in NAM_Tifrunner and NAM_Florida‐07 populations. Manhattan plots represent the associations for PW and SW. For the NAM‐T, four plots are for PW and SW in two seasons for the years 2015 and 2016. Indicated as NAM_Tifrunner_PW_2015, NAM_Tifrunner_PW_2016, NAM_Tifrunner_SW_2015, NAM_Tifrunner_SW_2016. Similarly, for the NAM‐F, four plots were constructed for PW and SW for two season data during the year 2015 and 2016. Indicated as NAM_Florida_PW_2015, NAM_Florida_PW_2016, NAM‐Florida_SW_2015 and NAM_Florida_SW_2016. The SNPs on chromosomes A05, A06, B06 and B07 highlighted with red colour indicate consistently high association with PW and SW across the seasons.
In the association panel of NAM‐F, the GWAS results showed a total of 14 STAs significantly associated with PW and SW (Table 3). A total of 10 STAs were found associated with PW located on chromosomes A05, A06, A07, B06, B07 and B09 with p values ranging from 5.4 to 8.7. The SNP Affx‐152042939 was found highly associated with PW with p value of 8.0 and SW with p value of 12.5. A total of 12 STAs were detected for SW. Interestingly, there were eight STAs identified as common STAs for both SW and PW on chromosomes A05, A06, A07, B06 and B07 (Table 3; Figure 4; Figure S2; Table S5).
Table 3.
SNP–trait associations (STAs) and genes corresponding to STAs identified in the NAM_Florida‐07 population
| SNP | Position in diploid genome | STA in QTL region | Trait | Year | P‐val | Gene ID | Position of genes in tetraploid genome | Gene features | |||
|---|---|---|---|---|---|---|---|---|---|---|---|
| Chr | Position | Chr | Start | End | |||||||
| Affx‐152042939 | A05 | 100238896 | qPW_A05‐2 | SW, PW | 2015, 2016 | 8 | Aradu.G6GR7 | Ahy05 | 106199976 | 106200416 | Nodulin MtN21 |
| Affx‐152030262 | A05 | 101618480 | qPW_A05‐2 | SW, PW | 2015, 2016 | 6.6 | Aradu.PTC1G | Ahy05 | 107409300 | 107409642 | Spermidine synthase |
| Affx‐152073472 | A05 | 101953436 | qPW_A05‐2 | SW, PW | 2015, 2016 | 6.5 | Aradu.GEE52 | Ahy05 | 107743343 | 107743653 | Mannose‐1‐phosphate guanylyltransferase |
| Affx‐152041326 | A05 | 101972210 | qPW_A05‐2 | SW, PW | 2015, 2016 | 6.1 | Aradu.VSE1D | Ahy05 | 107758493 | 107758020 | E2F transcription factor |
| Affx‐152051216 | A06 | 105402882 | qPW_B06‐2 | PW | 2016 | 5.4 | Aradu.U4S3Y | Ahy06 | 108174915 | 108174330 | ATP‐binding ABC transporter |
| Affx‐152074153 | A07 | 1191903 | qSW_A07‐1 | SW, PW | 2015, 2016 | 6.2 | Aradu.DN3DB | Ahy07 | 429296 | 430399 | STERILE APETALA |
| Affx‐152065804 | A07 | 1473208 | qSW_A07‐1 | SW | 2015 | 5.3 | Aradu.HR82P | Ahy07 | 702139 | 701523 | ALG‐2 interacting protein |
| Affx‐152040866 | A07 | 88041 | ‐ | SW, PW | 2015, 2016 | 5.9 | Aradu.P9PXC | Ahy17 | 1437155 | 1436877 | Rho GDP dissociation inhibitor |
| Affx‐152032205 | A09 | 13985238 | qPW_A09‐1 | SW | 2016 | 10.4 | Aradu.VVP26 | Ahy09 | 14192792 | 14193209 | Aminoacyl‐tRNA ligases |
| Affx‐152077418 | A09 | 967133 | ‐ | SW | 2016 | 5.4 | Aradu.N0F41 | Ahy09 | 746523 | 745565 | XH/XS domain‐containing protein |
| Affx‐152043067 | B06 | 129731047 | qSW_B06‐1 | SW, PW | 2015 | 5.4 | Araip.CA56R | Ahy16 | 146391458 | 146392020 | unknown protein |
| Affx‐152052942 | B07 | 454008 | ‐ | SW, PW | 2015, 2016 | 8.7 | Araip.6B9LC | Ahy17 | 482067 | 481316 | Transmembrane emp24 domain‐containing protein p24beta2‐like |
| Affx‐152028084 | B09 | 16205446 | qPW_B09‐1 | SW | 2016 | 7.1 | Araip.25DGX | Ahy19 | 16462456 | 16462950 | Helicase‐like protein |
| Affx‐152036034 | B09 | 57421497 | qPW_B09‐1 | PW | 2016 | 6.1 | Araip.M90GE | Ahy19 | 58395165 | 58394788 | Cytidine/deoxycytidylate deaminase |
In the association panel of the NAM‐T, PW‐ and SW‐related genes were identified such as protein kinase superfamily protein, sphingolipid transporter, myb transcription factor, acyl‐CoA synthetase, plastid‐lipid‐associated protein PAP, pentatricopeptide repeat (PPR), sucrose synthase (Table 2). The identified genes are known for crucial role in seed and pod development. In the association panel, NAM‐F (Table 3), nodulin MtN21 (Aradu.G6GR7), transporters of the amino acid and auxins, showed association with the SNP loci mapped on chromosome A05. This SNP has been potentially associated with PW and SW across the seasons consistently. Spermidine synthase (Aradu.PTC1G) has been reported for its role in embryonic development which was equally associated with PW and SW consistently. E2F transcription factor (Winged helix‐turn‐helix DNA‐binding domain) (Aradu.VSE1D) corresponded to the QTL on chromosome A05 identified for PW and SW. Mannose‐1‐phosphate guanylyltransferase (Aradu.GEE52) relates to the QTL on chromosome A05 has been recorded in two seasons for SW. Acetylglucosaminyl transferase enzyme which is essential for the processing of high‐mannose to hybrid and complex N‐glycans (Araip.SZ4VC) which corresponds to SNP on chromosome B05. Helicases (Araip.25DGX) showed significant association with both SW and PW, which shares the QTL location on chromosome B09. The rho GDP dissociation inhibitor is responsible for root architecture which corresponds to the QTL on chromosome A07. The transmembrane emp24 domain involves in protein trafficking, which relates to the QTL on chromosome B07. Aminoacyl‐tRNA ligases near SNP on chromosome A09 identified for SW.
Overlapping genomic regions in linkage and association analysis
In both NAM populations, co‐localized STAs in QTL regions were identified for PW and SW. In NAM‐T population (Table 2; Figure 5), single STA (Affx‐152078443) was identified in QTL region qPW_A05‐1. Five STAs (Affx‐152026623, Affx‐152044207, Affx‐152034807, Affx‐152037557, and Affx‐152068240) with P‐value range of 10.3–17.5 were identified for PW and SW located in QTL region qPW_A05‐2 on chromosome A05. These STAs are detected in both years due to point mutations such as A›G and A›C. One STA (Affx‐152060972) was detected in QTL region qPW_A05‐3 on chromosome A05. Five STAs (Affx‐152029724, Affx‐152072200, Affx‐152042916, Affx‐152034258 and Affx‐152044720) were detected in QTL region qPW_A06. These STAs also were detected in both years for PW and SW and could be caused by the point mutations at A›G and T›G. Two STAs (Affx‐152072236, Affx‐152073838) were identified in QTL region qPW_B05 on chromosome B05, while four STAs were detected in QTL region qPW_B07‐1 on chromosome B07 (Table 2). In NAM‐F population (Table 3; Figure 5), four STAs (Affx‐152042939, Affx‐152030262, Affx‐152073472 and Affx‐152041326) were detected in QTL region qPW_A05‐2, which all the STAs were associated with PW and SW in both years and could be linked to the point mutation at A›C, T›C and A›G. Two STAs (Affx‐152074153 and Affx‐152065804) were identified in QTL region qSW_A07‐1. One STA was identified in QTL region qSW_B06‐1 on chromosome B06. Two STAs were identified in QTL region qPW_B09‐1 chromosome B09. Majority of the STAs are possible linked to the A›G transition. These common genomic regions provide more confidence for further gene discovery and fine mapping studies for PW and SW.
Figure 5.
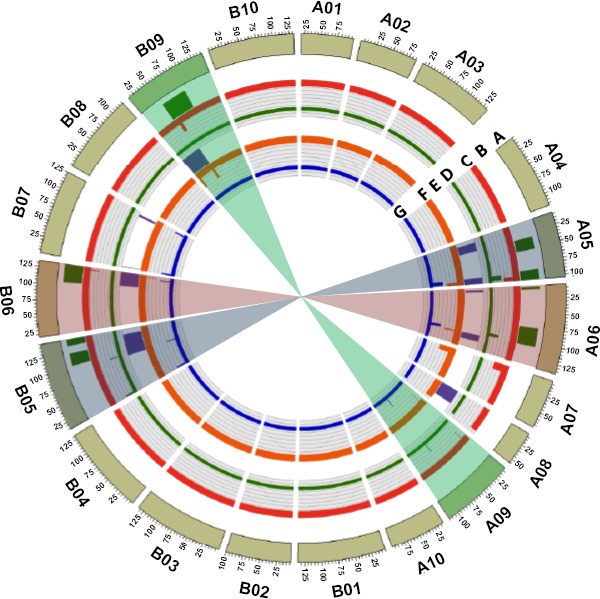
Circos plot represents summary of genomic regions identified in genomewide association study and genetic mapping for pod weight and seed weight in NAM_Tifrunner and NAM_Florida‐07 populations. (a) peanut pseudomolecules from A subgenome are depicted as A01 to A10 and that of B subgenome depicted as B01 to B10; (b) QTLs identified for pod weight and seed weight in NAM_Florida‐07; (c) STAs identified for seed weight in NAM_Florida‐07; (d) STAs identified for pod weight in NAM_Florida‐07; (e) QTLs identified for pod weight and seed weight in NAM_Tifrunner population; (f) STAs identified for seed weight in NAM_Tifrunner; (g) STAs identified for pod weight in NAM_Tifrunner. STAs overlapping in QTL regions were identified on chromosome A05, A06, B05, B06 and B09.
Discussion
Next‐generation mapping populations (such as NAM, MAGIC) allow intensive genome reshuffling making them suitable for high‐resolution mapping due to broad genetic diversity created through high numbers of recombination events. Emerging next‐generation sequencing technologies (NGS) also have accelerated genomic‐assisted breeding by making the discovery of genetic variation more affordable. Peanut is an allotetraploid legume with large genome size (~2.7 Gb) and narrow genetic diversity, which is the bottleneck for dense genetic mapping. SNP arrays and whole‐genome resequencing (WGRS) are the advanced NGS technologies producing maximum data points for high‐density genetic mapping. Both peanut progenitor genome sequences, A. duranensis (A genome) and A. ipaensis (B genome) (Bertioli et al., 2016; Chen et al., 2016; Lu et al., 2018), are available with annotations. Recently, assemblies of reference genome have also become available for cultivated peanut (Bertioli et al., 2019; Chen et al., 2019; Zhuang et al., 2019) and will increase the efficiency of such studies in the future. In this study, we have used two NAM populations of set A (Chu et al., 2018; Holbrook et al., 2013) and a highly informative ‘Axiom_Arachis’ SNP array which was based on two peanut progenitor genome sequences (Chavarro et al., 2019; Clevenger et al., 2017; Pandey et al., 2017b) for genotyping both NAM populations.
SNP array‐based high‐density genetic maps for multiparent populations
This report demonstrated the advantages of phenotypic analysis of nested‐association mapping (NAM) populations in peanut, combined with genomewide SNP genotyping over the earlier developed SSR‐based genetic maps that were sparse and, therefore, resulted in low genome coverage with possible absence of relevant recombination breakpoints. The fewer recombination events and narrow genetic diversity in biparental RIL populations may result in poor QTL detection power (Gangurde et al., 2019). In this study, we were reporting two dense genetic maps of 3,341 loci for NAM‐T and 2,668 loci for NAM‐F population. The map distance for NAM‐T and NAM‐F was 2586.0 cM and 2393.7 cM, respectively, which are very close to the physical map distance of 2538 Mb (excluding scaffolds) of tetraploid peanut genome (Bertioli et al., 2019). Earlier constructed genetic maps for individual RIL populations were not very dense due to less allelic diversity and few recombination events. Recently, a genetic map of 585 loci using genotyping‐by‐sequencing (GBS) was used for mapping stem rot resistance in peanut (Dodia et al., 2019). A SSR‐based genetic map was developed for mapping aflatoxin resistance with 1219 loci (1175 SSR markers and 42 transposon markers) in 2037.75 cM (Yu et al., 2019). Most of the studies reported the genetic maps between a range of 600–1500 loci in biparental populations, except a WGRS based genetic map with 8869 loci in 3120 cM (Agarwal et al., 2018). In other crops, similar studies using NAM populations successfully dissected the genetics of complex traits and facilitated candidate gene discovery, such as in soybean (Song et al., 2017; Xavier et al., 2018), maize (McMullen et al., 2009; Yu et al., 2008), wheat (Hu et al., 2018; Jordan et al., 2018) and rice (Fragoso et al., 2017). In most of these studies, the GWAS analysis was performed in NAM populations instead of constructing genetic maps. In this study, we constructed a consensus genetic map based on the genotypic data generated from the four families of each NAM population. The genetic map information successfully facilitated QTL discovery in these NAM populations, which provided an opportunity for comparing results with GWAS analysis for SW and PW in peanut.
Linkage and association analyses uncover candidate genomic regions and genes controlling pod and seed weights
In peanut, the genetic dissection of important traits has been carried out using QTL mapping of segregating RIL populations derived from biparental crosses (Agarwal et al., 2018; Chavarro et al., 2019; Lu et al., 2018; Luo et al., 2018; Pandey et al., 2016). The NAM design has been successful in several crops to exploit the benefits of both joint linkage analysis and association mapping simultaneously in rapeseed and maize (Hu et al., 2018; McMullen et al., 2009) to dissect the genetic basis of complex quantitative traits. In this study, NAM design was used for identification of genomic regions by genetic mapping on two NAM populations, and we performed GWAS by keeping into account the genetic effects produced by each family. The associated SNPs within QTL regions could track the potential genes associated with PW and SW. The traits of PW and SW are the polygenic traits controlled by several genes (Han et al., 2012; Liu et al., 2015). Joint inclusive composite interval linkage mapping identified QTL with major effects for flowering time‐related traits in a maize NAM population (Li et al., 2016) and inflorescence size (Wu et al., 2016). In this study, genomic regions were discovered as co‐located genome regions on chromosomes A05 and B05 controlling both PW and SW. Earlier studies using low‐dense SSR‐based genetic maps reported 14 QTLs with ~17% PVE for PW and SW under drought stress (Ravi et al., 2011; Varshney et al., 2009) leading to identification of small effect QTLs. A genetic mapping study of a RIL population reported three significant QTLs located in a region of 2.7 Mb at the end of chromosome A05 for SW (Luo et al., 2017). In GWAS analysis, five marker–trait associations (MTAs) identified for seed weight using SSRs and DArT loci (Pandey et al., 2014). Recently, a major QTL identified on chromosome A05 for seed number per pod using a biparental cross (Chen et al., 2019). QTL meta‐analysis using consensus map narrowed down the QTL region to 0.7 cM on chromosome A05 (Lu et al., 2018). In this study, seven and four STAs identified in NAM‐T and NAM‐F, respectively, co‐located in QTL regions of PW and SW in both seasons on chromosomes A05. Chu et al. (2019) identified a QTL on B05 overlaps for pod yield and LLS resistance. Interestingly, in this study we also reported QTLs for both PW and SW in both NAM populations on B05. STA (Affx‐152030262) corresponds to spermidine synthase (spds) on A05 controlling seed size in cereals as reported in rice (Tao et al., 2018). Luo et al. (2018) reported SNPs associated with high shelling percentage on chromosome A09 and B02 in peanut. However, this study identified a STA (Affx‐152032205) with a high p‐value (10.0) which was located on chromosome A09 in the vicinity of SNP identified for shelling percentage.
Candidate genes identified regulating seed and pod weight
In this study, the flanking sequences of the genes were surrounded by significantly associated STAs, which are called as potential candidate genes. Among these genes, we focused only those which are having relevance to the traits of PW and SW from their functional annotations available (://www.peanutbase.org). Direct orthologues of a gene with related function in other species were also taken into consideration.
Few genes identified in this study were reported earlier for their direct role in regulation of SW and PW in other species. The STA (Affx‐152030262) on chromosome A05 corresponding to the spermidine and spermine, which were reported as low molecular organic cations and found in organisms from bacteria to plants and animals (Alcázar et al., 2006). Orthologues of spermidine synthase (spds) have been reported to play a role in embryonic development (Yoshihisa et al., 2004). Editing of spermidine synthase using RNAi resulted in malformation of the embryos which affects seed weight in rice (Imai et al., 2004). Spds has been reported for its role in regulation of seed size, yield and seed germination (Tao et al., 2018). An E2F factor corresponding to STA (Affx‐152041326) was identified on chromosome A05 which is reported for its major role in cell growth and proliferation as well as in development of the seed coat (Tim et al., 2009). Mannose‐1‐phosphate guanylyltransferase that was flanked by the STA (Affx‐152041326) plays a vital role in plant development and cell‐wall architecture as it mediates N‐linked glycosylation for cellulose biosynthesis (Wolfgang et al., 2001). Cellulose is important component of peanut seed coat and pod shells (Wan et al., 2016); hence, the mannose‐1‐phosphate guanylyltransferase might be involved in the regulation of PW and seed coat of seed. Nodulin was identified on chromosome (A05) flanked by STA (Affx‐152042939) reported to be expressed in root nodules and seed as well as pods (Clevenger et al., 2016). Nodulins have an important role in transporting nutrient, solutes and hormones throughout plant growth and development (Denance et al., 2014). During pod filling, nodulins might be playing a major role for solute transport which may be affecting seed weight and pod weight.
As PW and SW are very complex traits, STAs with small effects were also identified which may involve as activators or enhancers in regulation of important genes (Table 2). Aradu.H6YZR (protein kinase) was reported to be involved in the various biochemical pathways such as nutrient signalling, protein phosphorylation. Two kinases SNRK2.2 and SNRK2.3 regulate abscisic acid (ABA) levels which affects seed germination, dormancy and seedling growth in Arabidopsis (Fujii et al., 2007). Aradu.4D2H2 (sphingolipid) the proteins play a role in the endosome/lysosome storage, signal transduction across the plasma membrane, plasma membrane stability and the structural components of cell wall (Chao et al., 2011). However, sphingolipids are not very closely associated with the pod or seed development. Aradu.L6QML (transcription factor MYB62) plays an important role in various cellular processes such as resistance against biotic, abiotic stresses and developmental processes (Ambawat et al., 2013). MYB89 (R2R3‐MYB transcription factor) highly expresses in developing seed during maturation which acts as a repressor for oil accumulation in seeds. The knockout of MYB89 factor resulted into high oil accumulation in myb89‐1 mutants in Arabidopsis (Li et al., 2017). Araip.22PIW (acyl‐CoA synthetase) serving as the carbon source for fatty acid biosynthesis in Arabidopsis which triggers oil accumulation in seed therefore might be associated with seed mass (Lin and Oliver, 2008). Transcription factor jumonji is a class of proteins in Arabidopsis reported to be involved in the regulation of flowering with other transcriptional factor (Noh et al., 2004). Knockdown of a jumonji JMJ524 in tomato resulted into shrunken leaves and shortened internodes, but increased levels of gibberellic acid (GA3) reported in mutants (Li et al., 2015). Plastid‐lipid‐associated protein (PAP) (Aradu.FL7G4) involved in the sequestration of hydrophobic compounds such as lipids into seed endosperm. PAPs interact with MYB transcription factors during ABA metabolism which mediates signal transduction in response to biotic and abiotic stresses (Leitner‐Dagan et al., 2006). Pentatricopeptide repeats (Aradu.217QF) play role in cellular organelles interactions, organelles biogenesis, photosynthesis and respiration (Barkan and Small, 2014). Sucrose synthase (Aradu.PD37S) plays role in starch and sucrose metabolism, crucial in determining the source and sink loading during transportation of photosynthesis products into seed and pod (Baroja‐Fernandez et al., 2012). Acetylglucosaminyl transferase enzyme has been reported for vitamin C biosynthesis in the plant cell wall (Strasser et al., 2005). Helicases reported for their role in DNA repair and nucleotide metabolisms in plants (Raikwar et al., 2015).
Two subgenomes share responsibility for pod and seed development in peanut
As the B subgenome (A. ipaensis) of cultivated peanut is highly similar to the A subgenome of (A. duranensis) (Bertioli et al., 2016), most of the genes have two copies representing their respective genomes. This has resulted in the association of phenotypic data with genomic regions (homologues) from both subgenomes. In support of this, we identified genomic regions on A05/B05, A06/B06, A07/B07 and A09/B09 for SW; also, SNPs for PW were identified on A06/B06 and A07/B07. Interestingly, as the PW and SW are dependent and associated traits, we identified similar candidate genes on chromosomes A06, B06, A07 and B07. The information generated from this study would further help in selecting favourable haplotypes from both the subgenomes to achieve desirable seed and pod features in peanut.
Conclusion
Until now, only biparental and natural germplasm collections were deployed in peanut for conducting trait mapping and association studies for important traits. This study used a NAM approach using peanut research community developed resource to perform high‐resolution mapping and gene discovery for two important yield‐related traits, that is, seed weight and pod weight. This study also applied the high‐density 58K SNP genotyping assay, Axiom_Arachis, which further improved the resolution of trait mapping. Being complex traits, the genetic and GWAS analyses identified potential genomic regions and candidate genes over eight chromosomes (A05, A06, A08, A09, B05, B06, B08 and B09) for seed weight and pod weight. Candidate genes were identified such as spermidine synthase (spds), nodulins, pentatricopeptide repeats, E2F and acyl‐CoA synthetases, which may play a significant role in the regulation of pod and seed development and warrant further investigation. The QTLs and STAs identified in this study also serve as a source for potential selectable markers for assistance in molecular breeding selection for new cultivars with desired seed and pod weight for improved yield and the development of lines with seed size specifications meeting the needs of oil, food and confectionary manufacturers.
Material and methods
Plant material and phenotyping
Two NAM populations namely ‘NAM_Tifrunner’ (NAM‐T) and ‘NAM_Florida‐07’ (NAM‐F) were defined by using a subset of the Set A (which was only available at that time) RIL populations developed by peanut research community (Chu et al., 2018; Holbrook et al., 2013), two runner cultivars (Tifrunner and Florida‐07) as common parents and four unique parents of N08082olJCT, C76‐16, NC 3033 and GP‐NC WS16 (SPT 06‐06) (Tallury et al., 2014). NAM‐T had 581 RILs and NAM‐F had 496 RILs. NAM‐T has subsets of 161, 162, 132 and 125 RILs and NAM‐F has subsets of 120, 105, 92 and 179 RILs. The subsets of RILs from both NAMs and six parental lines were planted at the USDA‐ARS Belflower Farm, Tifton, GA, for two years (2015 and 2016) for phenotyping of 100‐pod weight (PW) and 100‐seed weight (SW). The NAM lines were planted in two‐row plots (1.5 m long with 90‐cm row space), separated by an alley of 3 m at a seeding rate of six seeds per 0.3 m. Standard agronomical practices for peanut cultivation in Georgia were followed, and no fungicide was applied during the growing seasons. After harvest and drying to less than 10% water content, 100 pods and 100 seeds were picked randomly and weighed for PW and SW traits. Each plot was sampled three times as replications.
DNA extraction and genotyping with ‘Axiom_Arachis’ array
DNA samples from all the NAM lines used in this study were extracted from young leaves using Thermo Scientific GeneJET Plant Genomic DNA Purification Mini Kit. The DNA samples were checked for quality on 0.8% agarose gels and quantified on a Nanodrop 8000 Spectrophotometer (Thermo Scientific, Pittsburgh, PA). Affymetrix GeneTitan platform was used to genotype both NAM populations with the 58K SNP ‘Axiom_Arachis’ array (Clevenger et al., 2017; Pandey et al., 2017b). Initially, the target probes for 581 samples for NAM‐T and 496 samples for NAM‐F were prepared using a minimum of 20 μL DNA with a concentration 10 ng/μL. The samples were then amplified, fragmented and hybridized on the array chip followed by single‐base extension through DNA ligation and signal amplification according to the procedure explained in the Affymetrix Axiom® 2.0 Assay Manual (http://axiom_2_assay_auto_workflow_user_guide.pdf). The GeneTitan Multi‐Channel Instrument (Affymetrix, Santa Clara, CA, USA) was then used for staining and scanning the samples to derive the genotypic information for each line. The genotypic data for each line were generated and stored in the form of.CEL file format.
SNP allele calling and quality analysis
The SNP allele calling and data analyses were performed following the process mentioned in Pandey et al. (2017b). Initially, the Axiom™ Analysis Suite version 1.0 was used for allele calling by importing.CEL files. Subsequently, we used ‘Best Practices’ workflow to perform quality control (QC) analysis of samples to select only those samples which passed the QC test for further analysis. The ‘Sample QC’ workflow was then used to produce genotype calls for the samples which passed QC analysis using ‘Best Practices Workflow’. The ‘Genotyping’ workflow was used to perform genotyping on the imported.CEL files regardless of the sample QC matrix. Before making the genotyping calls, samples not passing the QC were removed as their inclusion may reduce the quality of the analysed results. Finally, the ‘Summary Only’ workflow was used to produce a summary containing details on the intensities for the probe sets for use in copy number analysis tools. It also allows exporting the SNP data after the analysis are completed for downstream analysis. The above criteria helped in removing the SNPs having low‐quality SNPs and keeping only the poly‐high‐resolution SNPs for the further analysis. The genotyping data from a total of 58 233 SNPs for both NAM populations were retrieved from Axiom analysis suit. The SNP IDs with their corresponding affymetrix IDs and other necessary details are attached in (Table S6). Polymorphic SNPs segregating within each RIL or segregating in at least two RILs were used for genetic map construction. All polymorphic SNPs regardless of segregation distortion with minor allele frequency (MAF = 0.25) and missing threshold (misThr = 0.8) were considered for GWAS. In NAM‐T, 3876 polymorphic SNPs were used for linkage analysis, while a total of 11 520 polymorphic SNPs were used in the GWAS analysis. In NAM‐F, 2860 polymorphic SNPs were used for linkage analysis, while 7672 polymorphic SNPs were used in the GWAS analysis using the R package NAM (Xavier et al., 2015) (Figure S3). Adjacent markers which are 100% identical and carrying similar genotypic values were removed using the parameter perfect symmetry (psy = 1, for 100% symmetry) (Figure S4).
Construction of dense genetic maps
After filtering the complete genotypic data for the poly‐high‐resolution SNPs, individual SNPs were recoded as ‘B’ representing homozygous for the founder parents (C76‐16, N08082, NC 3033, SPT06‐06) and ‘A’ representing homozygous for common parents (Tifrunner and Florida‐07), ‘H’ representing heterozygous and ‘‐’ representing missing alleles. The genotyping data were first tested for segregation distortion for each SNP marker by a chi‐square test. The genetic map was constructed using JoinMap (v4.0) with LOD score 5.0 and a minimum recombination threshold of 50%. Identical SNP loci and lines were removed using the function ‘exclude identical’. The Kosambi map function was used for genetic map construction and to convert the recombination frequencies into map distances in centiMorgans (cM) (Kosambi, 1944). No attempt has been made to map the distorted SNP loci in the final genetic map. The final chromosome‐wise marker positions with their respective names then used to draw the final genetic map using MapChart (Voorrips, 2002).
Collinearity of genetic maps of NAM‐T and NAM‐F
Each linkage group in the genetic maps of NAM‐T and NAM‐F was numbered and oriented according to its homologous physical map of diploid candidate genomes A. ipaensis and A. duranensis (Bertioli et al., 2016). Synteny and collinearity between the maps were visually assessed in circus plot (Krzywinski et al., 2009) by using the position of mapped loci on respective genetic maps (cM) and physical map (bp).
Joint inclusive composite interval mapping
The genetic map and the phenotypic data were used for QTL analysis. A joint QTL mapping approach across the four families of each NAM‐T and NAM‐F populations was done using the joint inclusive composite interval mapping (JICIM) method implemented in IciMapping 4.1. The JICIM approach is effective and specially designed for joint QTL analysis of NAM populations (Buckler et al., 2009; Li et al., 2011). The genotypic data of both NAMs were recoded, where 0 represents homozygous for founder parent, 2 represents homozygous for common parent, 1 represents heterozygous, and −1 represents missing. QTL analysis was performed using a stepwise regression probability of 0.001. The LOD threshold was calculated by 1000 permutations at the P = 0.05 level. QTL effects were estimated as the phenotypic variance explained (PVE) and additive effects by the QTL. Scanning for QTLs was done at an interval of 5 cM, and a QTL was declared significant if the threshold was greater than the 1000 permutation of the trait data by resampling method (Churchill and Doerge, 1994). In JICIM, the additive effect from each family with their respective LOD scores and phenotypic variance were recorded for each QTL.
Genomewide association study and candidate gene discovery
Genomewide association analyses were performed using the multiparental model, namely mixed linear model (MLM) (Wei and Xu, 2016), implemented in R package for NAM population (Xavier et al., 2015) which followed Equation (1),
| (1) |
where y is the vector of phenotypes, Xβ is the design matrix and coefficients of fixed effects, here corresponding to the intercept, Z is the incidence matrix of the marker data, α is the vector of regression coefficients associated with marker effects within family, ψ corresponds to the polygenic coefficients, and ε is the vector of residuals. The model assumes that α ~ N (0, Iσ2 α), ψ~N (0, Kσ2 ψ) and ε~N (0, I ), where K regards kinship among lines framed by the genomic relationship matrix. Statistical significance of single markers was evaluated through the likelihood‐ratio test by comparing the log‐likelihood of the model that includes the marker effect (L1) with the log‐likelihood of the model that does not (L0). The association threshold to define significantly associated marker with the trait was computed with Bonferroni correction for multiple testing to mitigate false positives. Bonferroni is the most standard procedure, and it is super conservative. Bonferroni threshold (α = 0.05) yielding a threshold of approximately −log10 (0.05/3876) = 4.88 for NAM‐T and −log10 (0.05/2860) = 4.76 for NAM‐F. But, here we used an extra conservative threshold of 5 –log (P‐value) for both NAM populations.
The SNPs with significant associations were exploited for candidate gene discovery by using the annotation of diploid genomes, A. duranensis and A. ipaensis (://peanutbase.org ; Bertioli et al., 2016). The SNP subsiding start and end position of a gene was explored for candidate gene on the basis of their biological function annotation related to the trait of interest. There are possibilities of getting multiple SNPs on a gene segment which can be referred as haplotypes.
Conflict of interest
The authors declare that there is no conflict of interests.
Authors’ contribution
SSG, HW, SY, MKP performed data analyses and drafted the manuscript. JCF and AX assisted in data analysis and discussion. YC, CCH and POA developed the populations. HW and AKC assisted in field data collection. RKV and BG designed and finalized the manuscript. BG conceived the project, planned, secured extramural funds, and revised and submitted manuscript.
Supporting information
Figure S1 Frequency distribution plots representing the magnitude of phenotypic variation for pod weight (PW) and seed weight (SW) in NAM_Tifrunner and NAM_Florida‐07.
Figure S2 QQ plots against genotypic and phenotypic data represent the normal distribution for genotypic and phenotypic data.
Figure S3 Criteria used for filtering the SNPs on the basis of polymorphism and distortion for genetic mapping and genomewide association studies in NAM_Florida‐07 and NAM_Tifrunner population.
Figure S4 SNP density plots representing chromosomes wise distribution of SNPs used for genome‐wide association studies in (A) NAM_Tifrunner and (B) NAM_Florida‐07 populations.
Table S1 Phenotypic variability, heritability, skewness, kurtosis for pod weight (PW) and seed weight (SW) in NAM_Tirunner population.
Table S2 Phenotypic variability, heritability, skewness, kurtosis for pod weight (PW) and seed weight (SW) in NAM_Florida‐07 population.
Table S3 Summary of genetic map constructed using genotypic data generated using 58K SNP array on NAM_Tifrunner and NAM_Florida‐07 populations.
Table S4 Summary significantly associated SNPs identified for pod weight (PW) and seed weight (SW) in NAM_Tifrunner population with details of annotation of each gene corresponding to the SNPs and their biological role.
Table S5 Summary significantly associated SNPs identified for pod weight (PW) and seed weight (SW)in NAM_Florida‐07 population with details of annotation of each gene corresponding to the SNPs and their biological role.
Table S6 Details of SNPs on 58K ‘Axiom_Arachis’ SNP array used for genotyping NAM populations.
Acknowledgements
We thank Billy Wilson, Xiaohong Guo and Xianyuan Ji for technical assistance in the field and the laboratory. This work is partially supported by the U.S. Department of Agriculture Agricultural Research Service (USDA‐ARS), the Peanut Foundation, the Georgia Peanut Commission, National Peanut Board and CGIAR Research Program on Grain Legumes and Dryland Cereals (CRP‐GLDC) of the CGIAR. SSG acknowledges Department of Science and Technology (DST), Govt. of India, for the award of DST‐INSPIRE fellowship for his Ph.D. research. Mention of trade names or commercial products in this publication is solely for the purpose of providing specific information and does not imply recommendation or endorsement by the USDA. The USDA is an equal opportunity provider and employer.
Gangurde, S. S. , Wang, H. , Yaduru, S. , Pandey, M. K. , Fountain, J. C. , Chu, Y. , Isleib, T. , Holbrook, C. C. , Xavier, A. , Culbreath, A. K. , Ozias‐Akins, P. , Varshney, R. K. and Guo, B. (2020) Nested‐association mapping (NAM)‐based genetic dissection uncovers candidate genes for seed and pod weights in peanut (Arachis hypogaea). Plant Biotechnol. J., 10.1111/pbi.13311
Contributor Information
Rajeev K. Varshney, Email: r.k.varshney@cgiar.org.
Baozhu Guo, Email: baozhu.guo@usda.gov.
References
- Agarwal, G. , Clevenger, J. , Pandey, M.K. , Wang, H. , Shasidhar, Y. , Chu, Y. , Fountain, J.C. , et al (2018) High-density genetic map using whole-genome resequencing for fine mapping and candidate gene discovery for disease resistance in peanut. Plant Biotechnol. J. 16, 1954–1967. [DOI] [PMC free article] [PubMed] [Google Scholar]
- Alcázar, R. , Cuevas, J.C. , Patron, M. , Altabella, T. and Tiburcio, A.F. (2006) Abscisic acid modulates polyamine metabolism under water stress in Arabidopsis thaliana . Physiol. Plant. 128, 448–455. [Google Scholar]
- Ambawat, S. , Sharma, P. , Yadav, N.R. and Yadav, R.C. (2013) MYB transcription factor genes as regulators for plant responses: an overview. Physiol. Mol. Biol. Plants, 19, 307–321. [DOI] [PMC free article] [PubMed] [Google Scholar]
- Balaiah, C. , Reddy, P.S. and Reddi, M.V. (1977) Genetic analysis in groundnut. I. Inheritance studies on 18 morphological characters in crosses with Gujarat narrow leaf mutant. Proc. Indian. Acad. Sci. USA, 85, 340–350. [Google Scholar]
- Barkan, A. and Small, I. (2014) Pentatricopeptide repeat proteins in plants. Annu. Rev. Plant Boil. 65, 415–442. [DOI] [PubMed] [Google Scholar]
- Baroja‐Fernandez, E. , Munoz, F.J. , Li, J. , Bahaji, A. , Almagro, G. , Montero, M. , Etxeberria, E. et al (2012) Sucrose synthase activity in the sus1/sus2/sus3/sus4 Arabidopsis mutant is sufficient to support normal cellulose and starch production. Proc. Nat. Acad. Sci. USA, 109, 321–326. [DOI] [PMC free article] [PubMed] [Google Scholar]
- Bertioli, D.J. , Cannon, S.B. , Froenicke, L. , Huang, G. , Farmer, A.D. , Cannon, E.K. , Liu, X. et al (2016) The genome sequences of Arachis duranensis and Arachis ipaensis, the diploid ancestors of cultivated peanut. Nat. Genet. 48, 438–446. [DOI] [PubMed] [Google Scholar]
- Bertioli, D.J. , Jenkins, J. , Clevenger, J. , Gao, D. , Dudchenko, O. , Seijo, G. , Leal‐Bertioli, S.C.M. et al (2019) The genome sequence of peanut (Arachis hypogaea), a segmental allotetraploid. Nat. Genet. 51, 877–884. [DOI] [PubMed] [Google Scholar]
- Buckler, E.S. , Holland, J.B. , Bradbury, P.J. , Acharya, C.B. , Brown, P.J. , Browne, C. , Ersoz, E. et al (2009) The genetic architecture of maize flowering time. Science, 325, 714–718. [DOI] [PubMed] [Google Scholar]
- Chao, D.Y. , Gable, K. , Chen, M. , Baxter, I. , Dietrich, C.R. , Cahoon, E.B. , Guerinot, M.L. et al (2011) Sphingolipids in the root play an important role in regulating the leaf ionome in Arabidopsis thaliana . Plant Cell, 23, 1061–1081. [DOI] [PMC free article] [PubMed] [Google Scholar]
- Chavarro, C. , Chu, Y. , Holbrook, C.C. , Isleib, T. , Bertioli, D. , Hovav, R. , Butts, C. et al (2019) Genetic analysis of seed and pod traits in a set of recombinant inbred lines (RILs) in peanut (Arachis hypogaea L.). bioRxiv, 738914; 10.1101/738914. [DOI] [Google Scholar]
- Chen, X. , Li, H. , Pandey, M.K. , Yang, Q. , Wang, X. , Garg, V. , Li, H. et al (2016) Draft genome of the peanut A‐genome progenitor (Arachis duranensis) provides insights into geocarpy, oil biosynthesis, and allergens. Proc. Natl. Acad. Sci. USA, 113, 6785–6790. [DOI] [PMC free article] [PubMed] [Google Scholar]
- Chen, X. , Lu, Q. , Liu, H. , Zhang, J. , Hong, Y. , Lan, H. , Li, H. et al (2019) Sequencing of cultivated peanut, Arachis hypogaea, yields insights into genome evolution and oil improvement. Mol. Plant, 12, 920–934. [DOI] [PubMed] [Google Scholar]
- Chu, Y. , Holbrook, C.C. , Isleib, T.G. , Burow, M. , Culbreath, A.K. , Tillman, V. , Chen, J. et al (2018) Phenotyping and genotyping parents of sixteen recombinant inbred peanut populations. Peanut Sci. 45, 1–11. [Google Scholar]
- Chu, Y. , Chee, P. , Culbreath, A. , Isleib, T.G. , Holbrook, C.C. and Ozias‐Akins, P. (2019) Major QTLs for resistance to early and late leaf spot diseases are identified on chromosomes 3 and 5 in peanut (Arachis hypogaea). Front. Plant Sci. 10, 883. [DOI] [PMC free article] [PubMed] [Google Scholar]
- Churchill, G.A. and Doerge, R.W. (1994) Empirical threshold values for quantitative trait mapping. Genetics, 138, 963–971. [DOI] [PMC free article] [PubMed] [Google Scholar]
- Clevenger, J. , Chu, Y. , Chavarro, C. , Agarwal, G. , Bertioli, D.J. , Leal‐Bertioli, S.C.M. , Pandey, M.K. et al (2017) Genome‐wide SNP genotyping resolves signatures of selection and tetrasomic recombination in peanut. Mol. Plant, 10, 309–322. [DOI] [PMC free article] [PubMed] [Google Scholar]
- Clevenger, J. , Chu, Y. , Chavarro, C. , Botton, S. , Culbreath, A. , Isleib, T.G. , Holbrook, C.C. et al (2018) Mapping late leaf spot resistance in peanut (Arachis hypogaea) using QTL‐seq reveals markers for marker‐assisted selection. Front. Plant Sci. 9, 83. [DOI] [PMC free article] [PubMed] [Google Scholar]
- Clevenger, J. , Chu, Y. , Scheffler, B. and Ozias-Akins, P. . (2016) A developmental transcriptome map for allotetraploid Arachis hypogaea . Front. Plant Sci. 7, 1446 10.3389/fpls.2016.01446 [DOI] [PMC free article] [PubMed] [Google Scholar]
- Denance, N. , Szurek, B. and Noel, L.D. (2014) Emerging functions of nodulin‐like proteins in non‐nodulating plant species. Plant Cell Physiol. 55, 469–474. [DOI] [PubMed] [Google Scholar]
- Dodia, S.M. , Joshi, B. , Gangurde, S.S. , Thirumalaisamy, P.P. , Mishra, G.P. , Narandrakumar, D. , Soni, P. , et al (2019) Genotyping-by-sequencing based genetic mapping reveals large number of epistatic interactions for stem rot resistance in groundnut. Theor. Appl. Genet. 132, 1001–1016. [DOI] [PubMed] [Google Scholar]
- Dwivedi, S.L. , Thendapani, K. and Nigam, S.N. (1990) Heterosis and combining ability studies and relationship among fruit and seed characters in peanut. Peanut Sci. 16, 14–20. [Google Scholar]
- Fragoso, C.A. , Moreno, M. , Wang, Z. , Heffelfinger, C. , Arbelaez, L.J. , Aguirre, J.A. , Franco, N. et al (2017) Genetic architecture of a rice nested association mapping population. G3‐Genes Genom. Genet. 7, 1913–1926. [DOI] [PMC free article] [PubMed] [Google Scholar]
- Fujii, H. , Verslues, P.E. and Zhu, J.K. (2007) Identification of two protein kinases required for abscisic acid regulation of seed germination, root growth, and gene expression in Arabidopsis. Plant Cell, 19, 485–494. [DOI] [PMC free article] [PubMed] [Google Scholar]
- Gangurde, S.S. , Kumar, R. , Pandey, A.K. , Burow, M. , Laza, H.E. , Nayak, S.N. , Guo, B. et al. (2019) Climate‐smart groundnuts for achieving high productivity and improved quality: current status, challenges, and opportunities In Genomic Designing of Climate‐Smart Oilseed Crops (Kole C., ed.), pp. 133–172. Cham: Springer Nature Switzerland AG. [Google Scholar]
- Garet, B. (1976) Heterosis and combining abilities in groundnut (Arachis hypogaea L.). Oleagineux, 29, 435–442. [Google Scholar]
- Gibori, A. , Hillel, J. , Cahaner, A. and Ashri, A. (1978) A 9 × 9 diallel analysis in peanuts (A. hypogaea L.): flowering time, tops' weight, pod yield per plant and pod weight. Theor. Appl. Genet. 53, 169–179. [DOI] [PubMed] [Google Scholar]
- Gomes, R.L.F. and Lopez, A.C.D.A. (2005) Correlation and path analysis in peanut. Crop. Breed. Appl. Biotechnol. 5, 105–110. [Google Scholar]
- Guo, B.Z. , Khera, P. , Wang, H. , Peng, Z. , Sudini, H. , Wang, X. , Osiru, M. et al (2016) Annotation of trait loci on integrated genetic maps of Arachis species In Peanuts: Genetics, Processing, and Utilization (Stalker H.T. and Wilson R.F. ed.), pp. 163–207. Urbana, IL: Academic Press and the American Oil Chemists’ Society (AOCS) Press. [Google Scholar]
- Hake, A.A. , Shirasawa, K. , Yadawad, A. , Sukruth, M. , Patil, M. , Nayak, S.N. , Lingaraju, S. et al (2017) Mapping of important taxonomic and productivity traits using genic and non‐genic transposable element markers in peanut (Arachis hypogaea L.). PLoS ONE 12, e0186113. [DOI] [PMC free article] [PubMed] [Google Scholar]
- Han, Y. , Li, D. , Zhu, D. , Li, H. , Li, X. , Teng, W. and Li, W. (2012) QTL analysis of soybean seed weight across multi‐genetic backgrounds and environments. Theor. Appl. Genet. 125, 671–683. [DOI] [PubMed] [Google Scholar]
- Hariprasanna, K. , Lal, C. , Radhakrishnan, T. , Gor, H.K. and Chikani, B.M. (2008) Analysis of diallele cross for some physical‐quality traits in peanut (Arachis hypogaea L.). Euphytica, 160, 49–57. [Google Scholar]
- Holbrook, C.C. , Isleib, T.G. , Ozias‐Akins, P. , Chu, Y. , Knapp, S.J. , Tillman, B. , Guo, B. et al (2013) Development and phenotyping of recombinant inbred line (RIL) populations for peanut (Arachis hypogaea). Peanut Sci. 40, 89–94. [Google Scholar]
- Hu, J. , Guo, C. , Wang, B. , Ye, J. , Liu, M. , Wu, Z. , Xiao, Y. et al (2018) Genetic properties of a nested association mapping population constructed with semi‐winter and spring oilseed rapes. Front. Plant. Sci. 9, 1740. [DOI] [PMC free article] [PubMed] [Google Scholar]
- Imai, A. , Matsuyama, T. , Hanzawa, Y. , Akiyama, T. , Tamaoki, M. , Saji, H. , Shirano, Y. et al (2004) Spermidine synthase genes are essential for survival of Arabidopsis. Plant. Physiol. 135, 1565–1573. [DOI] [PMC free article] [PubMed] [Google Scholar]
- Jordan, K.W. , Wang, S. , He, F. , Chao, S. , Lun, Y. , Paux, E. , Sourdille, P. et al (2018) The genetic architecture of genome‐wide recombination rate variation in allopolyploid wheat revealed by nested association mapping. Plant J. 95, 1039–1054. [DOI] [PMC free article] [PubMed] [Google Scholar]
- Kosambi, D.D. (1944) The estimation of map distance from recombination values. Ann. Eugen. 12, 172–175. [Google Scholar]
- Krzywinski, M. , Schein, J. , Birol, I. , Connors, J. , Gascoyne, R. , Horsman, D. , Jones, S.J. et al (2009) Circos: an information aesthetic for comparative genomics. Genome Res. 19, 1639–1645. [DOI] [PMC free article] [PubMed] [Google Scholar]
- Kumar, R. , Pasupuleti, J. , Vishwakarma, M.K. , Khan, A. , Manohar, S.S. , Gangurde, S.S. , Murali, T.V. et al (2019) Whole genome re‐sequencing‐based QTL‐seq identified candidate genes and molecular markers for fresh seed dormancy in groundnut. Plant Biotechnol. J. 1–12. 10.1111/pbi.13266. [DOI] [PMC free article] [PubMed] [Google Scholar]
- Layrisse, A. , Wynne, J.C. and Isleib, T.G. (1980) Combining ability for yield, protein and oil of peanut lines from South American Centers of diversity. Euphytica, 29, 561–570. [Google Scholar]
- Leitner‐Dagan, Y. , Ovadis, M. , Shklarman, E. , Elad, Y. , David, D.R. and Vainstein, A. (2006) Expression and functional analyses of the plastid lipid‐associated protein CHRC suggest its role in chromoplastogenesis and stress. Plant Physiol. 142, 233–244. [DOI] [PMC free article] [PubMed] [Google Scholar]
- Li, H. , Bradbury, P. , Ersoz, E. , Buckler, E.S. and Wang, J. (2011) Joint QTL linkage mapping for multiple‐cross mating design sharing one common parent. PLoS ONE, 6, 17573. [DOI] [PMC free article] [PubMed] [Google Scholar]
- Li, J. , Yu, C. , Wu, H. , Luo, Z. , Ouyang, B. , Cui, L. , Ye, Z. et al (2015) Knockdown of a JmjC domain‐containing gene JMJ524 confers altered gibberellin responses by transcriptional regulation of GRAS protein lacking the DELLA domain genes in tomato. J. Exp. Bot. 66, 1413–1426. [DOI] [PMC free article] [PubMed] [Google Scholar]
- Li, Y.X. , Li, C. , Bradbury, P.J. , Liu, X. , Lu, F. , Romay, C.M. , Glaubitz, J.C. et al (2016) Identification of genetic variants associated with maize flowering time using an extremely large multi‐genetic background population. Plant J. 86, 391–402. [DOI] [PubMed] [Google Scholar]
- Li, D. , Jin, C. , Duan, S. , Zhu, Y. , Qi, S. , Liu, K. , Chen, M. et al (2017) MYB89 transcription factor represses seed oil accumulation. Plant Physiol. 173, 1211–1225. [DOI] [PMC free article] [PubMed] [Google Scholar]
- Lin, M. and Oliver, D.J. (2008) The role of acetyl‐coenzyme a synthetase in Arabidopsis. Plant Physiol. 147, 1822–1829. [DOI] [PMC free article] [PubMed] [Google Scholar]
- Liu, J. , Hua, W. , Hu, Z. , Yang, H. , Zhang, L. , Li, R. , Deng, L. et al (2015) Natural variation in ARF18 gene simultaneously affects seed weight and silique length in polyploid rapeseed. Proc. Natl. Acad. Sci. USA, 112, 5123–5132. [DOI] [PMC free article] [PubMed] [Google Scholar]
- Lu, Q. , Li, H. , Hong, Y. , Zhang, G. , Wen, S. , Li, X. , Zhou, G. et al (2018) Genome sequencing and analysis of the peanut B‐genome progenitor (Arachis ipaensis). Front. Plant. Sci. 3, 604. [DOI] [PMC free article] [PubMed] [Google Scholar]
- Luo, H. , Guo, J. , Ren, X. , Chen, W. , Huang, L. , Zhou, X. , Chen, Y. , et al. (2018) Chromosomes A07 and A05 associated with stable and major QTLs for pod weight and size in cultivated peanut (Arachis hypogaea L.). Theor. Appl. Genet. 131, 267–282. [DOI] [PubMed] [Google Scholar]
- Luo, H. , Ren, X. , Li, Z. , Xu, Z. , Li, X. , Huang, L. , Zhou, X. et al (2017) Co‐localization of major quantitative trait loci for pod size and weight to a 3.7 cM interval on chromosome A05 in cultivated peanut (Arachis hypogaea L.). BMC Genom. 18, 58. [DOI] [PMC free article] [PubMed] [Google Scholar]
- Mackay, I.J. , Bansept‐Basler, P. , Barber, T. , Bentley, A.R. , Cockram, J. , Gosman, N. , Greenland, A.J. et al (2014) An eight‐parent multiparent advanced generation inter‐cross population for winter‐sown wheat: creation, properties, and validation. G3 (Bethesda), 4, 1603–1610. [DOI] [PMC free article] [PubMed] [Google Scholar]
- Martin, J.P. (1967) Contribution a l’etude de certains caracteres d’importance agronomique chez l’arachide. Oleagineux, 22, 673–676. [Google Scholar]
- McMullen, M.D. , Kresovich, S. , Villeda, H.S. , Bradbury, P. , Li, H. , Sun, Q. , Flint‐Garcia, S. et al (2009) Genetic properties of the maize nested association mapping population. Science, 325, 737–740. [DOI] [PubMed] [Google Scholar]
- Noh, B. , Lee, S.H. , Kim, H.J. , Yi, G. , Shin, E.A. , Lee, M. , Jung, K.J. et al (2004) Divergent roles of a pair of homologous Jumonji/Zinc‐Finger–class transcription factor proteins in the regulation of Arabidopsis flowering time. Plant Cell, 16, 2601–2613. [DOI] [PMC free article] [PubMed] [Google Scholar]
- Pandey, M.K. , Monyo, E. , Ozias‐Akins, P. , Liang, X. , Guimarães, P. , Nigam, S.N. , Upadhyaya, H.D. et al (2012) Advances in Arachis genomics for peanut improvement. Biotechnol. Adv. 30, 639–651. [DOI] [PubMed] [Google Scholar]
- Pandey, M.K. , Upadhyaya, H.D. , Rathore, A. , Vadez, V. , Sheshshayee, M.S. , Sriswathi, M. , Govil, M. et al (2014) Genome wide association studies for 50 agronomic traits in peanut using the ‘reference set’ comprising 300 genotypes from 48 countries of the semi‐arid tropics of the world. PLoS ONE, 9, 105228. [DOI] [PMC free article] [PubMed] [Google Scholar]
- Pandey, M.K. , Roorkiwal, M. , Singh, V. , Lingam, A. , Kudapa, H. , Thudi, M. , Chitikineni, A. et al (2016) Emerging genomic tools for legume breeding: current status and future perspectives. Front. Plant Sci. 7, 455. [DOI] [PMC free article] [PubMed] [Google Scholar]
- Pandey, M.K. , Khan, A.W. , Singh, V.K. , Vishwakarma, M.K. , Shasidhar, Y. , Kumar, V. , Garg, V. et al (2017a) QTL‐seq approach identified genomic regions and diagnostic markers for rust and late leaf spot resistance in groundnut (Arachis hypogaea L.). Plant Biotechnol. J. 15, 927–941. [DOI] [PMC free article] [PubMed] [Google Scholar]
- Pandey, M.K. , Agarwal, G. , Kale, S.M. , Clevenger, J. , Nayak, S.N. , Sriswathi, M. , Chitikineni, C. et al (2017b) Development and evaluation of a high density genotyping ‘Axiom_Arachis’ array with 58K SNPs for accelerating genetics and breeding in groundnut. Sci. Rep. 7, 40577. [DOI] [PMC free article] [PubMed] [Google Scholar]
- Pattanashetti, S.K. , Gowda, M.V.C. and Girija(2008) Inheritance of morphological traits and pod features in groundnut (Arachis hypogaea L.). Indian J. Genet. 68, 157–162. [Google Scholar]
- Raikwar, S. , Srivastava, V.K. , Gill, S.S. , Tuteja, R. and Tuteja, N. (2015) Emerging importance of helicases in plant stress tolerance: characterization of Oryza sativa repair helicase XPB2 promoter and its functional validation in tobacco under multiple stresses. Front. Plant. Sci. 6, 1094. [DOI] [PMC free article] [PubMed] [Google Scholar]
- Ravi, K. , Vadez, V. , Isobe, S. , Mir, R.R. , Guo, Y. , Nigam, S.N. , Gowda, M.V.C. et al (2011) Identification of several small main‐effect QTLs and a large number of epistatic QTLs for drought tolerance related traits in groundnut (Arachis hypogaea L.). Theor. Appl. Genet. 122, 1119–1132. [DOI] [PMC free article] [PubMed] [Google Scholar]
- Roorkiwal, M. , Jain, A. , Kale, S.M. , Doddamani, D. , Chitikineni, A. , Thudi, M. and Varshney, R.K. (2018) Development and evaluation of high‐density Axiom® CicerSNP Array for high‐resolution genetic mapping and breeding applications in chickpea. Plant Biotechnol. J. 16, 890–901. [DOI] [PMC free article] [PubMed] [Google Scholar]
- Saxena, R.K. , Rathore, A. , Bohra, A. , Yadav, P. , Das, R.R. , Khan, A.W. , Singh, V.K. et al (2018) Development and application of high‐density Axiom Cajanus SNP array with 56K SNPs to understand the genome architecture of released cultivars and founder genotypes. Plant. Genome, 11, 1–10. 10.3835/plantgenome2018.01.0005. [DOI] [PubMed] [Google Scholar]
- Song, Q. , Yan, L. , Quigley, C. , Jordan, B.D. , Fickus, E. , Schroeder, S. , Song, B.H. et al (2017) Genetic characterization of the soybean nested association mapping population. Plant Genome, 10, 1–14. [DOI] [PubMed] [Google Scholar]
- Strasser, R. , Stadlmann, J. , Svoboda, B. , Altmann, F. , Glössl, J. and Lukas, M.A.C.H. (2005) Molecular basis of N‐acetylglucosaminyltransferase I deficiency in Arabidopsis thaliana plants lacking complex N‐glycans. Biochemical J. 387, 385–391. [DOI] [PMC free article] [PubMed] [Google Scholar]
- Tallury, S.P. , Isleib, T.G. , Copeland, S.C. , Rosas‐Anderson, P. , Balota, M. , Singh, D. and Stalker, H.T. (2014) Registration of two multiple disease‐resistant peanut germplasm lines derived from Arachis cardenasii Krapov. & WC Gregory, GKP 10017. J. Plant Registrat. 8, 86–89. [Google Scholar]
- Tao, Y. , Wang, J. , Miao, J. , Chen, J. , Wu, S. , Zhu, J. , Zhang, D. et al (2018) The spermine synthase OsSPMS1 regulates seed germination, grain size, and yield. Plant Physiol. 178, 1522–1536. [DOI] [PMC free article] [PubMed] [Google Scholar]
- Thomson, M.J. , Singh, N. , Dwiyanti, M.S. , Wang, D.R. , Wright, M.H. , Perez, F.A. , DeClerck, G. et al (2017) Large‐scale deployment of a rice 6K SNP array for genetics and breeding applications. Rice, 10, 40. [DOI] [PMC free article] [PubMed] [Google Scholar]
- Tim, L. , Jing, L. , Gustavo, L. and De Lieven, V. (2009) Atypical E2Fs: new players in the E2F transcription factor family. Trends Cell Biol. 19, 111–118. [DOI] [PMC free article] [PubMed] [Google Scholar]
- Upadhyaya, H.D. , Gopal, K. , Nadaf, H.L. and Vijayakumar, S. (1992) Combining ability studies for yield and its components in groundnut. Indian J. Genet. 52, 1–6. [Google Scholar]
- Varshney, R.K. , Nayak, S.N. , May, G.D. and Jackson, S.A. (2009) Next generation sequencing technologies and their implications for crop genetics and breeding. Trends Biotechnol. 27, 522–530. [DOI] [PubMed] [Google Scholar]
- Varshney, R.K. , Mohan, S.M. , Gaur, P.M. , Gangarao, N.V.P.R. , Pandey, M.K. , Bohra, A. , Sawargaonkar, S.L. et al (2013) Achievements and prospects of genomics‐assisted breeding in three legume crops of the semi‐arid tropics. Biotechnol. Adv. 31, 120–1134. [DOI] [PubMed] [Google Scholar]
- Venuprasad, R. , Aruna, R. and Nigam, S.N. (2011) Inheritance of traits associated with seed size in groundnut (Arachis hypogaea L.). Euphytica, 181, 169–177. [Google Scholar]
- Voorrips, R.E. (2002) Mapchart: software for the graphical presentation of linkage maps and QTLs. J. Hered. 93, 77–78. [DOI] [PubMed] [Google Scholar]
- Wan, L. , Li, B. , Pandey, M.K. , Wu, Y. , Lei, Y. , Yan, L. , Dai, X. et al (2016) Transcriptome analysis of a new peanut seed coat mutant for the physiological regulatory mechanism involved in seed coat cracking and pigmentation. Front. Plant Sci. 7, 1491. [DOI] [PMC free article] [PubMed] [Google Scholar]
- Wang, S. , Wong, D. , Forrest, K. , Allen, A. , Chao, S. , Huang, B.E. , Maccaferri, M. et al (2014) Characterization of polyploid wheat genomic diversity using a high‐density 90 000 single nucleotide polymorphism array. Plant Biotechnol. J. 12, 787–796. [DOI] [PMC free article] [PubMed] [Google Scholar]
- Wang, H. , Guo, X. , Pandey, M.K. , Ji, X. , Varshney, R.K. , Nwosu, V. and Guo, B. (2017) History and impact of the International Peanut Genome Initiative: the exciting journey toward peanut whole‐genome sequencing In The Peanut Genome (Varshney R.K., Pandey M.K. and Puppala N., eds), pp. 117–134. New York, NY: Springer. [Google Scholar]
- Wei, J. and Xu, S. (2016) A random‐model approach to QTL mapping in multiparent advanced generation intercross (MAGIC) populations. Genetics, 202, 471–486. [DOI] [PMC free article] [PubMed] [Google Scholar]
- Wolfgang, L. , Todd, C.N. , David, W.M. , Robert, L.L. , Patricia, L.C. and Christopher, R.S. (2001) Arabidopsis cyt1 mutants are deficient in a mannose‐1‐phosphate guanylyl transferase and point to a requirement of N‐linked glycosylation for cellulose biosynthesis. Proc. Natl. Acad. Sci. USA, 98, 2262–2267. [DOI] [PMC free article] [PubMed] [Google Scholar]
- Wu, X. , Li, Y. , Shi, Y. , Song, Y. , Zhang, D. , Li, C. , Buckler, E.S. , et al (2016) Joint-linkage mapping and GWAS reveal extensive genetic loci that regulate male inflorescence size in maize. Plant Biotechnol. J. 14, 1551–1562. [DOI] [PMC free article] [PubMed] [Google Scholar]
- Xavier, A. , Xu, S. , Muir, W.M. and Rainey, K.M. (2015) NAM: association studies in multiple populations. Bioinformatics, 31, 3862–3864. [DOI] [PubMed] [Google Scholar]
- Xavier, A. , Jarquin, D. , Howard, R. , Ramasubramanian, V. , Specht, J.E. , Graef, G.L. , Beavis, W.D. et al (2018) Genome‐wide analysis of grain yield stability and environmental interactions in a multiparental soybean population. G3: Genes ‐ Genomes ‐ Genetics (Bethesda), 8, 519–529. [DOI] [PMC free article] [PubMed] [Google Scholar]
- Yadav, P. , Saxena, K.B. , Hingane, A. , Kumar, C.S. , Kandalkar, V.S. , Varshney, R.K. and Saxena, R.K. (2019) An “Axiom Cajanus SNP Array” based high density genetic map and QTL mapping for high‐selfing flower and seed quality traits in pigeonpea. BMC Genom. 20, 235. [DOI] [PMC free article] [PubMed] [Google Scholar]
- Yan, J. , Yang, X. , Shah, T. , Sánchez‐Villeda, H. , Li, J. , Warburton, M. , Zhou, Y. et al (2010) High‐throughput SNP genotyping with the GoldenGate assay in maize. Mol. Breeding 25, 441–451. [Google Scholar]
- Yoshihisa, K. , Lixiong, H. , Kazuyoshi, N. , Shuhei, M. , Izumi, I. and Shoji, T. (2004) Overexpression of spermidine synthase enhances tolerance to multiple environmental stresses and up‐regulates the expression of various stress‐ regulated genes in transgenic Arabidopsis thaliana . Plant Cell Physiol. 45, 712–722. [DOI] [PubMed] [Google Scholar]
- Yu, B. , Huai, D. , Huang, L. , Kang, Y. , Ren, X. , Chen, Y. , Zhou, X. , et al (2019) Identification of genomic regions and diagnostic markers for resistance to aflatoxin contamination in peanut (Arachis hypogaea L.). BMC Genet. 20, 32 10.1186/s12863-019-0734-z [DOI] [PMC free article] [PubMed] [Google Scholar]
- Yu, J. , Holland, J.B. , McMullen, M.D. and Buckler, E.S. (2008) Genetic design and statistical power of nested association mapping in maize. Genetics 178, 539–551. [DOI] [PMC free article] [PubMed] [Google Scholar]
- Zhuang, W. , Chen, H. , Yang, M. , Wang, J. , Pandey, M.K. , Zhang, C. , Chang, W.‐C. et al (2019) The Arachis hypogaea genome elucidates legume karyotypes, polyploid evolution and crop domestication. Nat. Genet. 51, 865–876. [DOI] [PMC free article] [PubMed] [Google Scholar]
Associated Data
This section collects any data citations, data availability statements, or supplementary materials included in this article.
Supplementary Materials
Figure S1 Frequency distribution plots representing the magnitude of phenotypic variation for pod weight (PW) and seed weight (SW) in NAM_Tifrunner and NAM_Florida‐07.
Figure S2 QQ plots against genotypic and phenotypic data represent the normal distribution for genotypic and phenotypic data.
Figure S3 Criteria used for filtering the SNPs on the basis of polymorphism and distortion for genetic mapping and genomewide association studies in NAM_Florida‐07 and NAM_Tifrunner population.
Figure S4 SNP density plots representing chromosomes wise distribution of SNPs used for genome‐wide association studies in (A) NAM_Tifrunner and (B) NAM_Florida‐07 populations.
Table S1 Phenotypic variability, heritability, skewness, kurtosis for pod weight (PW) and seed weight (SW) in NAM_Tirunner population.
Table S2 Phenotypic variability, heritability, skewness, kurtosis for pod weight (PW) and seed weight (SW) in NAM_Florida‐07 population.
Table S3 Summary of genetic map constructed using genotypic data generated using 58K SNP array on NAM_Tifrunner and NAM_Florida‐07 populations.
Table S4 Summary significantly associated SNPs identified for pod weight (PW) and seed weight (SW) in NAM_Tifrunner population with details of annotation of each gene corresponding to the SNPs and their biological role.
Table S5 Summary significantly associated SNPs identified for pod weight (PW) and seed weight (SW)in NAM_Florida‐07 population with details of annotation of each gene corresponding to the SNPs and their biological role.
Table S6 Details of SNPs on 58K ‘Axiom_Arachis’ SNP array used for genotyping NAM populations.