

Abstract
The rapid development and application of molecular marker assays have facilitated genomic selection and genome‐wide linkage and association studies in wheat breeding. Although PCR‐based markers (e.g. simple sequence repeats and functional markers) and genotyping by sequencing have contributed greatly to gene discovery and marker‐assisted selection, the release of a more accurate and complete bread wheat reference genome has resulted in the design of single‐nucleotide polymorphism (SNP) arrays based on different densities or application targets. Here, we evaluated seven types of wheat SNP arrays in terms of their SNP number, distribution, density, associated genes, heterozygosity and application. The results suggested that the Wheat 660K SNP array contained the highest percentage (99.05%) of genome‐specific SNPs with reliable physical positions. SNP density analysis indicated that the SNPs were almost evenly distributed across the whole genome. In addition, 229 266 SNPs in the Wheat 660K SNP array were located in 66 834 annotated gene or promoter intervals. The annotated genes revealed by the Wheat 660K SNP array almost covered all genes revealed by the Wheat 35K (97.44%), 55K (99.73%), 90K (86.9%) and 820K (85.3%) SNP arrays. Therefore, the Wheat 660K SNP array could act as a substitute for other 6 arrays and shows promise for a wide range of possible applications. In summary, the Wheat 660K SNP array is reliable and cost‐effective and may be the best choice for targeted genotyping and marker‐assisted selection in wheat genetic improvement.
Keywords: wheat, marker‐assisted breeding, single‐nucleotide polymorphisms, Axiom® Wheat 660K SNP array, Illumina Wheat 90K iSelect SNP genotyping array
Introduction
Wheat is one of the most important crops worldwide, providing ~21% food energy and 20% protein for humans due to its high nutritive value. It is also the staple food of 35%–40% of the human population. Its unique gluten, baking and pasting properties contribute to its application in the production of a variety of flavoured foods (Ragaee and Abdel‐Aal, 2006). Furthermore, it is an important international trade and aid food. Therefore, the genetic dissection and improvement of wheat production and quality are of vital significance for ensuring global food security.
Over the last few decades, desired traits in wheat have typically been obtained by hybridization in traditional crop improvement programs without knowing the inheritable molecular mechanism. This process gradually integrates superior genetic variation to protect wheat from various diseases or stresses and increases or improves wheat yield and quality (Rasheed et al., 2018; Tabbita et al., 2017). The genetic basis of high yield in modern cultivars has been revealed to be due to the pyramiding of the superior alleles of major genes, such as the vernalization response gene (Chen et al., 2013), photoperiod response gene (Würschum et al., 2018) and kernel size genes (Hanif et al., 2015; Hou et al., 2014; Ma et al., 2016; Wang et al., 2015, 2016), which have been positively selected in traditional breeding programs. However, there is little scope for the further integration of major genes by traditional breeding. Therefore, wheat functional and comparative genomics and marker‐assisted selection (MAS) provide solutions to the bottlenecks faced by traditional breeding methods (Li et al., 2018; Uauy, 2017).
Development of marker‐assisted selection
As a complementary tool to traditional breeding, MAS at the wheat whole‐genome level has accelerated the breeding process in wheat. It allows the early‐generation selection of target traits, particularly when traits are under complex genetic control or are not easily investigated. The ability to fully assess the genetic diversity of selected germplasms positively contributes to wheat breeding. Genotyping platforms and MAS could accelerate wheat breeding through marker design and gene pyramiding, as shown in Figure 1.
Figure 1.
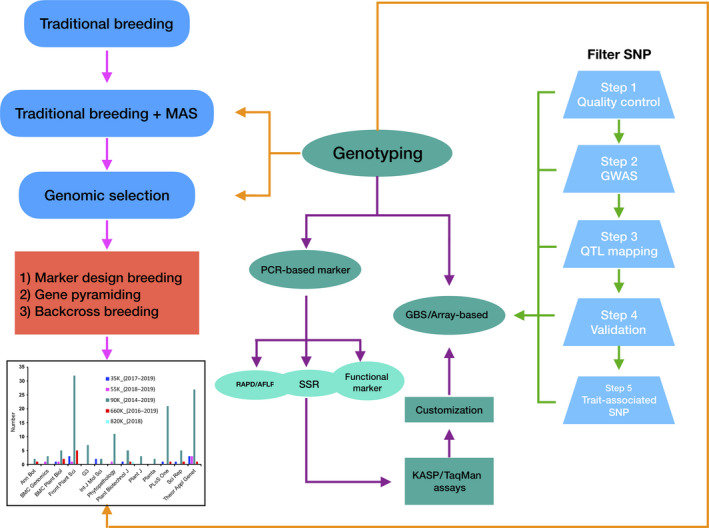
Available genotyping platforms and their application in marker‐assisted selection.
PCR‐based molecular markers
In wheat breeding programs, PCR‐based molecular markers, including randomly amplified polymorphic DNA (RAPD), amplified fragment length polymorphism (AFLP), simple sequence repeat (SSR) (Somers et al., 2004), and functional diagnostic markers based on gene sequences (Liu et al., 2012; Rasheed and Xia, 2019), have been widely applied and significantly contributed to wheat molecular breeding and genomics strategies, but they have limited potential in practical plant breeding (Xu and Crouch, 2008) due to their low throughput and density. For example, SSR motifs are finite in a genome and are not evenly distributed. It is challenging to precisely identify information from multiple alleles per locus for AFLP, and SSR. Moreover, integrating or comparing marker information between different platforms or populations is difficult. PCR‐based marker analysis is also expensive due to the laborious and time‐consuming genotyping process. Additionally, many wheat traits are typically influenced by multiple genes, resulting in the poor detection of minor genes by functional markers. Therefore, it is of vital importance to establish simple, accurate, whole‐genome high‐throughput genotyping platforms for marker‐assisted breeding.
Genotyping by sequencing
Next‐generation sequencing (NGS) technologies provide sequencing information with greatly improved coverage, time and cost (Bevan and Uauy, 2013) and are able to detect various crops regardless of prior genomic backgrounds. To date, more than 15 different GBS techniques have been used in crop plants (Scheben et al., 2016). The main processes of these techniques include restriction‐enzyme digestion, adapter ligation, PCR amplification and sequencing. In wheat breeding, GBS has been used for genomic selection in wheat breeding program of different countries or regions for various traits (Jordan et al., 2015; Juliana et al., 2019; Vikram et al., 2016; Zhang et al., 2015).
However, GBS is easily involved in errors caused by the low reads coverage and the poor ability to detect true homozygotes, especially in outcrossing species or in mapping populations at early generations (Rasheed et al., 2017). GBS is also labour‐intensive in library preparation and is complex in data analysis and storage (Scheben et al., 2016). Moreover, GBS performance heavily relies on the quality of the reference genome. The large genome size (16Gb) of hexaploid wheat, containing more than 85% duplicated sequences (Appels et al., 2018) and potential gaps (14.1 Gb correctly assigned and ordered), also increases the incidence of genotyping errors, as the paralogs may be recognized as the same reads (Rasheed and Xia, 2019). Furthermore, Chinese Spring used for reference genome is a landrace with great genomic variation compared to modern cultivars, resulting in a low coverage of markers revealed by GBS, thus limiting the application of GBS in current wheat cultivars.
Array‐based genotyping
Single‐nucleotide polymorphism arrays are flexible in terms of sample and data point number customization, which contributes to its high‐density scanning and high and robust call rates compared to NGS and PCR‐based markers. To date, a series of high‐density SNP genotyping arrays have been designed and utilized for marker‐assisted breeding in common wheat, for example, the Illumina Wheat 9K iSelect SNP array (Cavanagh et al., 2013), the Illumina Wheat 90K iSelect SNP genotyping array (Wang et al., 2014), the Wheat 15K SNP array (Boeven et al., 2016), the Axiom® Wheat 660K SNP array, the Wheat 55K SNP array, the Axiom® HD Wheat genotyping (820K) array (Winfield et al., 2016), the Wheat Breeders’ 35K Axiom array (Allen et al., 2017) and the Wheat 50K Triticum TraitBreed array (Rasheed and Xia, 2019). Detailed information of different arrays is listed in Table S1. Among them, SNPs in the Wheat 9K and 90K arrays are ineffective in detecting polymorphisms in landraces, synthetic wheat and germplasms derived from the secondary and tertiary gene pools (Rasheed and Xia, 2019). To overcome this limitation, Winfield et al. (2016) developed a Wheat 820K array by exome capture of 43 wheat and wild species accessions. It was designed for a variety of global lines, including elite cultivars, landraces, synthetic hexaploids and wheat relatives. However, the majority of the markers on the Wheat 820K SNP array were based on wheat and its relatives (Allen et al., 2017), resulting in limited value to breeders who are specifically interested in hexaploid germplasms. The Wheat Breeders’ 35K Axiom array, derived from the Wheat 820K SNP array, is a low‐throughput array that provides breeder‐oriented informative markers (Allen et al., 2017). The Wheat 660K SNP array was designed by the Chinese Academy of Agricultural Sciences and is based on hexaploid and tetraploid wheat, emmer wheat and Aegilops tauschii, and has the advantages of being genome‐specific, high‐density, efficient, cost‐effective and with a wide range of possible applications, and has also added numerous markers to the D genome (http://wheat.pw.usda.gov/ggpages/topics/Wheat660_SNP_array_developed_by_CAAS.pdf). The Wheat 660K SNP array has been widely used to identify genetic loci for quality traits, agronomic traits and disease resistance in common wheat (Cui et al., 2017; Jin et al., 2016; Yang et al., 2019).
High‐throughput, high‐density, high‐commercialization, low‐cost, flexible, and easily manipulatable SNP discovery platforms are urgently required for marker‐assisted breeding. Compared with GBS and PCR‐based markers, array‐based genotyping platforms are high‐commercialized and flexible to customize in the number of samples and probe sites. Without the drawback of genotyping error caused by low coverage of NGS reads and polyploidy, SNP calling rates of array‐based platforms are high and robust, but it also has the ascertainment bias in SNP detection of crop wild relatives and landraces. This issue can be improved by array customization of samples with broad genetic backgrounds. Moreover, array‐based genotyping platforms are cost‐effective per data point when genotyping large numbers of SNPs and samples (Rasheed et al., 2017); however, the overall cost of genotyping one sample is not advantageous when compared with genotyping by GBS and PCR‐based markers. Besides, array‐based genotyping platforms are easier in manipulation and downstream data analysis, including the full utilization of the technology without enormous capital investments in equipment, technology maintenance and training, which is attractive to non‐professional technicians (Rossetto and Henry, 2014).
Therefore, SNP arrays have been widely used by many breeders in a variety of academic research, including genome‐wide association (Guo et al., 2017; Kidane et al., 2019), linkage map construction and QTL mapping (Cui et al., 2017; Jin et al., 2016), population structure, and phylogenetic analysis (Kidane et al., 2019; Valluru et al., 2017). In the present study, we selected seven widely used high‐throughput wheat arrays (Wheat 9K, 15K, 35K, 55K, 90K, 820K and 660K arrays) and compared their performance in terms of SNP number, distribution, density and associated genes to assess their value and provide guidance for their better application in marker‐assisted breeding at the wheat genome level.
Comparison of the seven popular wheat arrays
Updating physical positions of the arrays
The Wheat 9K and 15K SNP arrays, Wheat 35K SNP array and Wheat 55K SNP array are derived from the Wheat 90K SNP array, Wheat 820K SNP array and Wheat 660K SNP array, respectively. We thus updated the physical positions of the three high‐density SNP arrays, that is the Wheat 90K, 820K and 660K SNP arrays. Restricted by the sequencing and assembly technologies at that time, the physical positions of the SNPs in the Wheat 90K SNP genotyping array are inaccurate, and the unspecific probe sites in the Wheat 820K and 660K SNP arrays are not comparable with each other.
Therefore, considering the homologous sub‐genomes of hexaploid wheat, we aligned the flanking sequences of each SNP to A, B and D genomes simultaneously based on independent databases for the seven homologous chromosomes that we developed in the Chinese Spring reference genome (V1.0). In comparison with the Chinese Spring reference genome (V0.4), this was improved using whole‐genome optical maps and contigs assembled from whole‐genome‐shotgun (WGS) PacBio SMRT reads (Zimin et al., 2017). The best SNP hits were determined based on the e‐value (<1e‐20), alignment length, mismatches, identity and bit score of the program. For each query sequence, hits with the minimum e‐values that passed the cut‐off were first selected. Alignment lengths less than half of the query lengths were then discarded. One allele mismatch was allowed as the single‐nucleotide variation in the flanking sequence for each SNP.
SNPs with unique physical positions
Among the alignment results of the Wheat 90K SNP genotyping array, more than one best hit was identified as the homologous A, B and D sub‐genomes and the unspecific flanking sequences of the probes. Furthermore, we extracted the SNPs with the best unique hits, and these SNPs were located in certain chromosomes with reliable physical positions. A total of 77 126 (94.72%) SNPs in the Wheat 90K SNP genotyping array showed reliable physical positions in the Chinese Spring reference genome V1.0.
The Triticeae Multi‐omics Center (http://202.194.139.32) provides genome, transcriptome, proteome and epigenome dataset resources for common wheat and relatives as well as useful tools such as the Basic Local Alignment Search Tool (BLAST), sequence extraction and the design of molecular markers and primers. It also aligned the flanking sequences of the Wheat 820K SNP array to the Chinese Spring reference genome V1.0. Based on the alignment results in the Triticeae Multi‐omics Center, unique probes with reliable physical positions in the 820K SNP array were extracted. Only 644 557 (79.36%) SNPs showed unique reliable physical positions. The physical positions of the Wheat 660K SNP array were kindly provided by Professor Jizeng Jia (Chinese Academy of Agricultural Sciences, Beijing, China). There were 617 971 (99.05%) SNPs with reliable physical positions in the Wheat 660K SNP array (Table S2).
All the SNPs with unique reliable physical positions were used for further analysis. The SNP number distributions on each chromosome of the relative arrays are shown in Figure 2. In the Wheat 660K SNP array, the largest number of SNPs was located on chromosome 3B, while in the Wheat 35K, 90K and 820K SNP arrays, the largest numbers of SNPs were located on chromosome 2D. The SNPs in the Wheat 55K SNP array were almost evenly distributed across all the chromosomes.
Figure 2.

Chromosomal distribution of the SNPs with unique reliable physical positions in the five arrays.
SNP density distribution
Single‐nucleotide polymorphism number was calculated along a window size of 1 Mb in each chromosome (Figure 3). Almost all bins contained SNPs in the Wheat 660K SNP array, while the other four arrays detected many bins with none of the SNPs (grey colour), particularly the Wheat 35K, 55K and 90K SNP arrays. Compared with the Wheat 820K SNP array, more SNPs were identified at the top or end of the chromosomes in the Wheat 660K SNP array, as more recombination events occurred in these regions and less recombination occurred in the centromeric regions. The SNP frequency distributions are also listed in Figure S1.
Figure 3.
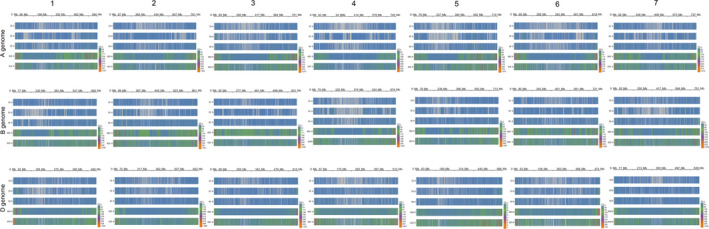
Heatmap display of SNP numbers along a window size of 1 Mb in each chromosome in the Wheat 35K, 55K, 90K, 660K and 820K arrays.
SNPs located in annotated genes
Based on the SNP physical positions and annotated gene locations, the SNPs in the annotated genes or promoter regions (2 Kb before the gene) were extracted. High‐confidence annotated genes in IWGSC RefSeq v1.1 (https://urgi.versailles.inra.fr/download/) were used for gene‐SNP (the SNPs in annotated genes or promoter regions) analysis. As shown in Table 1, there were 26 236, 13 191, 64 643, 229 266 and 538 079 SNPs located in annotated genes in the Wheat 35K, 55K, 90K, 660K and 820K SNP arrays, respectively. Detailed chromosomal distributions of the gene‐SNPs and the corresponding annotated gene information are provided in Tables [Link], [Link], [Link], [Link], [Link]. The Wheat 820K SNP array detected the highest number of gene‐SNPs (538 079); however, these gene‐SNPs were only located in 47 835 (45.47%) different annotated genes (unique SNP‐gene). Furthermore, the Wheat 660K SNP array contained 229 266 gene‐SNP hits in 66 834 (63.52%) different annotated genes, indicating that the Wheat 660K SNP array integrated a greater abundance of annotated genes by designing smaller numbers of unique probe sites as compared with the Wheat 820K SNP array. Additionally, the Wheat 90K SNP array also exhibited good performance, since the 64 643 gene‐SNPs were associated with 30 328 (28.83%) annotated genes.
Table 1.
Number and percentage of SNPs located in gene intervals and associated genes in the five arrays
| Chr | SNP_Number (%) | Gene_Number (%) | ||||||||
|---|---|---|---|---|---|---|---|---|---|---|
| 35K | 55K | 90K | 660K | 820K | 35K | 55K | 90K | 660K | 820K | |
| chr1A | 1187 (3.51%) | 600 (1.13%) | 2979 (3.86%) | 12 686 (2.05%) | 22 550 (3.5%) | 1005 (0.96%) | 576 (0.55%) | 1324 (1.26%) | 3108 (2.95%) | 2018 (1.92%) |
| chr1B | 1590 (4.7%) | 599 (1.13%) | 2888 (3.74%) | 11 422 (1.85%) | 23 789 (3.69%) | 1249 (1.19%) | 582 (0.55%) | 1379 (1.31%) | 2949 (2.8%) | 2110 (2.01%) |
| chr1D | 1693 (5.01%) | 1040 (1.96%) | 3081 (3.99%) | 9999 (1.62%) | 26 877 (4.17%) | 1299 (1.23%) | 849 (0.81%) | 1507 (1.43%) | 2759 (2.62%) | 2175 (2.07%) |
| chr2A | 1336 (3.95%) | 359 (0.68%) | 3442 (4.46%) | 13 639 (2.21%) | 28 652 (4.45%) | 1157 (1.1%) | 369 (0.35%) | 1604 (1.52%) | 3933 (3.74%) | 2586 (2.46%) |
| chr2B | 1667 (4.93%) | 687 (1.3%) | 5179 (6.71%) | 16 441 (2.66%) | 30 328 (4.71%) | 1367 (1.3%) | 675 (0.64%) | 1981 (1.88%) | 4124 (3.92%) | 2665 (2.53%) |
| chr2D | 1903 (5.63%) | 1064 (2.01%) | 4042 (5.24%) | 12 069 (1.95%) | 33 384 (5.18%) | 1472 (1.4%) | 919 (0.87%) | 1844 (1.75%) | 3629 (3.45%) | 2807 (2.67%) |
| chr3A | 1161 (3.43%) | 550 (1.04%) | 2784 (3.61%) | 9367 (1.52%) | 24 781 (3.85%) | 968 (0.92%) | 527 (0.5%) | 1400 (1.33%) | 3082 (2.93%) | 2369 (2.25%) |
| chr3B | 1304 (3.86%) | 411 (0.78%) | 3408 (4.42%) | 16 300 (2.64%) | 27 256 (4.23%) | 1150 (1.09%) | 415 (0.39%) | 1551 (1.47%) | 4080 (3.88%) | 2481 (2.36%) |
| chr3D | 1510 (4.47%) | 808 (1.52%) | 2772 (3.59%) | 8552 (1.38%) | 29 529 (4.58%) | 1196 (1.14%) | 682 (0.65%) | 1482 (1.41%) | 2978 (2.83%) | 2587 (2.46%) |
| chr4A | 831 (2.46%) | 361 (0.68%) | 2476 (3.21%) | 10 383 (1.68%) | 23 685 (3.68%) | 804 (0.76%) | 360 (0.34%) | 1195 (1.14%) | 3131 (2.98%) | 2173 (2.07%) |
| chr4B | 810 (2.4%) | 609 (1.15%) | 2224 (2.88%) | 7052 (1.14%) | 21 498 (3.34%) | 737 (0.7%) | 558 (0.53%) | 1093 (1.04%) | 2379 (2.26%) | 1926 (1.83%) |
| chr4D | 689 (2.04%) | 465 (0.88%) | 2072 (2.69%) | 6041 (0.98%) | 21 894 (3.4%) | 665 (0.63%) | 414 (0.39%) | 1149 (1.09%) | 2284 (2.17%) | 1937 (1.84%) |
| chr5A | 1217 (3.6%) | 540 (1.02%) | 2943 (3.82%) | 10 228 (1.66%) | 26 711 (4.15%) | 1042 (0.99%) | 530 (0.5%) | 1452 (1.38%) | 3295 (3.13%) | 2465 (2.34%) |
| chr5B | 1315 (3.89%) | 429 (0.81%) | 3838 (4.98%) | 15 247 (2.47%) | 27 761 (4.31%) | 1217 (1.16%) | 445 (0.42%) | 1673 (1.59%) | 3823 (3.63%) | 2568 (2.44%) |
| chr5D | 1312 (3.88%) | 1020 (1.92%) | 3309 (4.29%) | 10672 (1.73%) | 31 207 (4.84%) | 1202 (1.14%) | 850 (0.81%) | 1733 (1.65%) | 3597 (3.42%) | 2676 (2.54%) |
| chr6A | 885 (2.62%) | 645 (1.22%) | 2857 (3.7%) | 8942 (1.45%) | 19 794 (3.07%) | 769 (0.73%) | 594 (0.56%) | 1193 (1.13%) | 2601 (2.47%) | 1809 (1.72%) |
| chr6B | 1161 (3.43%) | 416 (0.78%) | 2835 (3.68%) | 10 392 (1.68%) | 21 273 (3.3%) | 965 (0.92%) | 422 (0.4%) | 1237 (1.18%) | 2878 (2.74%) | 1921 (1.83%) |
| chr6D | 984 (2.91%) | 802 (1.51%) | 2563 (3.32%) | 8000 (1.29%) | 21 922 (3.4%) | 885 (0.84%) | 683 (0.65%) | 1256 (1.19%) | 2606 (2.48%) | 1897 (1.8%) |
| chr7A | 1238 (3.66%) | 468 (0.88%) | 3159 (4.1%) | 11 780 (1.91%) | 23 691 (3.68%) | 1024 (0.97%) | 463 (0.44%) | 1435 (1.36%) | 3473 (3.3%) | 2199 (2.09%) |
| chr7B | 1143 (3.38%) | 580 (1.09%) | 2699 (3.5%) | 9248 (1.5%) | 22 802 (3.54%) | 953 (0.91%) | 544 (0.52%) | 1249 (1.19%) | 2737 (2.6%) | 2046 (1.94%) |
| chr7D | 1300 (3.85%) | 738 (1.39%) | 3093 (4.01%) | 10 806 (1.75%) | 28 695 (4.45%) | 1160 (1.1%) | 670 (0.64%) | 1591 (1.51%) | 3388 (3.22%) | 2420 (2.3%) |
| Total | 26 236 (77.61%) | 13 191 (24.89%) | 64 643 (83.81%) | 229 266 (37.1%) | 538 079 (83.51%) | 22 286 (21.18%) | 12 127 (11.53%) | 30 328 (28.83%) | 66 834 (63.52%) | 47 835 (45.47%) |
To analyse the annotated genes revealed by the different arrays, we produced annotated gene intersections of the pairwise arrays. The results (Figure 4) indicated that the 66 834 unique SNP‐genes in the Wheat 660K SNP array contained 21 715 (97.44%), 12 094 (99.73%), 26 356 (86.9%) and 40 803 (85.3%) annotated genes as revealed by the Wheat 35K, 55K, 90K and 820K SNP arrays, respectively. However, the 47 835 unique SNP‐genes in the Wheat 820K SNP array contained 21 397 (96.01%), 7408 (61.09%) and 24 095 (79.45%) annotated genes as revealed by the Wheat 35K, 55K and 90K SNP arrays, respectively. The 30 328 unique SNP‐genes in the Wheat 90K SNP array contained 13 307 (59.71%) and 5566 (45.9%) annotated genes as revealed by the Wheat 35K and 55K SNP arrays, respectively. These results indicated that the unique SNP‐genes in the Wheat 660K SNP array almost contained all the annotated genes revealed by other 6 arrays surveyed in this study, except for a small portion of array‐specific genes. Therefore, the Wheat 660K SNP array is able to act as a substitution for the other four Wheat SNP arrays given the annotated genes across the entire wheat genome.
Figure 4.

Numbers of overlapping SNP‐associated annotated genes derived from the five arrays.
Heterozygosity of the arrays
Three panels composed of Chinese common wheat have been genotyped by different wheat SNP arrays in our previous studies (Chen et al., 2019; Sun et al., 2017; Yang et al., 2019). Panel_I, containing 163 Chinese cultivars, was characterized by the Wheat 90K SNP array (Sun et al., 2017), and analysis indicated that the heterozygosity of cultivars characterized by the Wheat 90K SNP array in Panel_I was 28.67%. Panel_II and Panel_III, respectively, containing 243 Chinese wheat accessions (Yang et al., 2019) and 435 high‐generation introgression lines of the cultivar Yanzhan1, were genotyped by the Wheat 660K SNP array. Analysis indicated that the averaged heterozygosity of the two panels characterized by Wheat 660K SNP array was 5.5% (2.86% for Panel_II and 8.14% for Panel_III). Winfield et al. (2016) genotyped 475 wheat accessions using the Wheat 820K SNP array, and the heterozygosity of accessions surveyed was determined to be 4.7%. The results indicated that wheat cultivars characterized by the Wheat 660K and 820K SNP arrays possessed relatively low heterozygosity.
Applications of the arrays
The five arrays have been widely used to detect trait‐related genetic loci by QTL mapping and GWAS in wheat molecular breeding program. Choosing ‘wheat’ and ‘SNP’ as the keywords, we screened and summarized published papers in the PubMed database of the National Center for Biotechnology Information (https://www.ncbi.nlm.nih.gov) to determine the applications of these arrays. A total of 171 related research articles published since 2014 were detected, which employed the above wheat arrays. These studies were mainly published in Theoretical Applied Genetics, PLoS One, Frontiers in Plant Science, Phytopathology, Plant Biotechnology Journal, Scientific Report and BMC Plant Biology. Of all the papers related to wheat arrays (Figure 1), 80% employed the Wheat 90K array, indicating that the Wheat 90K array was the most widely used in the identification of trait‐related genetic loci over past five years. After the Wheat 660K array was formally utilized in 2017 (Cui et al., 2017), 12 papers employing the 660K array were published in the following two years. Based on SNP density, heterozygosity and distribution on chromosomes, the Wheat 660K array has great potential application in MAS and may be the best choice for the identification of trait‐related genetic loci and MAS in wheat breeding programs.
Conclusion
Crop improvement has been transformed from traditional breeding to molecular marker‐assisted and genomic selection over the past decade. Although PCR‐based molecular markers have been broadly applied in recent years, their drawbacks have narrowed their further application in wheat breeding. Array‐based genotyping platforms are advantageous, in that they are flexible, easily manipulated, cost‐effective, and approachable by breeders, making them popular in wheat breeding programs. We thus compared the performances of the existing SNP genotyping arrays used in the wheat breeding fraternity in terms of their SNP number distribution, density, associated genes and heterozygosity. The results indicated that the Wheat 660K SNP array demonstrates great potential and might be the best choice for targeted genotyping and MAS in wheat genetic improvement.
Conflict of interest
The authors declare that they have no conflict of interest.
Author contributions
F.C. designed the project. C.S., Z.D., L.Z., Y.R. and N.Z. performed bioinformatics of different wheat chips. C.S. and F.C. wrote the manuscript.
Supporting information
Figure S1 SNP frequency distribution of the five arrays. a–e: Wheat 35K SNP array, Wheat 55K SNP array, Wheat 90K SNP array, Wheat 660K SNP array, and Wheat 820K, respectively.
Table S1 Comparison of different wheat SNP arrays on size, cost, provider, technology, reference and weblink.
Table S2 SNPs with reliable physical positions in the Wheat 660K SNP array.
Table S3 SNPs and corresponding annotated genes in Wheat 35K arrays. The header line indicates the SNP name, chromosome, physical position, SNP located in gene region or 2kb before ATG of this gene, gene name, start and end positions of genes, and array name. The same below.
Table S4 SNPs and corresponding annotated genes in Wheat 55K arrays.
Table S5 SNPs and corresponding annotated genes in Wheat 90K arrays.
Table S6 SNPs and corresponding annotated genes in Wheat 660K arrays.
Table S7 SNPs and corresponding annotated genes in Wheat 820K arrays.
Acknowledgements
This project was funded by the National Key Research and Development Program (2016YFD0101802) and the National Natural Science Foundation (U1804234 and 3181101544) of China.
Sun, C. , Dong, Z. , Zhao, L. , Ren, Y. , Zhang, N. and Chen, F. (2020) The Wheat 660K SNP array demonstrates great potential for marker‐assisted selection in polyploid wheat. Plant Biotechnol. J., 10.1111/pbi.13361
References
- Allen, A.M. , Winfield, M.O. , Burridge, A.J. , Downie, R.C. , Benbow, H.R. , Barker, G.L. , Wilkinson, P.A. et al. (2017) Characterization of a Wheat Breeders’ Array suitable for high‐throughput SNP genotyping of global accessions of hexaploid bread wheat (Triticum aestivum). Plant Biotechnol. J. 15, 390–401. [DOI] [PMC free article] [PubMed] [Google Scholar]
- Appels, R. , Eversole, K. , Feuillet, C. , Keller, B. , Rogers, J. , Stein, N. , Choulet, F. et al. (2018) Shifting the limits in wheat research and breeding using a fully annotated reference genome. Science, 361, eaar7191. [DOI] [PubMed] [Google Scholar]
- Bevan, M.W. and Uauy, C. (2013) Genomics reveals new landscapes for crop improvement. Genome Biol. 14, 206. [DOI] [PMC free article] [PubMed] [Google Scholar]
- Boeven, P.H. , Longin, C.F.H. , Leiser, W.L. , Kollers, S. , Ebmeyer, E. and Würschum, T. (2016) Genetic architecture of male floral traits required for hybrid wheat breeding. Theor. Appl. Genet. 129, 2343–2357. [DOI] [PubMed] [Google Scholar]
- Cavanagh, C.R. , Chao, S. , Wang, S. , Huang, B.E. , Stephen, S. , Kiani, S. , Forrest, K. et al. (2013) Genome‐wide comparative diversity uncovers multiple targets of selection for improvement in hexaploid wheat landraces and cultivars. Proc. Natl Acad. Sci. USA, 110, 8057–8062. [DOI] [PMC free article] [PubMed] [Google Scholar]
- Chen, F. , Gao, M. , Zhang, J. , Zuo, A. , Shang, X. and Cui, D. (2013) Molecular characterization of vernalization and response genes in bread wheat from the Yellow and Huai Valley of China. BMC Plant Biol. 13, 199. [DOI] [PMC free article] [PubMed] [Google Scholar]
- Chen, J. , Zhang, F. , Zhao, C. , Lv, G. , Sun, C. , Pan, Y. , Guo, X. et al. (2019) Genome‐wide association study of six quality traits reveals the association of the TaRPP13L1 gene with flour colour in Chinese bread wheat. Plant Biotechnol. J. 17, 2106–2122. [DOI] [PMC free article] [PubMed] [Google Scholar]
- Cui, F. , Zhang, N. , Fan, X.L. , Zhang, W. , Zhao, C.H. , Yang, L.J. , Pan, R.Q. et al. (2017) Utilization of a Wheat 660K SNP array‐derived high‐density genetic map for high‐resolution mapping of a major QTL for kernel number. Sci. Rep. 7, 3788. [DOI] [PMC free article] [PubMed] [Google Scholar]
- Guo, Z. , Chen, D. , Alqudah, A.M. , Röder, M.S. , Ganal, M.W. and Schnurbusch, T. (2017) Genome‐wide association analyses of 54 traits identified multiple loci for the determination of floret fertility in wheat. New Phytol. 214, 257–270. [DOI] [PubMed] [Google Scholar]
- Hanif, M. , Gao, F. , Liu, J. , Wen, W. , Zhang, Y. , Rasheed, A. , Xia, X. et al. (2015) TaTGW6‐A1, an ortholog of rice TGW6, is associated with grain weight and yield in bread wheat. Mol. Breed. 36, 1. [Google Scholar]
- Hou, J. , Jiang, Q. , Hao, C. , Wang, Y. , Zhang, H. and Zhang, X. (2014) Global selection on sucrose synthase haplotypes during a century of wheat breeding. Plant Physiol. 164, 1918–1929. [DOI] [PMC free article] [PubMed] [Google Scholar]
- Jin, H. , Wen, W. , Liu, J. , Zhai, S. , Zhang, Y. , Yan, J. , Liu, Z. et al. (2016) Genome‐wide QTL mapping for wheat processing quality parameters in a Gaocheng 8901/Zhoumai 16 recombinant inbred line population. Front. Plant Sci. 7, 1032. [DOI] [PMC free article] [PubMed] [Google Scholar]
- Jordan, K.W. , Wang, S. , Lun, Y. , Gardiner, L.J. , MacLachlan, R. , Hucl, P. , Wiebe, K. et al. (2015) A haplotype map of allohexaploid wheat reveals distinct patterns of selection on homoeologous genomes. Genome Biol. 16, 48. [DOI] [PMC free article] [PubMed] [Google Scholar]
- Juliana, P. , Poland, J. , Huerta‐Espino, J. , Shrestha, S. , Crossa, J. , Crespo‐Herrera, L. , Toledo, F.H. et al. (2019) Improving grain yield, stress resilience and quality of bread wheat using large‐scale genomics. Nat. Genet. 51, 1530–1539. [DOI] [PubMed] [Google Scholar]
- Kidane, Y.G. , Gesesse, C.A. , Hailemariam, B.N. , Desta, E.A. , Mengistu, D.K. , Fadda, C. , Pè, M.E. et al. (2019) A large nested association mapping population for breeding and quantitative trait locus mapping in Ethiopian durum wheat. Plant Biotechnol. J. 17, 1380–1393. [DOI] [PMC free article] [PubMed] [Google Scholar]
- Li, H. , Rasheed, A. , Hickey, L.T. and He, Z. (2018) Fast‐forwarding genetic gain. Trends Plant Sci. 23, 184–186. [DOI] [PubMed] [Google Scholar]
- Liu, Y. , He, Z. , Appels, R. and Xia, X. (2012) Functional markers in wheat: current status and future prospects. Theor. Appl. Genet. 125, 1–10. [DOI] [PubMed] [Google Scholar]
- Ma, L. , Li, T. , Hao, C. , Wang, Y. , Chen, X. and Zhang, X. (2016) TaGS5‐3A, a grain size gene selected during wheat improvement for larger kernel and yield. Plant Biotechnol. J. 14, 1269–1280. [DOI] [PMC free article] [PubMed] [Google Scholar]
- Ragaee, S. and Abdel‐Aal, E.S.M. (2006) Pasting properties of starch and protein in selected cereals and quality of their food products. Food Chem. 95, 9–18. [Google Scholar]
- Rasheed, A. and Xia, X. (2019) From markers to genome‐based breeding in wheat. Theor. Appl. Genet. 132, 767–784. [DOI] [PubMed] [Google Scholar]
- Rasheed, A. , Hao, Y. , Xia, X. , Khan, A. , Xu, Y. , Varshney, R.K. and He, Z. (2017) Crop breeding chips and genotyping platforms: progress, challenges, and perspectives. Mol. Plant. 10, 1047–1064. [DOI] [PubMed] [Google Scholar]
- Rasheed, A. , Mujeeb‐Kazi, A. , Ogbonnaya, F.C. , He, Z. and Rajaram, S. (2018) Wheat genetic resources in the post‐genomics era: promise and challenges. Ann. Bot. 121, 603–616. [DOI] [PMC free article] [PubMed] [Google Scholar]
- Rossetto, M. and Henry, R.J. (2014) Escape from the laboratory: new horizons for plant genetics. Trends Plant Sci. 19, 554–555. [DOI] [PubMed] [Google Scholar]
- Scheben, A. , Batley, J. and Edwards, D. (2016) Genotyping‐by‐sequencing approaches to characterize crop genomes: choosing the right tool for the right application. Plant Biotechnol. J. 15, 149–161. [DOI] [PMC free article] [PubMed] [Google Scholar]
- Somers, D.J. , Isaac, P. and Edwards, K. (2004) A high‐density microsatellite consensus map for bread wheat (Triticum aestivum L.). Theor. Appl. Genet. 109, 1105–1114. [DOI] [PubMed] [Google Scholar]
- Sun, C. , Zhang, F. , Yan, X. , Zhang, X. , Dong, Z. , Cui, D. and Chen, F. .(2017) Genome‐wide association study for 13 agronomic traits reveals distribution of superior alleles in bread wheat from the Yellow and Huai Valley of China. Plant Biotechnol. J. 15, 953–969. [DOI] [PMC free article] [PubMed] [Google Scholar]
- Tabbita, F. , Pearce, S. and Barneix, A.J. (2017) Breeding for increased grain protein and micronutrient content in wheat: ten years of the GPC‐B1 gene. J. Cereal Sci. 73, 183–191. [Google Scholar]
- Uauy, C. .(2017) Wheat genomics comes of age. Curr. Opin. Plant Bio. 36, 142–148. [DOI] [PubMed] [Google Scholar]
- Valluru, R. , Reynolds, M.P. , Davies, W.J. and Sukumaran, S. (2017) Phenotypic and genome‐wide association analysis of spike ethylene in diverse wheat genotypes under heat stress. New Phytol. 214, 271–283. [DOI] [PubMed] [Google Scholar]
- Vikram, P. , Franco, J. , Burgueño‐Ferreira, J. , Li, H. , Sehgal, D. , Saint Pierre, C. , Ortiz, C. et al. (2016) Unlocking the genetic diversity of Creole wheats. Sci. Rep. 6, 23092. [DOI] [PMC free article] [PubMed] [Google Scholar]
- Wang, S. , Wong, D. , Forrest, K. , Allen, A. , Chao, S. , Huang, B.E. , Maccaferri, M. et al. (2014) Characterization of polyploid wheat genomic diversity using a high‐density 90000 single nucleotide polymorphism array. Plant Biotechnol. J. 12, 787–796. [DOI] [PMC free article] [PubMed] [Google Scholar]
- Wang, S. , Zhang, X. , Chen, F. and Cui, D. (2015) A single‐nucleotide polymorphism of TaGS5 gene revealed its association with kernel weight in Chinese bread wheat. Front. Plant Sci. 6, 1166. [DOI] [PMC free article] [PubMed] [Google Scholar]
- Wang, S. , Yan, X. , Wang, Y. , Liu, H. , Cui, D. and Chen, F. (2016) Haplotypes of the TaGS5‐A1 gene are associated with thousand‐kernel weight in Chinese bread wheat. Front. Plant Sci. 7, 783. [DOI] [PMC free article] [PubMed] [Google Scholar]
- Winfield, M.O. , Allen, A.M. , Burridge, A.J. , Barker, G.L. , Benbow, H.R. , Wilkinson, P.A. , Coghill, J. et al. (2016) High‐density SNP genotyping array for hexaploid wheat and its secondary and tertiary gene pool. Plant Biotechnol. J. 14, 1195–1206. [DOI] [PMC free article] [PubMed] [Google Scholar]
- Würschum, T. , Langer, S.M. , Longin, C.F.H. , Tucker, M.R. and Leiser, W.L. (2018) A three‐component system incorporating Ppd‐D1, copy number variation at Ppd‐B1, and numerous small‐effect quantitative trait loci facilitates adaptation of heading time in winter wheat cultivars of worldwide origin. Plant, Cell Environ. 41, 1407–1416. [DOI] [PubMed] [Google Scholar]
- Xu, Y. and Crouch, J.H. (2008) Marker‐assisted selection in plant breeding: from publications to practice. Crop Sci. 48, 391–407. [Google Scholar]
- Yang, X. , Pan, Y. , Singh, P.K. , He, X. , Ren, Y. , Zhao, L. , Zhang, N. et al. (2019) Investigation and genome‐wide association study for Fusarium crown rot resistance in Chinese common wheat. BMC Plant Biol. 19, 153. [DOI] [PMC free article] [PubMed] [Google Scholar]
- Zhang, Y. , Zhang, J. , Huang, L. , Gao, A. , Zhang, J. , Yang, X. , Liu, W. et al. (2015) A high‐density genetic map for P genome of Agropyron Gaertn. based on specific‐locus amplified fragment sequencing (SLAF‐seq). Planta, 242, 1335–1347. [DOI] [PubMed] [Google Scholar]
- Zimin, A.V. , Puiu, D. , Hall, R. , Kingan, S. , Clavijo, B.J. and Salzberg, S.L. (2017) The first near‐complete assembly of the hexaploid bread wheat genome, Triticum aestivum . Gigascience, 6, gix097. [DOI] [PMC free article] [PubMed] [Google Scholar]
Associated Data
This section collects any data citations, data availability statements, or supplementary materials included in this article.
Supplementary Materials
Figure S1 SNP frequency distribution of the five arrays. a–e: Wheat 35K SNP array, Wheat 55K SNP array, Wheat 90K SNP array, Wheat 660K SNP array, and Wheat 820K, respectively.
Table S1 Comparison of different wheat SNP arrays on size, cost, provider, technology, reference and weblink.
Table S2 SNPs with reliable physical positions in the Wheat 660K SNP array.
Table S3 SNPs and corresponding annotated genes in Wheat 35K arrays. The header line indicates the SNP name, chromosome, physical position, SNP located in gene region or 2kb before ATG of this gene, gene name, start and end positions of genes, and array name. The same below.
Table S4 SNPs and corresponding annotated genes in Wheat 55K arrays.
Table S5 SNPs and corresponding annotated genes in Wheat 90K arrays.
Table S6 SNPs and corresponding annotated genes in Wheat 660K arrays.
Table S7 SNPs and corresponding annotated genes in Wheat 820K arrays.