

Abstract
The hypothalamus and hippocampus are sensitive to early exposure to endocrine disrupting chemicals (EDC). Two EDC that have raised particular concern include bisphenol A (BPA), a widely prevalent chemical in many common household items, and genistein (GEN), a phytoestrogen present in soy and other plants. We hypothesized that early exposure to BPA or GEN may lead to permanent effects on gene expression profiles for both coding RNAs (mRNAs) and microRNAs (miRs), which can affect the translation of mRNAs. Such EDC-induced biomolecular changes may affect behavioral and metabolic patterns. California mice (Peromyscus californicus) male and female offspring were developmentally exposed through the maternal diet to BPA (5 mg/kg feed weight, low dose- LD and 50 mg/kg, upper dose-UD), GEN (250 mg/kg feed weight), or a phytoestrogen-free control diet (AIN). Behavioral and metabolic tests were performed at 180 days of age. qPCR analysis was performed for candidate mRNAs and miRs in the hypothalamus and hippocampus. LD BPA and GEN exposed California mice showed socio-communication impairments. Hypothalamic Avp, Esr1, Kiss1, and Lepr were increased in LD BPA offspring. miR-153 was increased but miR-181a decreased in LD BPA offspring. miR-9 and miR-153 were increased in hippocampi of LD BPA offspring, whereas, GEN decreased hippocampal miR-7a and miR-153 expression. Correlation analyses revealed neural expression of miR-153 and miR-181a was associated with socio-communication deficits in LD BPA individuals. Findings reveal cause for concern that developmental exposure of BPA or GEN in California mice, and potentially by translation in humans, can lead to long standing neurobehavioral consequences.
Keywords: Genistein, Bisphenol A, BPA, Epigenetics, Cognition, Communication, Brain, miRNA, Non-Coding RNA
1. Introduction
Fetuses and infants are often exposed to endocrine disrupting chemicals (EDC), such as bisphenol A (BPA) and genistein (GEN), through the placenta and milk (1–10). Infants provided fed soy-based diets may also be directly exposed to GEN and other phytoestrogens. Developmental exposure of human offspring to such EDC may disrupt later behaviors and increase the risk for autism spectrum disorders (ASD) and other neurobehavioral disorders (11–19).
In our previous studies, we tested the effects of BPA in two species of Peromyscus, rodents who are solely distributed throughout North America. The first species of Peromyscus we tested was deer mice (P. maniculatus baidii), which are polygynous. Males of this species are highly dependent upon spatial navigation to locate potential breeder females who may be widely distributed throughout the environment (20). Developmental exposure to BPA or ethinyl estradiol (EE, estrogen of birth control pills) led to spatial navigation deficits in male deer mice, and females of this species exposed to EE exhibited a masculinized pattern, as evidenced by enhanced spatial learning and memory (21, 22). We went on to examine the effects of developmental exposure to BPA in California mice (P. californicus) who, in contrast to deer mice, demonstrate monogamous pair bonding behavior and biparental care. In this species, early BPA exposure resulted in decreased territorial marking behavior by males, a behavior essential for the male to protect himself and his mate from potential intruders, and suppressed biparental care (23, 24). Congruently, in the hypothalamus of BPA-exposed California mice parents, estrogen receptor 1 (Esr1), estrogen receptor 2 (Esr2), and kisspeptin 1 (Kiss1) were elevated (25). We have recently shown that California mice developmentally exposed to GEN show socio-communication behavioral deficits at weaning (26).
The behavioral changes observed in male and female California offspring are likely due to underlying gene expression changes in the hippocampus or hypothalamus with the former regulating cognitive behaviors and the latter governing socio-sexual and indirectly regulating metabolic effects, such as through regulation of appetite. In other rodent models, BPA and GEN have shown to lead to gene expression changes in these brain regions (27–36).
However, it is also increasingly becoming clear that EDC, including BPA, may regulate microRNAs (miR) expression profiles in other organs (37–42). miR are initially transcribed as primary transcripts that can be up to several kilobases in length (43, 44). Such primary transcripts are then cleaved by RNase III enzymes, Drosha in the nucleus and Dicer in the cytoplasm to yield 70 nucleotide (nt) long precursor miR and subsequently 19–22 log mature miRs, respectively. miR regulate post transcriptional expression by becoming part of the multiprotein RNA induced silencing complex (RISC) and binding to the 3’ untranslated region of mRNA. This binding causes mRNA degradation or suppression of inhibiting translation of the mRNA to a protein with the net effect that miR epigenetically silence certain genes. It is uncertain whether BPA and GEN affect the miR expression profiles with the hypothalamus and hippocampus.
To address this critical knowledge gap, we placed California mice dams two weeks prior to breeding on diets containing a lower dose BPA (LD BPA), upper dose BPA (UD BPA), GEN, or none of these EDC. Females were maintained on these diets throughout gestation and lactation. When male and female offspring reached adulthood (90 days of age), we tested them with a suite of behavioral and metabolic outcomes. The expression pattern for several genes, previously shown to be affected by BPA and/or GEN were tested, along with miR (miR-7a, miR-9, miR-153, and miR-181a) that have been shown to be either affected or act upon estrogen signaling pathways in the brain or implicated in neurobehavioral disorders, including ASD (45–48). The underlying hypothesis of these studies is that early exposure to BPA or GEN may lead to long standing behavioral and metabolic disturbances that correlate with expression of mRNA and miR in the hypothalamus and hippocampus.
2. Materials and Methods
2.1. Animals and treatments
Founder adult California mouse (Peromyscus californicus) males and females were acquired from the Peromyscus Genetic Stock Center (PGSC) at the University of South Carolina (Columbia, SC). At the time, these founder pairs were 60–90 days of age and free of common rodent pathogens. They were shipped to the University of Missouri and placed in quarantine, along with sentinel mice, for a minimum of 8 weeks to ensure that they did not carry any transmittable rodent pathogens. No diseases have been identified to date in any sentinel or colony animals. After the quarantine period, animals were relocated to the Animal Sciences Research Center (ASRC), where we have our own breeding colony established. Additional animals have been routinely purchased from the PGSC in order to maintain the outbred status of the colony. All experiments were approved by the University of Missouri Animal Care and Use Committee (Protocol #9590) and performed in accordance with the recommendations in the National Institutes of Health Guide for the Care and Use of Laboratory Animals.
Breeder pairs were housed in polystyrene cages (Allentown, NJ), and weaned F1 male and female offspring were singly housed in polypropylene cages (Allentown) to reduce background exposure to bisphenol A (BPA). They were also provided glass water bottles with BPA-free water and tubes for environmental enrichment. Virgin females (8–12 weeks of age) were randomly assigned to receive one of four diets: 1) a low phytoestrogen AIN 93G diet (CTL-AIN diet) supplemented with 7% corn oil by weight to minimize potential phytoestrogenic contamination that would otherwise come from using soy oil as the primary fatty acid source; 2) a diet supplemented with 250 mg/kg feed weight of genistein (GEN); 3) a diet supplemented with a “low dose- LD” of BPA (5 mg/kg feed weight); or 4) a diet supplemented with a “upper dose-UD” of BPA (50 mg/kg feed weight), which we have documented to lead to internal serum concentrations in rodents (22, 49) approximating those measured in pregnant women and the human population in general that is unknowingly exposed to this chemical (50–53). The P0 dams remained on the assigned diet for two weeks prior to mating (periconceptional period), throughout gestation, and throughout lactation, as described previously (21–23). Dams remained on the assigned diet until pups were weaned at 30 days of age. The reason for this continued exposure is that brain development in rodents extends throughout the post-natal period (54, 55). This dietary method was used to replicate the maternal diet exposure of fetuses and neonates to GEN and BPA, which can be transmitted to the offspring both across the placenta and through the milk. Offspring were weaned at 30 days of age and placed on the control (AIN) diet. The GEN concentration has previously been shown to affect various parameters in mice (56–58) and result in similar circulating concentrations as in humans consuming soy-rich diets (59). We, and others, have demonstrated that the LD and UD of BPA cause various behavioral disruptions in rodent models (21–23, 32, 60–62). At weaning one male and one female pup from each litter were analyzed for the parameters below (n = 6 males and 6 females/treatment group).
2.2. Behavioral tests:
2.2.1. Social testing
When the California mice reached 180 days of age, they underwent Crawley’s sociability and preference for social novelty three-chambered test, as described previously (26, 63). This test was designed to identify potential social deficits (63). The three-chambered apparatus had two openings, which allowed the test animal to move freely between the three chambers. The left and right chamber contained wire mesh cups that held stranger (novel) individuals that were similar in age, sex, and maternal treatment to the test mouse. Each experimental individual was tested for three trials. Prior to the test, the experimental and stranger individuals were acclimated to the testing room for 30 minutes. In the first trial, the test individual was placed into the center chamber and acclimated to the test apparatus for 5 minutes with no stranger mice present during this trial. Both stranger individuals were placed in individual wire mesh cups and acclimated to the testing apparatus for 5 minutes. In trial 2, the experimental individual was placed in the center chamber and one stranger individual was placed in a wire-mesh cup in the left chamber, and the trial duration was 10 minutes. In trial 3, the experimental individual was placed in the center chamber and the previous “stranger” individual was placed in a wire-mesh cup on the left chamber side, and stranger 2 was placed in a wire-mesh cup on the right side of the chamber, and the test duration lasted for 10 minutes. Each trial was video-recorded using a Logitech Carl Zeiss Tessar HD 1080P (Newark, CA) camera mounted onto a Joby Gorilla Pod Original Tripod (Daymen US Inc., Petaluma, CA). After each trial, all animals were removed and apparatus was cleaned with a 70% ethanol solution. Video data collected from this test were analyzed using Observer software version 11.5 (Noldus, Leesberg, VA). Behaviors such as rearing, grooming, and nose-to-nose contacts with the stranger individuals (in Trials 2 and 3) were determined, along with the location of the mouse within the three-chambered apparatus.
2.2.2. Vocalizations
Immediately after trial 3 of the social behavior testing, test individuals were placed in a clean, empty polypropylene cage and transferred into a polypropylene box lined with 2 inches of acoustic foam paneling (Soundproof Cow, Chambersburg, PA), as we have done previously (64, 65). The box contained a small light source (20-watt LED puck lights, Intertek, London, UK) and an Avisoft Bioacoustics CM16/CMPA40–5V microphone (Glienicke, Germany) that was 33 cm from the floor of the box. The microphone was connected to National Instruments USB 6351 data collection board, which was plugged into a Dell OptiPlex 7010 (Dell Incorporated, Roundrock, TX). Audio was recorded for 5 minutes. Recordings measured include audible calls and ultrasonic vocalizations (USVs) that are above 20 kHz and out of the hearing range for humans. The polypropylene box was cleaned with 70% ethanol after each test mouse. Data were collected using code written by Dr. A. Katrin Schenk (Randolph College) by using MATLAB 2015a.Ink version 8.5.0.197613 (R2015a) software (MathWorks, Natick, MA). Vocalizations were separated from background noise and analyzed using MATLAB software designed by Dr. Katrin Schenk. Categories evaluated include number of syllables, syllable duration, syllable median frequency, average syllable power, and power percent above and below 20 kHz, as described previously (26, 64).
2.3. Metabolic assessments
2.3.1. Indirect calorimetric testing
After completion of the above tests, adult (~190 day old) animals were tested in the Promethion continuous measurement indirect calorimetry system (Sable Systems International, Las Vegas, NV) for 3 days as we have described previously (66, 67). Data were divided into 12-hour light and 12-hour dark cycles. Parameters that were measured include energy expenditure (EE), respiratory quotient (RQ) from oxygen consumption vs. CO2 production, activity by beam breaks (X – vertical, Y – horizontal, and Z-Rearing), food, and water intake. Beam break quantification is indicative of total movement within the home-cage.
2.3.2. EchoMRI
After the indirect calorimetric testing was completed, the animals were tested in the EchoMRI-1100 (EchoMRI LLC, Houston, TX) to analyze body composition, as described previously (66, 67). Parameters measured in a rapid and non-invasive manner include total and lean fat.
2.4. Hippocampal/Hypothalamic mRNA and miR Expression
2.4.1. Hippocampal/hypothalamic punches and RNA isolation
Upon completion of all assessments at PND180, animals were humanely euthanized. Brains were removed from the cranium and rapidly frozen on dry ice. The frozen brains were stored at −80°C until further processing. The hippocampal and hypothalamic regions were micro-punched on dry ice. For the hypothalamus, a Harris Micro-Punch 1 mm in diameter and 1 mm in depth (Catalogue # 15091, Ted Pella, Redding, CA, USA) was used to obtain one punch that spanned the rostral to caudal medial regions of this brain region. For the hippocampus, the same Micro-Punch was used to obtain two punches that spanned the rostro-dorsal to caudo-ventral regions and thereby samples from both the CA1 and CA3 nuclei were collected. All tissues were then immersed in 100 μl of RNAlater™-ICE frozen tissue transition solution (Catalogue # 4427575, Invitrogen, Carlsbad, CA) and treated for over 16 hrs before total RNA isolation. RNA and miRNA were isolated by using the AllPrep DNA/RNA/miRNA Universal Kit (Catalogue #80224; Qiagen, Hilden, Germany). After RNA isolation, RNA was quantified by spectrophotometrical analysis (Nanodrop 2000, ThermoFisher Scientific, Waltham, MA, USA). The results were further confirmed by analyzing the RNA on the Fragment Analyzer (Advanced Analytical Technologies, Ankeny, IA). Only those samples that had a RNA integrity number (RIN) score above 7 were used for qPCR analyses. Next, 100 ng of mRNA and miR were reverse transcribed to cDNA with miScript II RT kit (Catalogue #218161; Qiagen).
2.4.2. qPCR
The Bio-Rad SYBR Green Master Mix (Catalogue # 1725121, Hercules, CA) was used according to the manufacturer’s protocol. Primers were ordered from Integrated DNA Technologies, Inc. (IDT, Coralville, IA). Ten genes previously suggested to be affected by BPA were tested [25]: Avp, Esr1, Esr2, Kiss1, Lepr, Oxtr, Gnrh, Bdnf, Dnmt3a, and Dnmt3b. Four miR (miR-7a, miR-9, miR-153, and miR-181a) that have been shown to be either affected or act upon estrogen signaling pathways in the brain or implicated in neurobehavioral disorders, including ASD (45–48) were also tested. In pilot studies, we tested a range of housekeeping genes, including B2m1, Gapdh, and Actb and found that B2m1 provides the most consistent results in that it is not affected in California mice by maternal exposure to BPA (68). Supplementary Table 1 provides information on the primer sequences and expected product sizes. Several splice variants may exist for Esr1 and Esr2, and thus we sought to determine which variants the primers for each of these genes may detect. However, the genomic sequence data for California mice is not currently available. Thus, we used their related cousins, Peromyscus maniculatus bairdii for comparison with National Center for Biotechnology Information Basic Local Alignment Search Tool (NCBI BLAST). Based on this comparison, the primers for Esr1, may detect X1, X2, X3, and X4 variants. Those for Esr2 may detect X1 and X2. For the tested miRs, the Applied Biosystems universal reverse primer was used (Cat# 100029185, Applied Biosystems). The forward primer for miR-153 and internal control, U6, were based on previously published sequences (45). Those for miR-7a, miR-9, and miR-181a are from (47). To calculate the amplification efficiency of primers, pooled sample was serially diluted to 1:10, 1:100, 1:1000, 1:10000, and 1:100000. Their resulting Ct values were plotted on a logarithmic scale along with corresponding concentrations. Next, a linear regression curve was generated through the data points, and the slope of the trend line was calculated. Finally, efficiency was calculated by using the equation of E = −1+10(−1/slope). For the actual assays, two replicates were tested for each sample. The Bio-Rad CFX Connect Real-Time PCR Detection System (Bio-Rad) was used for qPCR analysis. The cycling conditions for cDNA derived from coding genes were 1) 95°C for 5 min for polymerase activation 2) 40 cycles of; denaturation 15 seconds at 94 °C, annealing and extension 30 seconds at 55 °C, and 3) dissociation melt curve analysis of denaturation at 95°C, complete annealing at 55 °C, followed by a gradual increase in temperature up to 95°. For cDNA derived from miR, cycling conditions used were 1) 95°C for 3 min for polymerase activation, 2) 40 cycles of; denaturation 15 seconds at 95 °C, annealing and extension 30 seconds at 59 °C, and 3) dissociation melt curve analysis of denaturation at 95°C, complete annealing at 55 °C, followed by a gradual increase in temperature up to 95°.
2.5. Integrative correlation analyses
We used the mixOmics R package (69) to correlate the behavioral and metabolic outcomes, mRNA expression profiles in hippocampus and hypothalamus, and miR expression profiles in hippocampus and hypothalamus. We conducted sparse discriminant analysis with partial least square regression with function ‘block.splsda’. The circos plot was generated by using the ‘circosPlot’ function with correlations calculated by the method described by González, et al. (70). A correlation coefficient ≥ 0.85 was used as the cutoff.
2.6. Statistics
Gene expression data determined by qPCR analyses were normalized by housekeeping genes (B2m1 for mRNA and U6 for miRNAs). They were then logarithmically transformed to approach a normal distribution and analyzed by using the PROC GLM procedure of SAS version 9.4 Software (SAS Institute, Cary, NC). Graphs are based though on 2−ΔΔCt values relative to the control values, whose mean value was set to 1 for graphing purposes. To examine for maternal treatment X sex interactions, the group mean for control males or females were then determined based on the mean value of these sexes relative to the group mean value of 1.
Data for dependent variables determined by Promethion indirect calorimetry unit were first processed through ExpeData analyses (V1.9.22, Sable Systems International, North Las Vegas, NV). These Met Chamber data were analyzed by Mixed procedure of SAS (V9.4) with treatment, mouse sex, light cycle (light and dark) and interactions between them as source of variance.
Lean and fat body composition as determined by EchoMRI, social behaviors in the three-chamber social testing, such as nose-to-nose interaction frequency and interaction duration with stranger mouse in Trials 2 and 3, and vocalization parameters were analyzed by using the PROG GLM procedure of SAS. The sources of variation considered were treatment, sex, and treatment × sex interaction. To determine if any difference in social interaction with Stranger 1 between Trial 2 and 3, and differences between Stranger 1 and 2 in Trial 3, behavior data were analyzed with treatment, sex, trail, stranger and interactions as source of variance. Mean differences were determined using Fisher’s Protected Least Significant Difference (LSD), as described by Steel (71). The LSD was only calculated if the overall F test was significant (72, 73). All data are presented as actual means (). The error bars for all figures and reported data represent the standard error of the mean (SEM).
3. Results
3.1. Behavioral results
3.1.1. Social testing
Maternal treatment affected frequency and duration California mice spent investigating, as evidenced by nose-to-nose contact, Stranger 1 and 2 individuals in Trial 3 of the social testing (p ≤ 0.05). Those exposed to GEN showed reduced frequency to investigate Stranger 1 and Stranger 2 mice in Trial 3 compared to AIN controls (p ≤ 0.0001 for both Stranger 1 and 2 individuals for GEN vs. AIN individuals; Figure 1A and B). LD BPA had reduced incidences investigating Stranger 2 compared to AIN controls (p = 0.03, Figure 1B). There was a trend for LD BPA to have less investigatory episodes with Stranger 1 individuals relative AIN controls in this trial (p = 0.06, Figure 1B). GEN exposed individuals spent less overall time investigating Stranger 1 and 2 individuals in Trial 3 relative to AIN controls (p = 0.02 for Stranger 1 and p = 0.005 for Stranger 2; Figure 1C and D). While there were no differences in these social categories for maternal treatment X sex interactions, social data separated based on sex are shown in Figure S1, as these results were used for the integrative correlation analyses detailed below.
Figure 1.

Effects of BPA and GEN exposure on social behaviors. A) Number of times spent investigating Stranger 1 in Trial 3 of social testing. GEN exposed individuals showed reduced incidences of investigating Stranger 1 in this trial. B) Number of times spent investigating Stranger 2 in Trial 3 of social testing. Both LD BPA and GEN exposed individuals had reduced number of incidences investigating Stranger 2 in this trial. C) Duration of time spent investigating Stranger 1 in Trial 3 of social testing. GEN exposed individuals showed reduced duration of investigating Stranger 1 in this trial. D) Duration of time spent investigating Stranger 2 in Trial 3 of social testing. GEN exposed individuals showed reduced duration of investigating Stranger 2 in Trial 3 of social testing. N = 12 individuals (males and females combined)/treatment group.
3.1.2. Vocalization testing
California mice offspring exposed to UD BPA elicited greater number of calls (syllables) in isolation than AIN controls (p = 0.02, Figure 2A). Those exposed to LD BPA or GEN showed decreased mean duration in the calls relative to AIN controls (p ≤ 0.05, Figure 2B). As we defined previously (64, 65), a group of calls is considered a burst or phrase, and we analyzed this pattern of vocalizations as well. Those exposed to the UD BPA showed greater number of calls in each burst relative to AIN (p=0.04, Figure 2C). Similar to the individual calls, mean burst duration was significantly decreased in those exposed to GEN or LD BPA (p < 0.0001, Figure 2D). While there were no differences in these vocalization categories for maternal treatment X sex interactions, vocalization data separated based on sex are shown in Figure S2, as these results were used for the integrative correlation analyses detailed below.
Figure 2.

Effects of BPA and GEN on vocalization behaviors. A) Average number of calls. Individuals exposed to UD BPA exhibited greater number of calls when placed in isolation. B) Average duration of calls. LD BPA and GEN exposed individuals showed reduced duration of calls. C) Average number of calls in a burst. UD BPA individuals showed greater number of calls in each burst. D) Average duration of bursts. LD BPA and GEN exposed individuals showed reduced duration of bursts. N = 12 individuals (males and females combined)/treatment group.
3.2. Metabolic results
3.2.1. Indirect calorimetry unit
A treatment and sex interaction was evident for RQ value during the light cycle. In females, those exposed to LD BPA, UD BPA, or GEN exhibited greater RQ value than AIN controls during the light cycle, suggestive that these groups were metabolizing carbohydrates rather than fats (p ≤ 0.0001, Figure 3A). In males, those exposed to LD BPA or UD BPA had greater RQ value than AIN controls (p = 0.005 and ≤ 0.0001, respectively, Figure 3B). For walking speed during the light cycle, a treatment and sex interaction was evident (p = 0.02). No differences were detected between female groups for this category (Figure 3C). Males exposed to the UD BPA walked slower during the light cycle than AIN controls (p = 0.05, Figure 3D).
Figure 3.

RQ value and walking speed during the light cycle. A) Average RQ value for females during the light cycle. LD BPA and UD BPA female showed increased RQ value during the light cycle. B) Average RQ value for males during the light cycle. UD BPA males showed increased RQ value during the light cycle. C) Average walking speed for females during the light cycle. No differences were detected between female groups. D) Average walking speed for males during the light cycle. UD BPA male showed reduced walking speed during the light cycle. N = 6 individuals/treatment group and sex.
Total number of beak breaks, which is a strong indicator, of voluntary physical activity, showed maternal treatment effects during the light cycle (p = 0.009). LD BPA and GEN exposed individuals had greater number of XYZ beam breaks than AIN Controls during the day cycle (p = 0.01 and 0.003, respectively, Figure S3).
During the dark cycle when rodents are most active, total energy expenditure differed based on maternal treatment (p = 0.05). Total energy expenditure during this cycle was greater in LD BPA and UD BPA individuals compared to AIN controls (p = 0.006 and 0.04, respectively, Figure S4). Average RQ value during the dark cycle also showed treatment and sex interaction effects (p = 0.01). During this cycle, females exposed to LD BPA, UD BPA, and GEN had greater RQ value than AIN controls (p ≤ 0.0001, Figure 4A. All three groups of exposed males showed a greater RQ value compared to AIN males during the dark cycle (p = 0.002- LD BPA males vs. AIN males; p ≤ 0.0001 for UD BPA males vs AIN males; p = 0.04 GEN males vs. AIN males, Figure 4B).
Figure 4.
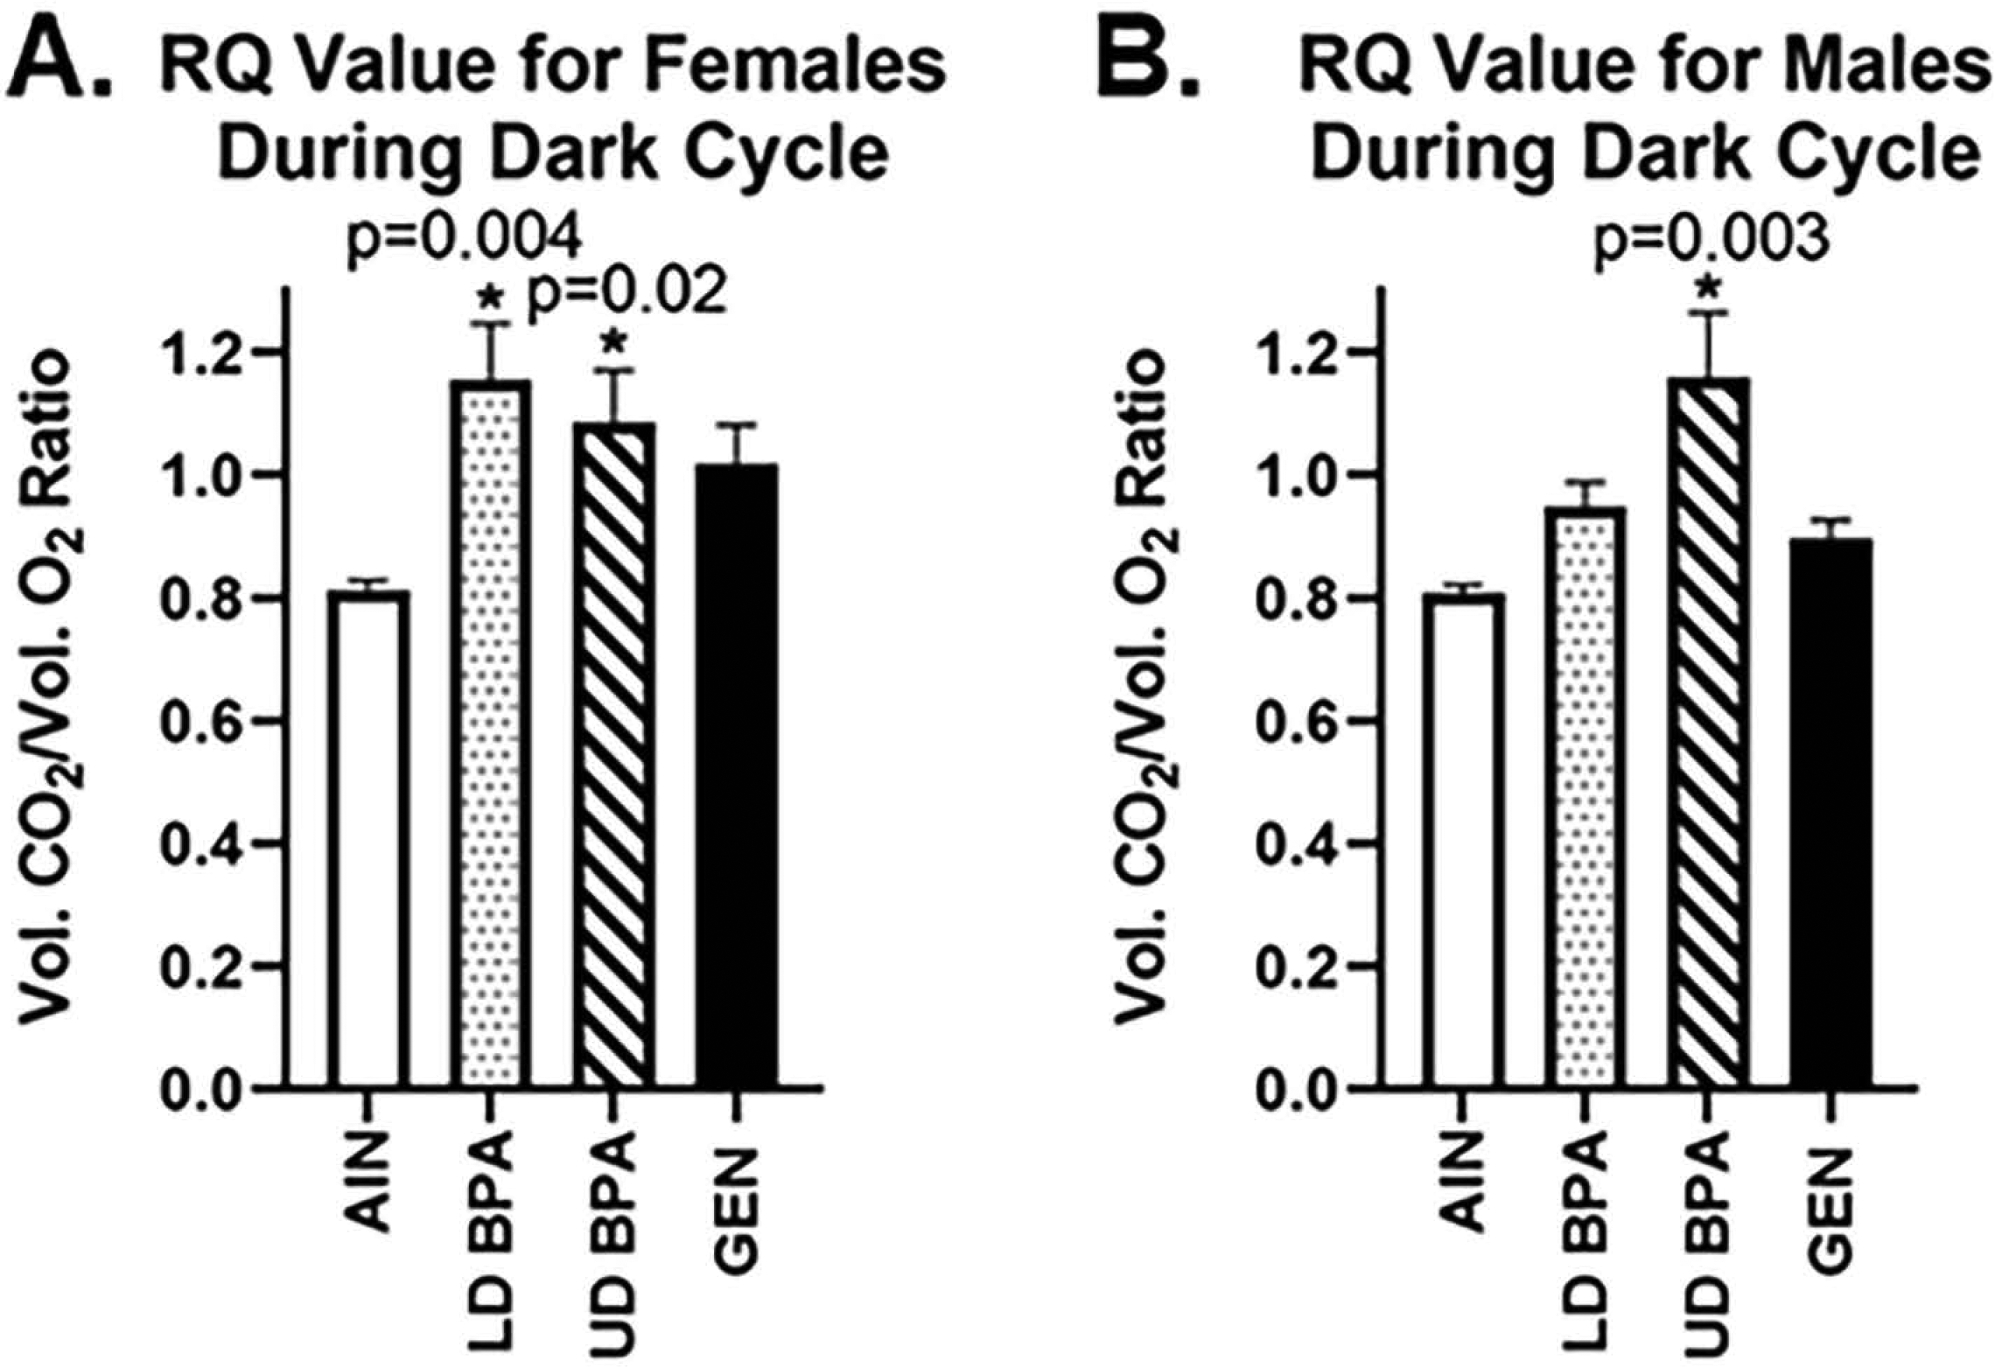
RQ value during the dark cycle. A) Average RQ value for females during the light cycle. LD BPA and UD BPA female showed increased RQ value during the dark cycle. B) Average RQ value for males during the light cycle. UD BPA males showed increased RQ value during the dark cycle. N = 6 individuals/treatment group and sex.
3.2.2. EchoMRI
No differences were detected based on treatment or treatment and sex interactions for total and lean fat (Supplemental Table 2).
3.3. qPCR results
3.3.1. mRNA expression
In the hypothalamus, Avp, Esr1, Kiss1, and Lepr were increased in LD BPA exposed offspring (Figure 5, p = 0.02 for Avp, Esr1, Lepr and 0.01 for Kiss1). In contrast, Oxtr was decreased in this brain region for LD BPA exposed offspring (p = 0.002).
Figure 5.
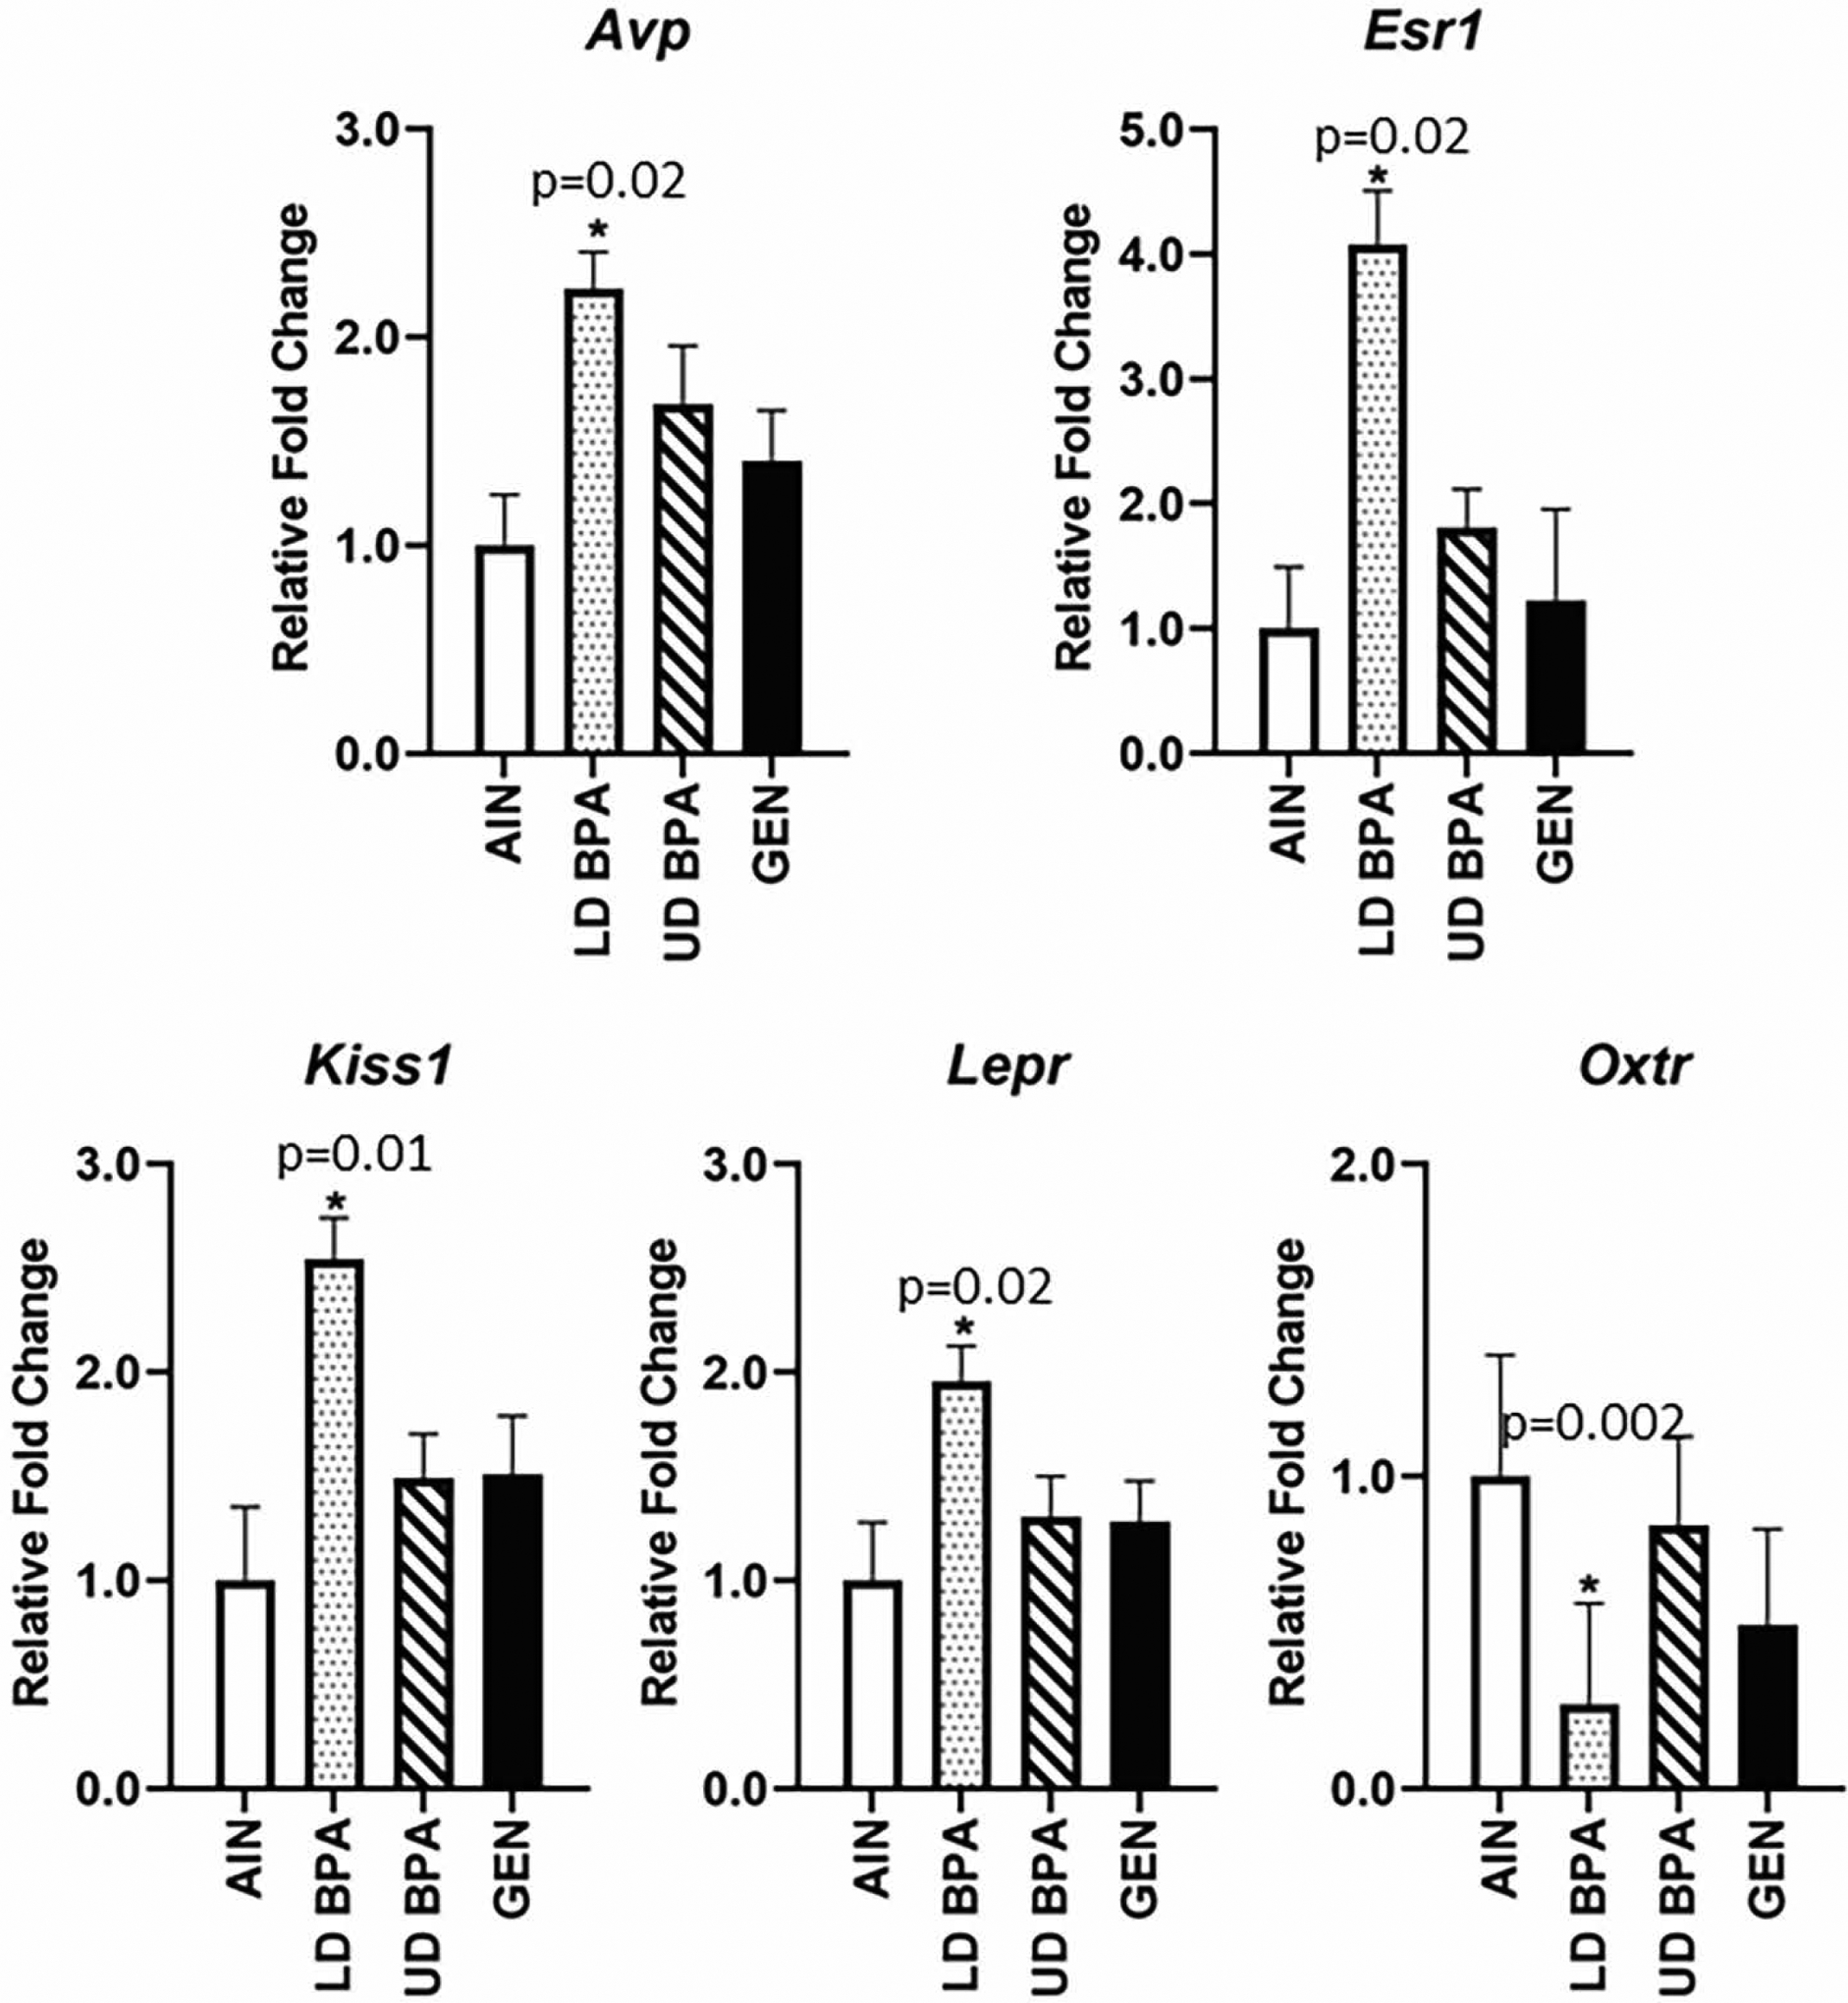
Hypothalamic gene expression as determined by qPCR analysis for Avp, Esr1, Kiss1, Lepr, and Oxtr. Significant differences relative to AIN controls are depicted with an asterisk and associated p value. N = 12 individuals (males and females combined)/treatment group.
UD BPA and GEN resulted in more gene expression changes in the hippocampus with UD BPA and GEN increasing the expression of Avp, Bdnf, and Lepr (p ≤ 0.05, Figure 6). Those exposed to the UD BPA also showed increased hippocampal expression for Esr1 (p=0.01), whereas GEN increased Dnmt3a and Kiss1 expression (p = 0.01 and 0.004, respectively). LD BPA exposure decreased hippocampal expression of Esr2 (p = 0.02). For Gnrh, LD BPA, UD BPA, and GEN resulted in increased expression relative to AIN controls (p = 0.01 for LD BPA, 0.003 for UD BPA, and p= 0.002 for GEN, Figure 6).
Figure 6.
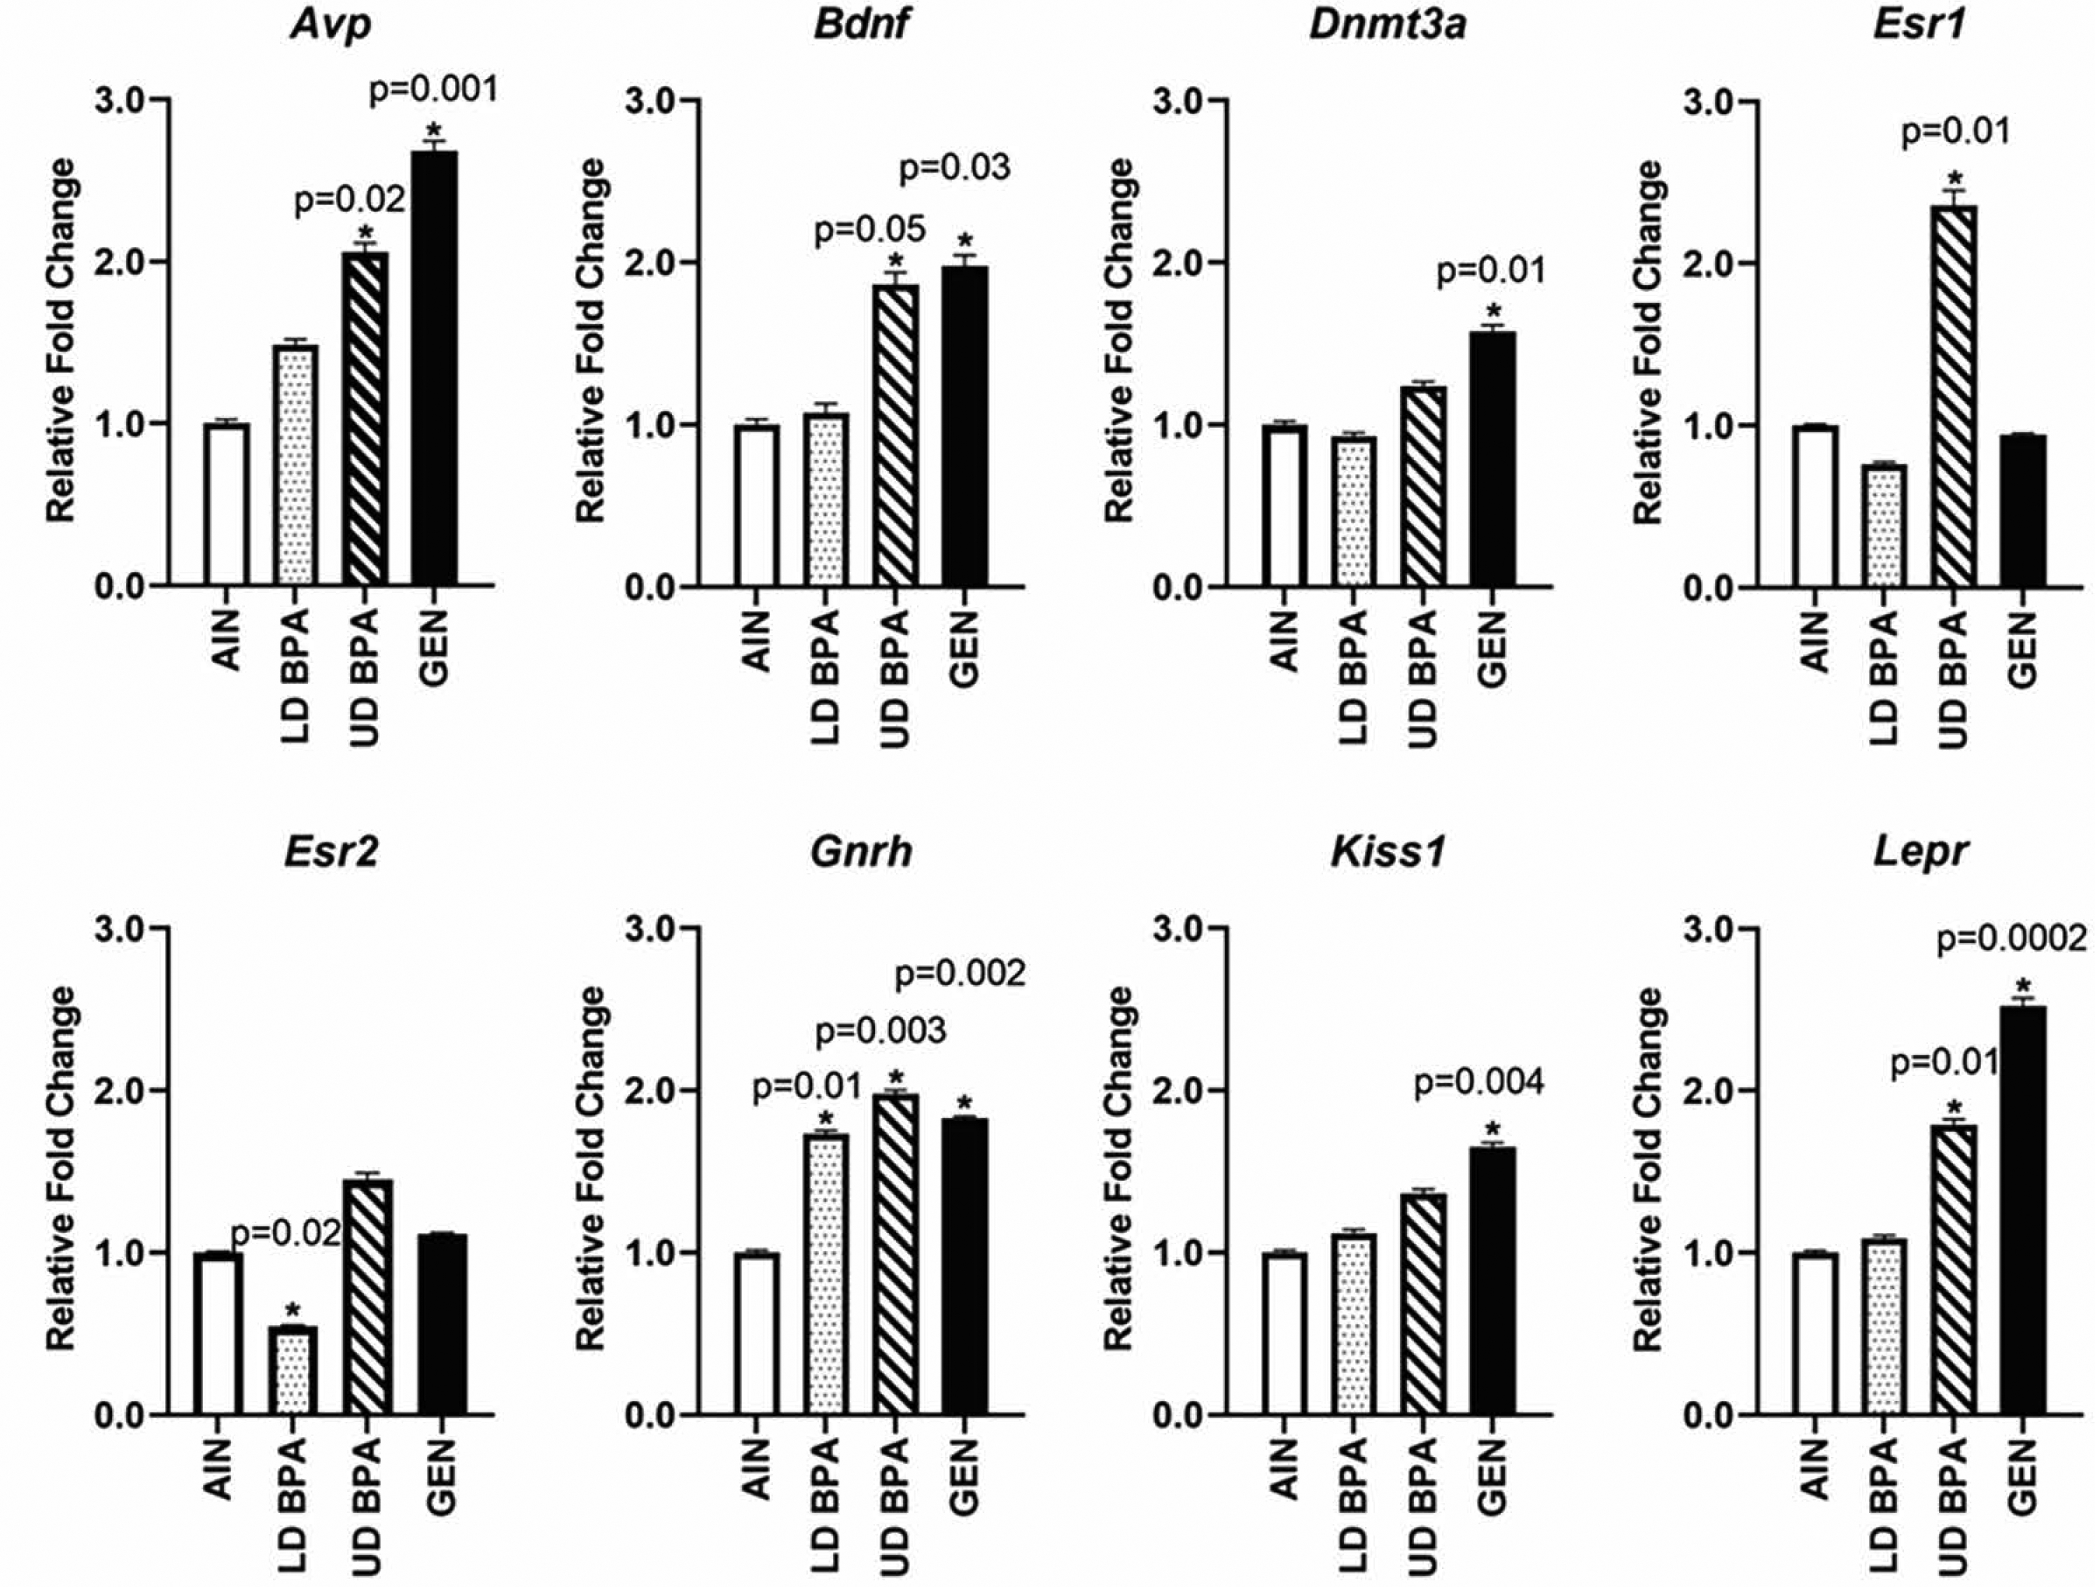
Hippocampal gene expression as determined by qPCR analysis for Avp, Esr1, Kiss1, Lepr, and Oxtr. Significant differences relative to AIN controls are depicted with an asterisk and associated p value. N = 12 individuals (males and females combined)/treatment group.
While there were no differences in the hypothalamic and hippocampal mRNA expression patterns based on maternal treatment X sex interactions, these data separated based on sex are shown in Supplementary Tables 3, and 4, respectively, as these results were used for the integrative correlation analyses detailed below.
3.3.2. miR expression
miR-153 was increased but miR-181a decreased in the hypothalamus of LD BPA exposed offspring compared to controls (p = 0.03 for both miRs, Figure 7). miR-153 were increased in hippocampi of LD BPA offspring (p=0.01), whereas, GEN exposure decreased miR-7a and miR-153 hippocampal expression (p = 0.05 and 0.002, respectively, Figure 7).
Figure 7.
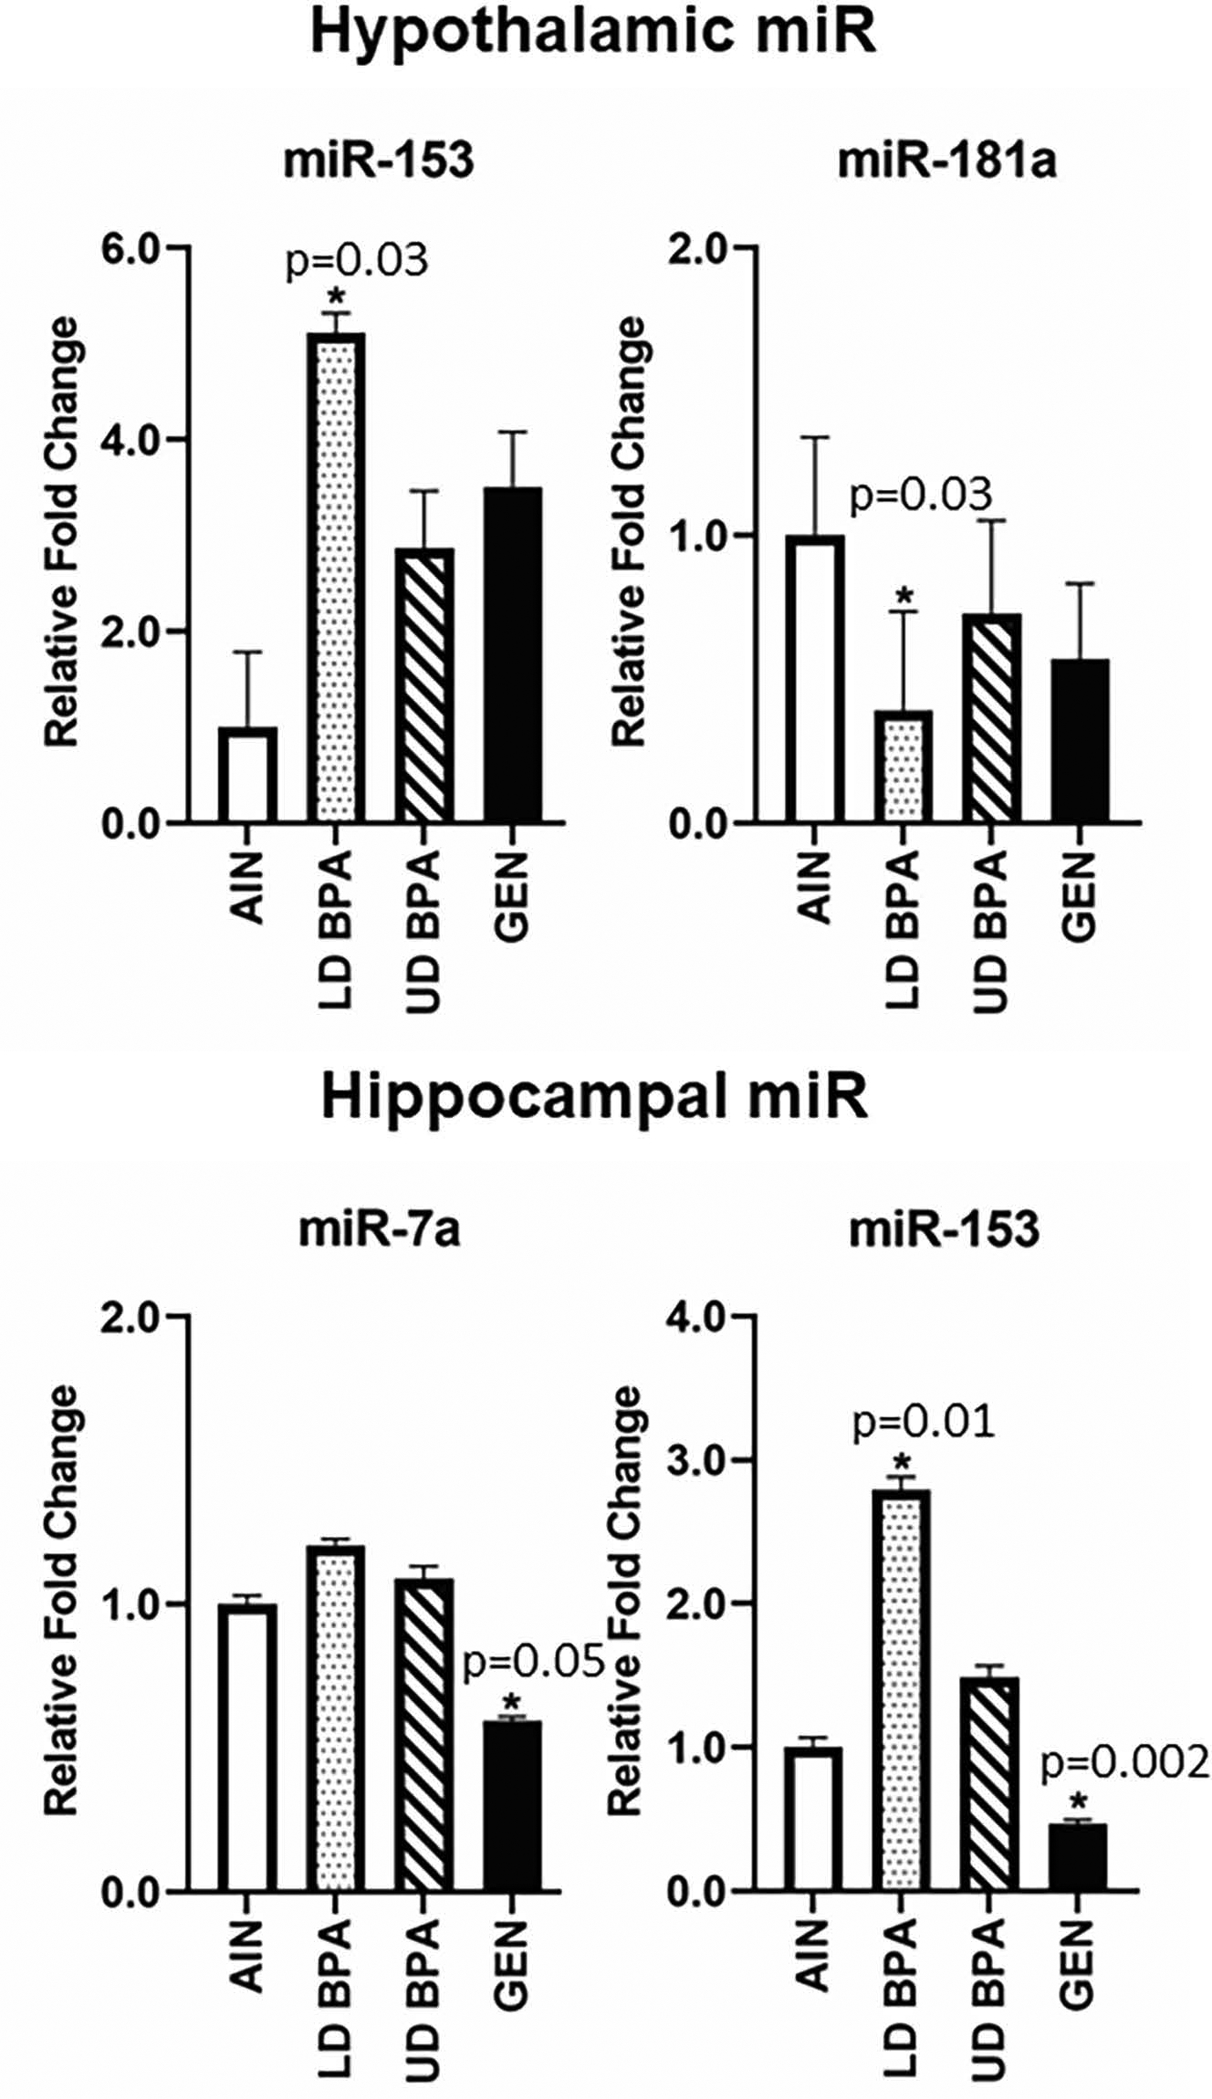
Hypothalamic and hippocampal miR expression as determined by qPCR. Significant differences relative to AIN controls are depicted with an asterisk and associated p value. N = 12 individuals (males and females combined)/treatment group.
Hippocampal miR-9 showed maternal treatment and sex interactions (p = 0.04). In females, those exposed to LD BPA had greater expression of miR-9 than AIN controls (p = 0.003; Figure S5). In males, GEN exposed individuals showed reduced expression of hippocampal miR-9 relative to AIN controls (p = 0.005, Figure S5). There was a trend for LD BPA exposed males to show greater expression of this miR in the hippocampus compared to AIN males (p =0.07).
While none of the other miRs showed maternal treatment X sex interactions in either brain region, these data separated based on sex are included in Supplementary Table 5, as these results were used for the integrative correlation analyses detailed below.
3.4. Integrative correlation analyses
To determine how the phenotypic and molecular changes relate to each other, we used mixOmics analysis with an r = 0.85 (69). California mice offspring exposed to LD BPA and GEN tended to show the most pronounced molecular and phenotypic effects that often mirrored each other. Thus, these groups will be the emphasis of this section. The mixOmics results from the UD BPA groups are included Figure S6 and S7.
For LD BPA females, several positive and negative inter-relationships were evident (Figure 8A). Frequency of social interactions with Stranger 2 mouse in Trial 3, which was reduced in LD BPA females, positively correlated with miR 9 hippocampal expression. Mean burst duration, which was reduced in this group, was positively associated with hypothalamic expression of miR-181a and miR-153. Hypothalamic Avp, which was increased in this group, was positively associated with fat %. For LD BPA females, mean burst duration was inversely associated with hypothalamic expression of Avp and Lepr, both of which were increased in this group (Figure 8B). Frequency spent with Stranger 2 in Trial 3, which was reduced in this group, was negatively associated with hypothalamic expression of Esr1 and Kiss1. Both of these genes were elevated in LD BPA group.
Figure 8.

Circos plot correlations for LD BPA exposed females vs. AIN control females. Correlation value was set to 0.85. Red lines in the center indicate a positive correlation (Panel A); whereas blue lines (Panel B) indicate a negative correlation. Lines on the outside of the circle indicate whether the value was greater in controls (blue) or LD BPA (orange).
In GEN females, a positive correlation between number of times investigating Stranger 2 in Trial 3, which was reduced in this group, and mean burst duration, also reduced in this group was evident (Figure 9A). For GEN females, frequency of interacting with Stranger 2 in Trial 3 was inversely associated with hypothalamic expression of Avp and Gnrh (Figure 9B).
Figure 9.

Circos plot correlations for GEN exposed females vs. AIN control females. Correlation value was set to 0.85. Red lines in the center indicate a positive correlation (Panel A); whereas blue lines (Panel B) indicate a negative correlation. Lines on the outside of the circle indicate whether the value was greater in controls (blue) or GEN (orange).
For LD BPA males, hypothalamic expression of miR-181a, which was reduced in this group, was positively associated with lean % (Figure 10A). The hippocampal expression of miR-153 was also positively correlated with body weight, fat weight, and fat %. Mean burst duration, which was reduced in this group, was inversely associated with hippocampal expression of miR-153 (Figure 10B).
Figure 10.

Circos plot correlations for LD BPA exposed males vs. AIN control males. Correlation value was set to 0.85. Red lines in the center indicate a positive correlation (Panel A); whereas blue lines (Panel B) indicate a negative correlation. Lines on the outside of the circle indicate whether the value was greater in controls (blue) or LD BPA (orange).
For GEN males, frequency and duration of interaction with Stranger 2 in Trial 3, both of which were reduced in this group, were positively associated with hypothalamic expression of Dnmt3a (Figure 11A). Hippocampal expression of miR-7a and miR-153, which were reduced in GEN exposed individuals was inversely associated with fat weight (Figure 11B), suggestive that reduced expression of this these miR may increase fat weight.
Figure 11.

Circos plot correlations for GEN exposed males vs. AIN control males. Correlation value was set to 0.85. Red lines in the center indicate a positive correlation (Panel A); whereas blue lines (Panel B) indicate a negative correlation. Lines on the outside of the circle indicate whether the value was greater in controls (blue) or GEN (orange).
4. Discussion
The goals of the current studies were to examine how developmental exposure to a lower and upper dose of BPA and GEN affect socio-communication behaviors and metabolic responses in adult California mice. Alterations in these behaviors and metabolic parameters might be due to changes in mRNA and miRNA expression patterns within the hippocampus and hypothalamus. Consequently, we used qPCR analysis to screen candidate mRNA and miRNA profiles in these two brain regions. The mixOmics analyses program was then used to establish potential associations between behavioral and metabolic results and miRNA/mRNA expression patterns.
Current studies suggest that GEN and to a lesser extent LD BPA exposure disrupted social behaviors in California mice at 180 days of age, as evidenced by the frequency and duration these individuals spent investigating a novel individual in the three-chambered social tests. These findings fully support our previous reports that suggested developmental exposure to GEN caused California mice to be less social at weaning (30 days of age) (26)and at 90 days of age (Kaur et al., Submitted). The collective studies thus suggest that developmental exposure to GEN may lead to permanent disruptions in social behaviors in this typically social species. The fact that disturbances in social behaviors manifested in LD BPA individuals only at 180 days of age suggests that they may exhibit normal social behaviors early in adulthood but the imprint of development exposure to this EDC can lead to later DOHaD effects in terms of this behavioral pattern.
The fact that California mice developmentally exposed to GEN showed reduced conspecific social interactions with Stranger 1 and Stranger 2 mice in Trial 3 of the social testing may further suggest that they have impairments in social preference. A previous study showed that a mixture of six polychlorinated biphenyls (PCBs) led to dose- and sex-dependent differences on social preference (74). Young adult and middle-aged males exposed to 10 ng/kg of this mixture showing significant preference for social novelty, as evidenced by increased time engaging and sniffing a novel individual (74). In contrast, young adult females exposed to 1000 ng/kg of this PCB mixture spent less time investigating and sniffing a familiar individual but more frequently sniffed novel strangers.
Vocalization behaviors of California mice at 180 days of age were also affected by BPA and GEN exposure. Those exposed to UD BPA elicited increased number of calls and number of calls in a burst than AIN controls. California mice exposed to LD BPA and GEN showed reduced call and burst duration at 180 days of age. When tested at weaning, GEN exposed individuals took longer to produce their first call when placed in isolation (26). By 90 days of age, GEN but not BPA exposed individuals had greater number of calls than AIN controls (Kaur et al., Submitted). The collective socio-communication data suggest that by 180 days of age, the behavioral patterns of LD BPA and GEN exposed individuals begins to parallel each other. The findings also suggest that BPA induces dose-dependent effects on these behavioral traits. As only two doses were tested, it is not clear if such responses can be considered to be non-monotonic (75), but the lower dose of BPA appears to cause greater disruptions in these behaviors. The other conclusion that can be drawn from the three studies is that developmental exposure to GEN disrupts vocalization behaviors in California mice, but the nature of such changes varies throughout the lifespan with those at weaning taking longer to call initially, those at early adulthood eliciting more calls, and by late adulthood, GEN exposed individuals demonstrate reduce duration of calls and bursts.
Other rodent and human studies have examined whether BPA and GEN can affect socio-communication behaviors. Another study showed that maternal BPA exposure of mice increased the duration and median frequency of ultrasonic vocalizations emitted by pups during maternal separation [59]. Male zebrafish (Danio rerio) exposed to BPA showed non-monotonic dose- and circadian-dependent effects on social interactions (76). Similarly, juvenile cynomolgus monkeys (Macaca fascicularis) exposed prenatally to BPA displayed social impairments when tested in the peer-encounter test (77).
In Korean children, pre- and post-natal exposure to BPA is associated with social impairments at years of age, especially in girls (78). However, a Canadian cohort study suggested that prenatal exposure to BPA, as determined by BPA concentrations in the maternal urine at 12 weeks of gestation found that such early exposure disrupted aspects of social deficits by increasing the amount of internalizing and somatizing behaviors in boys but not girls (18). Similar sex-dependent findings were found with another cohort study examining children 6–10 years of age with boys exposed to BPA showing greater social deficits, including increased internalization, externalization, withdrawal, and defiant behaviors (79) Another study though found that increasing amounts of maternal urinary concentrations during pregnancy positively correlated with increased externalization behaviors and conduct problems in girls at 7 years of age and increased internalization behaviors, inattention, and hyperactivity in boys and girls at this age (80). Urinary BPA concentrations and behavioral pattern of children at 9–11 years of age who were part of the INMA Environmental and Children Granada birth cohort revealed that children with values in the 3rd quartile of BPA concentrations showed greater social problems (81). Taken together, the previous animal and human studies provides further support that BPA exposure may induce sex- and dose-dependent effects on socio-communication behaviors. The specific changes may be determined by exposure period, dose of BPA, and offspring sex. These factors may also interact with each other to affect the outcome.
Other reports suggest that early exposure to GEN or phytoestrogens in general can affect later social behaviors. A study with male and female rats found that while BPA did not affect social and activity levels, GEN in a soy-enriched diet suppressed novelty preference and open field exploration in females at PND 24–28 days of age (82). Perinatal exposure of male mice to GEN led to significant changes in anxiety and aggressive behaviors (83). In red colobus monkeys (Procolobus rufomitratus), consumption of plants containing phytoestrogens was strongly associated with increased aggression and copulation rates but reduced time spent grooming (84). Soy infant formula consumption in humans correlates with reduced female-typical play behavior in girls and increased risk of autistic behaviors (11, 12).
Metabolic analysis revealed that LD BPA and UD BPA increased RQ value in the light and dark cycle for female California mice at 180 days of age. In males, only the UD BPA dose increased RQ value at both cycles. An elevated RQ value suggests that the animals were metabolizing carbohydrates rather than fats. Our earlier studied that tested California mice exposed only to the UD BPA at 90 days of age revealed that females but not males showed greater RQ value for both the dark and light cycles (66). The collective results suggest that females are vulnerable to both doses of BPA, whereas elevations in RQ value for male California mice are only evident in late adulthood and only with the UD BPA. In the current and previous study (66), we did not detect any differences in overall fat content based on BPA exposure. This finding though do not preclude that the non-metabolized fat may be accumulating in organs, in particular the liver. Others have reported that BPA exposure can increase hepatic lipid content, otherwise considered hepatic lipidosis, in mice, zebrafish, and humans (85–88).
Changes in the behavioral and possibly the metabolic parameters could be due to BPA/GEN induced effects on the brain. As such, we examined gene expression patterns in two brain regions known to be sensitive to developmental exposure to these EDC, the hypothalamus and hippocampus. In the hypothalamus, only LD BPA exposure altered gene expression patterns with Avp, Esr1, Kiss1, and Lepr elevated, but Oxtr was decreased in this group. On the other hand, both doses of BPA and GEN resulted in gene expression changes in the hippocampus, although they diverged based on treatment and dose in the case of BPA. Avp, Bdnf, and Lepr were elevated in response to UD BPA and GEN. Both doses of BPA and GEN increased Gnrh expression in the hippocampus. GEN increased expression of Dnmt3a and Kiss1 in this brain region. Hippocampal Esr1 expression was increased in the UD BPA group but Esr2 expression in this region was reduced in the LD BPA group.
We have previously used RNA-seq and qPCR analysis to examine gene expression patterns in the hypothalamus of UD BPA exposed and AIN control non-parental and parental California mice, respectively (25, 33). The RNA-seq analysis was performed on hypothalamic samples from weanling California mice. In this study, we found that Kcnd3 was upregulated in BPA and ethinyl estradiol (EE) exposed individuals, whereas Tbl2, Topors, Kif3a, and Phactr2 were upregulated in those exposed to BPA or EE (33). Esr1, Esr2, Kiss1, Lepr were upregulated in the parental California mice expose to the UD BPA (25). While we did not examine hippocampal gene expression patterns in these two studies, we did so in adult Sprague Dawley rats as part of the CLARITY-BPA Consortium Study (27). Avp was increased in the hippocampus of female rats exposed to BPA; whereas, Oxtr was increased in this brain region for male rats exposed to BPA. Thus, our current and past work suggests that depending on the BPA dose, it can increase hippocampal expression of Avp.
Previous studies examining whether prenatal, neonatal, or pubertal exposure to BPA affects Esr1 and Esr2 expression in the hypothalamus, including the anteroventral periventricular nucleus (AVPV), mediobasal portion, and medial preoptic area (MPOA) in rodents and sheep have yielded mixed findings (29, 30, 89–91). The conflicting findings might be due to which Esr1 and Esr2 splice variant forms were detected with the primers used to assay these genes. Age at the time of examination, dose of BPA exposure, offspring sex, reproductive status, and hypothalamic region examined might also affect Esr1/Esr2 expression in the hypothalamus (92).
BPA effects on Kiss1 expression in the hypothalamus have also led to divergent results across studies that could be due to the same reasons as listed for Esr1/Esr2. Rats neonatally treated with BPA also show reduced hypothalamic Kiss1 expression when examined in the prepubertal period (93). A recent study with CD1 mice suggests that prenatal BPA exposure caused increased number of KISS-immunoreactive (ir) neurons in the rostral hypothalamus but reduced the number of KISS-ir neurons in the arcuate nucleus (ARC) (94). Conversely, a single injection of BPA at proestrus enhanced Kiss1 expression in the AVPV of female mice (95).
To our knowledge, this is the first study to examine whether developmental exposure to BPA or GEN affects miR profiles in the brain. Previous studies have shown that BPA can alter miR profiles in the placenta (38, 96), testes (39), and ovary (97). To determine which miR to examine in the hippocampus and hypothalamus, we chose ones to be affected or act upon estrogen signaling pathways in the brain or implicated in neurobehavioral disorders, including ASD (45–48). LD BPA exposed individuals showed increased expression of hypothalamic and hippocampal miR-153 but reduced expression of hypothalamic miR-181a. In contrast, GEN exposed individuals only showed miR changes in the hippocampus with both miR-7a and miR-153 being downregulated. miR-153 is one of the miRs upregulated in the hippocampus after traumatic brain injury and may contribute to subsequent cognitive and memory impairments (98). In human breast cancer cell lines treated with estrogen, miR-153 increases and can as an oncogene by targeting erythroid 2-related factor 2 (NRF2) (99). On the other hand, miR-153 may alleviate autism symptoms by inhibiting activation of the JAK-STAT signaling pathway by targeting LEPR, which results in increased BDNF expression and ensuing proliferation of hippocampal neurons (45). miR181a may be part of a reward neurocircuitry as cocaine, amphetamine and dopamine signaling increase this miR in the hippocampus (100). Other findings suggest that neural expression of miR-181a promotes differentiation of dopaminergic neurons (101). Both miR-153 and miR-181 are predicted to target members of the Notch pathway, cell cycle progression, and self-renewal (101). The net effects of these miR on neurobehavioral patterns are presumably influenced by the collection of miRs are up- or down-regulated at key developmental windows. The fact that changes are observed in miR in adult California mice developmentally exposed to a LD BPA suggests that exposure to this EDC may lead to permanent effects on the epigenome. It is also interesting to note that while BPA is considered a weak estrogen in the case of hippocampal expression of miR-153, LD BPA and GEN exposure resulted in opposite effects with this miR increased in the former but decreased in the latter. The finding thus suggests that different xenoestrogens can result in opposite effects, likely due to which ESR they engage, dosage, and possibly that BPA may act through other steroid and non-steroid receptor pathways.
The mixOmics results suggest that hypothalamic expression of various mRNA are associated with socio-communication behaviors. One of the most notable association was that LD BPA-induced elevation of hypothalamic Esr1 and Kiss1 negatively associated with frequency of interaction LD BPA females engaged with a stranger mouse in social testing. It would be of interest to overexpress one or both of these genes to see if similar social deficits occur in such transgenic mice. Expression of miR-153 and miR-181a are also directly associated with changes in socio-communication behaviors. For instance, mean burst duration, which was reduced LD BPA individuals, was inversely associated with hippocampal expression of miR-153 in LD BPA males. Data thus suggest that LD BPA-induced elevations in miR-153 may alter vocalization patterns. However, this possibility remains to be tested.
While we assessed select metabolic outcomes in this study, we did not perform a comprehensive analysis of how BPA and GEN affect body weight gain from the neonatal to the adult period. Such will be the subject of work in future studies, along whether these chemicals induce direct metabolic effects on the dam. Further work will also perform a comprehensive assessment as to the global miRs changed by developmental exposure to BPA or GEN and whether these chemicals alter corresponding proteins encoded by the mRNAs examined in the current studies. Based on these findings, we can then perform gene knockout and overexpression approaches to establish potential causation in expression of select miRs or mRNAs and later neurobehavioral deficits.
In conclusion, the findings reveal that BPA exposure can result in dose-dependent affect with the LD tested in the current studies compromising social-communication behaviors, hypothalamic mRNA gene expression patterns, and miR profiles in the hippocampus and hypothalamus to a greater extent than the UD BPA tested. However, the UD BPA resulted in greater number of gene expression changes in the hippocampus. The data also suggest that GEN exposure led to similar socio-communication deficits as LD BPA, but gene expression and miR changes in the hypothalamus and hippocampus diverged between these two groups, suggestive that the behavioral impairments detected in these two groups may originate due to different molecular alterations. These data are also the first to show that developmental exposure to BPA or GEN can lead miR changes in the brain when measured at adulthood. Further studies are needed to determine whether these miR changes trace back to fetal life. The integrative correlation analyses reveal that changes in miR patterns, especially miR-153 and miR-181, are linked to alterations in socio-communication behaviors. It remains to be determine whether BPA-induced effects on expression of these biomolecules mediates socio-communication impairments observed in this group. If so, it may provide molecular insight into the actions of BPA on the hippocampus and hypothalamus and thereby suggest potential ways to mitigate these effects. The collective findings reveal cause for concern that developmental exposure of BPA or GEN in monogamous and biparental California mice, and potentially by translation humans, can lead to long standing neurobehavioral consequences.
Supplementary Material
Figure S1. Effects of BPA and GEN exposure on social behaviors separated based on sex. A) Number of times females spent investigating Stranger 1 in Trial 3 of social testing. B) Number of times females spent investigating Stranger 2 in Trial 3 of social testing. C) Duration of time females spent investigating Stranger 1 in Trial 3 of social testing. D) Duration of time females spent investigating Stranger 2 in Trial 3 of social testing. E) Number of times males spent investigating Stranger 1 in Trial 3 of social testing. F) Number of times males spent investigating Stranger 2 in Trial 3 of social testing. G) Duration of time males spent investigating Stranger 1 in Trial 3 of social testing. H) Duration of time males spent investigating Stranger 2 in Trial 3 of social testing.
Figure S3. XYZ beam breaks during the light cycle. LD BPA and GEN exposed individuals had greater number of XYZ beam breaks. N = 12 individuals (males and females combined)/treatment group.
Figure S4. Total energy expenditure during the dark cycle. LD BPA and UD BPA had greater energy expenditure during the dark cycle. N = 12 individuals (males and females combined)/treatment group.
Figure S2. Effects of BPA and GEN on vocalization behaviors separated based on sex. A) Average number of calls for females. B) Average duration of calls for females. C) Average number of calls in a burst for females. D) Average duration of bursts for females. E) Average number of calls for males. F) Average duration of calls for males. G) Average number of calls in a burst for males. H) Average duration of bursts for males. For the LD BPA, especially the males, they elicited none to minimal bursts, which is the reason no to slight bars are evident in these panels.
Figure S5. Hippocampal miR-9 expression based on maternal treatment and sex. LD BPA females had greater expression of miR-9 relative to AIN females. GEN males had lower expression of miR-9 relative to AIN males.
Figure S6. Circos plot correlations for UD BPA exposed females vs. AIN control females. Correlation value was set to 0.85. Red lines in the center indicate a positive correlation (Panel A); whereas blue lines (Panel B) indicate a negative correlation. Lines on the outside of the circle indicate whether the value was greater in controls (blue) or UD BPA (orange).
Figure S7. Circos plot correlations for UD BPA exposed males vs. AIN control females. Correlation value was set to 0.85. Red lines in the center indicate a positive correlation (Panel A); whereas blue lines (Panel B) indicate a negative correlation. Lines on the outside of the circle indicate whether the value was greater in controls (blue) or UD BPA (orange).
ACKNOWLEDGEMENTS
The studies were supported by NIEHS 1R01ES025547 (CSR). We appreciate all of the undergraduate students who assisted with animal husbandry and general care of the California mice colonies.
Footnotes
DATA AVAILABILITY
The data that support the findings of this study are available from the corresponding author upon reasonable request.
References
- 1.Balakrishnan B, Henare K, Thorstensen EB, Ponnampalam AP, Mitchell MD. Transfer of bisphenol A across the human placenta. Am J Obstet Gynecol. 2010; 202(4): 393.e1–7. [DOI] [PubMed] [Google Scholar]
- 2.Takahashi O, Oishi S. Disposition of orally administered 2,2-Bis(4-hydroxyphenyl)propane (Bisphenol A) in pregnant rats and the placental transfer to fetuses. Environ Health Perspect. 2000; 108(10): 931–5. [DOI] [PMC free article] [PubMed] [Google Scholar]
- 3.Balakrishnan B, Thorstensen EB, Ponnampalam AP, Mitchell MD. Transplacental transfer and biotransformation of genistein in human placenta. Placenta. 2010; 31(6): 506–11. [DOI] [PubMed] [Google Scholar]
- 4.Doerge DR. Bioavailability of soy isoflavones through placental/lactational transfer and soy food. Toxicol Appl Pharmacol. 2011; 254(2): 145–7. [DOI] [PubMed] [Google Scholar]
- 5.Doerge DR, Churchwell MI, Chang HC, Newbold RR, Delclos KB. Placental transfer of the soy isoflavone genistein following dietary and gavage administration to Sprague Dawley rats. Reprod Toxicol. 2001; 15(2): 105–10. [DOI] [PubMed] [Google Scholar]
- 6.Todaka E, Sakurai K, Fukata H, Miyagawa H, Uzuki M, Omori M, Osada H, Ikezuki Y, Tsutsumi O, Iguchi T, Mori C. Fetal exposure to phytoestrogens--the difference in phytoestrogen status between mother and fetus. Environ Res. 2005; 99(2): 195–203. [DOI] [PubMed] [Google Scholar]
- 7.Kurebayashi H, Nagatsuka S, Nemoto H, Noguchi H, Ohno Y. Disposition of low doses of 14C-bisphenol A in male, female, pregnant, fetal, and neonatal rats. Arch Toxicol. 2005; 79(5): 243–52. [DOI] [PubMed] [Google Scholar]
- 8.Lee J, Choi K, Park J, Moon HB, Choi G, Lee JJ, Suh E, Kim HJ, Eun SH, Kim GH, Cho GJ, Kim SK, Kim S, Kim SY, Kim S, Eom S, Choi S, Kim YD, Kim S. Bisphenol A distribution in serum, urine, placenta, breast milk, and umbilical cord serum in a birth panel of mother-neonate pairs. Sci Total Environ. 2018; 6261494–501. [DOI] [PubMed] [Google Scholar]
- 9.Nachman RM, Fox SD, Golden WC, Sibinga E, Veenstra TD, Groopman JD, Lees PS. Urinary free bisphenol A and bisphenol A-glucuronide concentrations in newborns. J Pediatrics. 2013; 162(4): 870–2. [DOI] [PMC free article] [PubMed] [Google Scholar]
- 10.Nakao T, Akiyama E, Kakutani H, Mizuno A, Aozasa O, Akai Y, Ohta S. Levels of tetrabromobisphenol A, tribromobisphenol A, dibromobisphenol A, monobromobisphenol A, and bisphenol A in Japanese breast milk. Chem Res Toxicol. 2015; 28(4): 722–8. [DOI] [PubMed] [Google Scholar]
- 11.Adgent MA, Daniels JL, Edwards LJ, Siega-Riz AM, Rogan WJ. Early-life soy exposure and gender-role play behavior in children. Environ Health Perspect. 2011; 119(12): 1811–6. [DOI] [PMC free article] [PubMed] [Google Scholar]
- 12.Westmark CJ. Soy infant formula may be associated with autistic behaviors. Autism. 2013; 3. [DOI] [PMC free article] [PubMed] [Google Scholar]
- 13.Kardas F, Bayram AK, Demirci E, Akin L, Ozmen S, Kendirci M, Canpolat M, Oztop DB, Narin F, Gumus H, Kumandas S, Per H. Increased serum phthalates (MEHP, DEHP) and bisphenol A concentrations in children with Autism spectrum disorder: the role of endocrine disruptors in autism etiopathogenesis. J Child Neurol. 2016; 31(5): 629–35. [DOI] [PubMed] [Google Scholar]
- 14.Rahbar MH, Swingle HM, Christian MA, Hessabi M, Lee M, Pitcher MR, Campbell S, Mitchell A, Krone R, Loveland KA, Patterson DG Jr. Environmental exposure to dioxins, dibenzofurans, bisphenol A, and phthalates in children with and without autism spectrum disorder living near the Gulf of Mexico. Int J Environ Res Public Health. 2017; 14(11). [DOI] [PMC free article] [PubMed] [Google Scholar]
- 15.Ye BS, Leung AOW, Wong MH. The association of environmental toxicants and autism spectrum disorders in children. Environ Pollut. 2017; 227234–42. [DOI] [PubMed] [Google Scholar]
- 16.Braun JM, Bellinger DC, Hauser R, Wright RO, Chen A, Calafat AM, Yolton K, Lanphear BP. Prenatal phthalate, triclosan, and bisphenol A exposures and child visual-spatial abilities. Neurotoxicology. 2017; 5875–83. [DOI] [PMC free article] [PubMed] [Google Scholar]
- 17.Braun JM, Kalkbrenner AE, Calafat AM, Yolton K, Ye X, Dietrich KN, Lanphear BP. Impact of early-life bisphenol A exposure on behavior and executive function in children. Pediatrics. 2011; 128(5): 873–82. [DOI] [PMC free article] [PubMed] [Google Scholar]
- 18.Braun JM, Muckle G, Arbuckle T, Bouchard MF, Fraser WD, Ouellet E, Seguin JR, Oulhote Y, Webster GM, Lanphear BP. Associations of prenatal urinary bisphenol A concentrations with child behaviors and cognitive abilities. Environ Health Perspect. 2017; 125(6): 067008. [DOI] [PMC free article] [PubMed] [Google Scholar]
- 19.Braun JM, Yolton K, Dietrich KN, Hornung R, Ye X, Calafat AM, Lanphear BP. Prenatal bisphenol A exposure and early childhood behavior. Environ Health Perspect. 2009; 117(12): 1945–52. [DOI] [PMC free article] [PubMed] [Google Scholar]
- 20.Galea LA, Kavaliers M, Ossenkopp KP. Sexually dimorphic spatial learning in meadow voles Microtus pennsylvanicus and deer mice Peromyscus maniculatus. J Exp Biol. 1996; 199(Pt 1): 195–200. [DOI] [PubMed] [Google Scholar]
- 21.Jasarevic E, Sieli PT, Twellman EE, Welsh TH Jr., Schachtman TR, Roberts RM, Geary DC, Rosenfeld CS. Disruption of adult expression of sexually selected traits by developmental exposure to bisphenol A. Proc Natl Acad Sci U S A. 2011; 108(28): 11715–20. [DOI] [PMC free article] [PubMed] [Google Scholar]
- 22.Jasarevic E, Williams SA, Vandas GM, Ellersieck MR, Liao C, Kannan K, Roberts RM, Geary DC, Rosenfeld CS. Sex and dose-dependent effects of developmental exposure to bisphenol A on anxiety and spatial learning in deer mice (Peromyscus maniculatus bairdii) offspring. Horm Behav. 2013; 63(1): 180–9. [DOI] [PMC free article] [PubMed] [Google Scholar]
- 23.Williams SA, Jasarevic E, Vandas GM, Warzak DA, Geary DC, Ellersieck MR, Roberts RM, Rosenfeld CS. Effects of developmental bisphenol A exposure on reproductive-related behaviors in California mice (Peromyscus californicus): a monogamous animal model. PloS One. 2013; 8(2): e55698. [DOI] [PMC free article] [PubMed] [Google Scholar]
- 24.Johnson SA, Javurek AB, Painter MS, Peritore MP, Ellersieck MR, Roberts RM, Rosenfeld CS. Disruption of parenting behaviors in california mice, a monogamous rodent species, by endocrine disrupting chemicals. PloS One. 2015; 10(6): e0126284. [DOI] [PMC free article] [PubMed] [Google Scholar]
- 25.Johnson SA, Ellersieck MR, Rosenfeld CS. Hypothalamic gene expression changes in F1 California mice (Peromyscus californicus) parents developmentally exposed to bisphenol A or ethinyl estradiol. Heliyon. 2018; 4(6): e00672. [DOI] [PMC free article] [PubMed] [Google Scholar]
- 26.Marshall BL, Liu Y, Farrington MJ, Mao J, Helferich W, Schenk AK, Bivens NJ, Sarma SJ, Lei Z, Sumner LW, Joshi T, Rosenfeld CS. Early genistein exposure of California mice and gut microbiota-brain axis effects. J Endocrinol. 2019; 242(2):139–157. [DOI] [PMC free article] [PubMed] [Google Scholar]
- 27.Cheong A, Johnson SA, Howald EC, Ellersieck MR, Camacho L, Lewis SM, Vanlandingham MM, Ying J, Ho SM, Rosenfeld CS. Gene expression and DNA nethylation changes in the hypothalamus and hippocampus of adult rats developmentally exposed to bisphenol A or ethinyl estradiol: A CLARITY-BPA Consortium Study. Epigenetics. 2018; 13(7): 704–20. [DOI] [PMC free article] [PubMed] [Google Scholar]
- 28.Chen F, Zhou L, Bai Y, Zhou R, Chen L. Sex differences in the adult HPA axis and affective behaviors are altered by perinatal exposure to a low dose of bisphenol A. Brain research. 2014; 157112–24. [DOI] [PubMed] [Google Scholar]
- 29.Kundakovic M, Gudsnuk K, Franks B, Madrid J, Miller RL, Perera FP, Champagne FA. Sex-specific epigenetic disruption and behavioral changes following low-dose in utero bisphenol A exposure. Proc Natl Acad Sci U S A. 2013; 110(24): 9956–61. [DOI] [PMC free article] [PubMed] [Google Scholar]
- 30.Ceccarelli I, Della Seta D, Fiorenzani P, Farabollini F, Aloisi AM. Estrogenic chemicals at puberty change ERalpha in the hypothalamus of male and female rats. Neurotoxicol Teratol. 2007; 29(1): 108–15. [DOI] [PubMed] [Google Scholar]
- 31.Fukushima A, Funabashi T, Kawaguchi M, Mitsushima D, Kimura F. Bisphenol A induces transforming growth factor-beta3 mRNA in the preoptic area: a cDNA expression array and Northern blot study. Neurosci Lett. 2007; 411(1): 81–5. [DOI] [PubMed] [Google Scholar]
- 32.Wolstenholme JT, Taylor JA, Shetty SR, Edwards M, Connelly JJ, Rissman EF. Gestational exposure to low dose bisphenol A alters social behavior in juvenile mice. PLoS One. 2011; 6(9): e25448. [DOI] [PMC free article] [PubMed] [Google Scholar]
- 33.Johnson SA, Spollen WG, Manshack LK, Bivens NJ, Givan SA, Rosenfeld CS. Hypothalamic transcriptomic alterations in male and female California mice (Peromyscus californicus) developmentally exposed to bisphenol A or ethinyl estradiol. Physiol Rep. 2017; 5(3). [DOI] [PMC free article] [PubMed] [Google Scholar]
- 34.Kundakovic M, Gudsnuk K, Herbstman JB, Tang D, Perera FP, Champagne FA. DNA methylation of BDNF as a biomarker of early-life adversity. Proc Natl Acad Sci U S A. 2015; 112(22): 6807–13. [DOI] [PMC free article] [PubMed] [Google Scholar]
- 35.Mueller JK, Heger S. Endocrine disrupting chemicals affect the gonadotropin releasing hormone neuronal network. Reprod Toxicol. 2014; 4473–84. [DOI] [PubMed] [Google Scholar]
- 36.Zhou L, Xiao X, Zhang Q, Zheng J, Li M, Deng M. A possible mechanism: genistein improves metabolism and induces white fat browning through modulating hypothalamic expression of Ucn3, Depp, and Stc1. Front Endocrinol. 2019; 10478. [DOI] [PMC free article] [PubMed] [Google Scholar]
- 37.Chou WC, Lee PH, Tan YY, Lin HC, Yang CW, Chen KH, Chuang CY. An integrative transcriptomic analysis reveals bisphenol A exposure-induced dysregulation of microRNA expression in human endometrial cells. Toxicol In Vitro. 2017; 41133–42. [DOI] [PubMed] [Google Scholar]
- 38.De Felice B, Manfellotto F, Palumbo A, Troisi J, Zullo F, Di Carlo C, Di Spiezio Sardo A, De Stefano N, Ferbo U, Guida M, Guida M. Genome-wide microRNA expression profiling in placentas from pregnant women exposed to BPA. BMC Med Genomics. 2015; 856. [DOI] [PMC free article] [PubMed] [Google Scholar]
- 39.Gao GZ, Zhao Y, Li HX, Li W. Bisphenol A-elicited miR-146a-5p impairs murine testicular steroidogenesis through negative regulation of Mta3 signaling. Biochem Biophys Res Commun. 2018; 501(2): 478–85. [DOI] [PubMed] [Google Scholar]
- 40.Li Q, Kappil MA, Li A, Dassanayake PS, Darrah TH, Friedman AE, Friedman M, Lambertini L, Landrigan P, Stodgell CJ, Xia Y, Nanes JA, Aagaard KM, Schadt EE, Murray JC, Clark EB, Dole N, Culhane J, Swanson J, Varner M, Moye J, Kasten C, Miller RK, Chen J. Exploring the associations between microRNA expression profiles and environmental pollutants in human placenta from the National Children’s Study (NCS). Epigenetics. 2015; 10(9): 793–802. [DOI] [PMC free article] [PubMed] [Google Scholar]
- 41.Reed BG, Babayev SN, Chen LX, Carr BR, Word RA, Jimenez PT. Estrogen-regulated miRNA-27b is altered by bisphenol A in endometrial stromal cells. Reproduction. 2018; 156(6):559–67. [DOI] [PMC free article] [PubMed] [Google Scholar]
- 42.Verbanck M, Canouil M, Leloire A, Dhennin V, Coumoul X, Yengo L, Froguel P, Poulain-Godefroy O. Low-dose exposure to bisphenols A, F and S of human primary adipocyte impacts coding and non-coding RNA profiles. PLoS One. 2017; 12(6): e0179583. [DOI] [PMC free article] [PubMed] [Google Scholar]
- 43.Van Wynsberghe PM, Chan SP, Slack FJ, Pasquinelli AE. Analysis of microRNA expression and function. Methods Cell Biol. 2011; 106219–52. [DOI] [PMC free article] [PubMed] [Google Scholar]
- 44.Moreno-Moya JM, Vilella F, Simon C. MicroRNA: key gene expression regulators. Fertil Steril. 2014; 101(6): 1516–23. [DOI] [PubMed] [Google Scholar]
- 45.You YH, Qin ZQ, Zhang HL, Yuan ZH, Yu X. MicroRNA-153 promotes brain-derived neurotrophic factor and hippocampal neuron proliferation to alleviate autism symptoms through inhibition of JAK-STAT pathway by LEPR. Biosci Rep. 2019; 39(6); pii: BSR20181904. [DOI] [PMC free article] [PubMed] [Google Scholar]
- 46.Stary CM, Xu L, Li L, Sun X, Ouyang YB, Xiong X, Zhao J, Giffard RG. Inhibition of miR-181a protects female mice from transient focal cerebral ischemia by targeting astrocyte estrogen receptor-alpha. Mol Cell Neurosci. 2017; 82118–25. [DOI] [PMC free article] [PubMed] [Google Scholar]
- 47.Rao YS, Mott NN, Wang Y, Chung WC, Pak TR. MicroRNAs in the aging female brain: a putative mechanism for age-specific estrogen effects. Endocrinology. 2013; 154(8): 2795–806. [DOI] [PMC free article] [PubMed] [Google Scholar]
- 48.Rao YS, Shults CL, Pinceti E, Pak TR. Prolonged ovarian hormone deprivation alters the effects of 17beta-estradiol on microRNA expression in the aged female rat hypothalamus. Oncotarget. 2015; 6(35): 36965–83. [DOI] [PMC free article] [PubMed] [Google Scholar]
- 49.Sieli PT, Jasarevic E, Warzak DA, Mao J, Ellersieck MR, Liao C, Kannan K, Collet SH, Toutain PL, Vom Saal FS, Rosenfeld CS. Comparison of serum bisphenol A concentrations in mice exposed to bisphenol A through the diet versus oral bolus exposure. Environ Health Perspect. 2011; 119(9): 1260–5. [DOI] [PMC free article] [PubMed] [Google Scholar]
- 50.Padmanabhan V, Siefert K, Ransom S, Johnson T, Pinkerton J, Anderson L, Tao L, Kannan K. Maternal bisphenol-A levels at delivery: a looming problem? J Perinatol. 2008; 28(4): 258–63. [DOI] [PMC free article] [PubMed] [Google Scholar]
- 51.Teeguarden JG, Calafat AM, Ye X, Doerge DR, Churchwell MI, Gunawan R, Graham MK. Twenty-four hour human urine and serum profiles of bisphenol a during high-dietary exposure. Toxicol Sci. 2011; 123(1): 48–57. [DOI] [PubMed] [Google Scholar]
- 52.Vandenberg LN, Chahoud I, Heindel JJ, Padmanabhan V, Paumgartten FJ, Schoenfelder G. Urinary, circulating, and tissue biomonitoring studies indicate widespread exposure to bisphenol A. Environ Health Perspect. 2010; 118(8): 1055–70. [DOI] [PMC free article] [PubMed] [Google Scholar]
- 53.Vandenberg LN, Hauser R, Marcus M, Olea N, Welshons WV. Human exposure to bisphenol A (BPA). Reprod Toxicol. 2007; 24(2): 139–77. [DOI] [PubMed] [Google Scholar]
- 54.Rice D, Barone S Jr. Critical periods of vulnerability for the developing nervous system: evidence from humans and animal models. Environ Health Perspect. 2000; 108 Suppl 3511–33. [DOI] [PMC free article] [PubMed] [Google Scholar]
- 55.Howdeshell KL. A model of the development of the brain as a construct of the thyroid system. Environ Health Perspect. 2002; 110 Suppl 3337–48. [DOI] [PMC free article] [PubMed] [Google Scholar]
- 56.Dolinoy DC. Maternal genistein alters coat color and protects Avy mouse offsping from obesity by modifying the fetal epigenome. Environ Health Perspect. 2006; 114(4): 567–72. [DOI] [PMC free article] [PubMed] [Google Scholar]
- 57.Dolinoy DC, Huang D, Jirtle RL. Maternal nutrient supplementation counteracts bisphenol A-induced DNA hypomethylation in early development. Proc Natl Acad Sci U S A. 2007; 104(32): 13056–61. [DOI] [PMC free article] [PubMed] [Google Scholar]
- 58.Rosenfeld CS, Sieli PT, Warzak DA, Ellersieck MR, Pennington KA, Roberts RM. Maternal exposure to bisphenol A and genistein has minimal effect on A(vy)/a offspring coat color but favors birth of agouti over nonagouti mice. Proc Natl Acad Sci U S A. 2013; 110(2): 537–42. [DOI] [PMC free article] [PubMed] [Google Scholar]
- 59.Fritz WA, Wang J, Eltoum IE, Lamartiniere CA. Dietary genistein down-regulates androgen and estrogen receptor expression in the rat prostate. Mol Cell Endocrinol. 2002; 186(1): 89–99. [DOI] [PubMed] [Google Scholar]
- 60.Harris EP, Allardice HA, Schenk AK, Rissman EF. Effects of maternal or paternal bisphenol A exposure on offspring behavior. Horm Behav. 2018; 10168–76. [DOI] [PMC free article] [PubMed] [Google Scholar]
- 61.Wolstenholme JT, Edwards M, Shetty SR, Gatewood JD, Taylor JA, Rissman EF, Connelly JJ. Gestational exposure to bisphenol A produces transgenerational changes in behaviors and gene expression. Endocrinology. 2012; 153(8): 3828–38. [DOI] [PMC free article] [PubMed] [Google Scholar]
- 62.Wolstenholme JT, Goldsby JA, Rissman EF. Transgenerational effects of prenatal bisphenol A on social recognition. Horm Behav. 2013; 64(5): 833–9. [DOI] [PMC free article] [PubMed] [Google Scholar]
- 63.Moy SS, Nadler JJ, Perez A, Barbaro RP, Johns JM, Magnuson TR, Piven J, Crawley JN. Sociability and preference for social novelty in five inbred strains: an approach to assess autistic-like behavior in mice. Genes, Brain, and Behavior. 2004; 3(5): 287–302. [DOI] [PubMed] [Google Scholar]
- 64.Johnson SA, Farrington MJ, Murphy CR, Caldo PD, McAllister LA, Kaur S, Chun C, Ortega MT, Marshall BL, Hoffmann F, Ellersieck MR, Schenk AK, Rosenfeld CS. Multigenerational effects of bisphenol A or ethinyl estradiol exposure on F2 California mice (Peromyscus californicus) pup vocalizations. PLoS One. 2018; 13(6): e0199107. [DOI] [PMC free article] [PubMed] [Google Scholar]
- 65.Johnson SA, Painter MS, Javurek AB, Murphy CR, Howald EC, Khan ZZ, Conard CM, Gant KL, Ellersieck MR, Hoffmann F, Schenk AK, Rosenfeld CS. Characterization of vocalizations emitted in isolation by California mouse (Peromyscus californicus) pups throughout the postnatal period. J Comp Psychol. 2017; 131(1): 30–9. [DOI] [PMC free article] [PubMed] [Google Scholar]
- 66.Johnson SA, Painter MS, Javurek AB, Ellersieck MR, Wiedmeyer CE, Thyfault JP, Rosenfeld CS. Sex-dependent effects of developmental exposure to bisphenol A and ethinyl estradiol on metabolic parameters and voluntary physical activity. J Dev Orig Health Dis. 2015; 6(6): 539–52. [DOI] [PMC free article] [PubMed] [Google Scholar]
- 67.Johnson SA, Javurek AB, Painter MS, Murphy CR, Conard CM, Gant KL, Howald EC, Ellersieck MR, Wiedmeyer CE, Vieira-Potter VJ, Rosenfeld CS. Effects of a maternal high-fat diet on offspring behavioral and metabolic parameters in a rodent model. J Dev Orig Health Dis. 2017; 8(1): 75–88. [DOI] [PubMed] [Google Scholar]
- 68.Wright EC, Johnson SA, Hao R, Kowalczyk AS, Greenberg GD, Ordones Sanchez E, Laman-Maharg A, Trainor BC, Rosenfeld CS. Exposure to extrinsic stressors, social defeat or bisphenol A, eliminates sex differences in DNA methyltransferase expression in the amygdala. J Neuroendocrinol. 2017; 29(6). [DOI] [PMC free article] [PubMed] [Google Scholar]
- 69.Rohart F, Gautier B, Singh A, Le Cao K-A. mixOmics: An R package for ‘omics feature selection and multiple data integration. PLoS Comput Biol. 2017; 13(11): e1005752. [DOI] [PMC free article] [PubMed] [Google Scholar]
- 70.González I, Lê Cao K-A, Davis MJ, Déjean S. Visualising associations between paired ‘omics’ data sets. BioData Mining. 2012; 5(1): 19. [DOI] [PMC free article] [PubMed] [Google Scholar]
- 71.Steel RG. Principles and procedures of statistics: A biometrical approach McGraw-Hill Higher Education, 1997. [Google Scholar]
- 72.Chew V, United S. Comparisons among treatment means in an analysis of variance [Washington]: Dept. of Agriculture, Agricultural Research Service, 1977. [Google Scholar]
- 73.Saville DJ. Multiple Comparison Procedures: The practical solution. Am Statistician. 1990; 44(2): 174–80. [Google Scholar]
- 74.Karkaba A, Soualeh N, Soulimani R, Bouayed J. Perinatal effects of exposure to PCBs on social preferences in young adult and middle-aged offspring mice. Horm Behav. 2017; 96137–46. [DOI] [PubMed] [Google Scholar]
- 75.Vandenberg LN. Non-monotonic dose responses in studies of endocrine disrupting chemicals: bisphenol A as a case study. Dose Resp. 2014; 12(2): 259–76. [DOI] [PMC free article] [PubMed] [Google Scholar]
- 76.Weber DN, Hoffmann RG, Hoke ES, Tanguay RL. Bisphenol A exposure during early development induces sex-specific changes in adult zebrafish social interactions. J Toxicol Environ Health A. 2015; 78(1): 50–66. [DOI] [PMC free article] [PubMed] [Google Scholar]
- 77.Negishi T, Nakagami A, Kawasaki K, Nishida Y, Ihara T, Kuroda Y, Tashiro T, Koyama T, Yoshikawa Y. Altered social interactions in male juvenile cynomolgus monkeys prenatally exposed to bisphenol A. Neurotoxicol Teratol. 2014; 4446–52. [DOI] [PubMed] [Google Scholar]
- 78.Lim YH, Bae S, Kim BN, Shin CH, Lee YA, Kim JI, Hong YC. Prenatal and postnatal bisphenol A exposure and social impairment in 4-year-old children. Environ Health. 2017; 16(1): 79. [DOI] [PMC free article] [PubMed] [Google Scholar]
- 79.Evans SF, Kobrosly RW, Barrett ES, Thurston SW, Calafat AM, Weiss B, Stahlhut R, Yolton K, Swan SH. Prenatal bisphenol A exposure and maternally reported behavior in boys and girls. Neurotoxicology. 2014; 4591–9. [DOI] [PMC free article] [PubMed] [Google Scholar]
- 80.Harley KG, Gunier RB, Kogut K, Johnson C, Bradman A, Calafat AM, Eskenazi B. Prenatal and early childhood bisphenol A concentrations and behavior in school-aged children. Environ Res. 2013; 12643–50. [DOI] [PMC free article] [PubMed] [Google Scholar]
- 81.Perez-Lobato R, Mustieles V, Calvente I, Jimenez-Diaz I, Ramos R, Caballero-Casero N, Lopez-Jimenez FJ, Rubio S, Olea N, Fernandez MF. Exposure to bisphenol A and behavior in school-age children. Neurotoxicology. 2016; 5312–9. [DOI] [PubMed] [Google Scholar]
- 82.Hicks KD, Sullivan AW, Cao J, Sluzas E, Rebuli M, Patisaul HB. Interaction of bisphenol A (BPA) and soy phytoestrogens on sexually dimorphic sociosexual behaviors in male and female rats. Horm Behav. 2016; 84121–6. [DOI] [PMC free article] [PubMed] [Google Scholar]
- 83.Rodriguez-Gomez A, Filice F, Gotti S, Panzica G. Perinatal exposure to genistein affects the normal development of anxiety and aggressive behaviors and nitric oxide system in CD1 male mice. Physiol Behav. 2014; 133107–14. [DOI] [PubMed] [Google Scholar]
- 84.Wasserman MD, Chapman CA, Milton K, Gogarten JF, Wittwer DJ, Ziegler TE. Estrogenic plant consumption predicts red colobus monkey (Procolobus rufomitratus) hormonal state and behavior. Horm Behav. 2012; 62(5): 553–62. [DOI] [PMC free article] [PubMed] [Google Scholar]
- 85.Shimpi PC, More VR, Paranjpe M, Donepudi AC, Goodrich JM, Dolinoy DC, Rubin B, Slitt AL. Hepatic lipid accumulation and Nrf2 expression following perinatal and peripubertal exposure to bisphenol A in a mouse model of nonalcoholic liver disease. Environ Health Perspect. 2017; 125(8): 087005. [DOI] [PMC free article] [PubMed] [Google Scholar]
- 86.Sun SX, Zhang YN, Lu DL, Wang WL, Limbu SM, Chen LQ, Zhang ML, Du ZY. Concentration-dependent effects of 17beta-estradiol and bisphenol A on lipid deposition, inflammation and antioxidant response in male zebrafish (Danio rerio). Chemosphere. 2019; 237124422. [DOI] [PubMed] [Google Scholar]
- 87.Martella A, Silvestri C, Maradonna F, Gioacchini G, Allara M, Radaelli G, Overby DR, Di Marzo V, Carnevali O. Bisphenol A induces fatty liver by an endocannabinoid-mediated positive feedback loop. Endocrinology. 2016; 157(5): 1751–63. [DOI] [PMC free article] [PubMed] [Google Scholar]
- 88.Verstraete SG, Wojcicki JM, Perito ER, Rosenthal P. Bisphenol a increases risk for presumed non-alcoholic fatty liver disease in Hispanic adolescents in NHANES 2003–2010. Environ Health. 2018; 17(1): 12. [DOI] [PMC free article] [PubMed] [Google Scholar]
- 89.Mahoney MM, Padmanabhan V. Developmental programming: impact of fetal exposure to endocrine-disrupting chemicals on gonadotropin-releasing hormone and estrogen receptor mRNA in sheep hypothalamus. Toxicol Appl Pharmacol. 2010; 247(2): 98–104. [DOI] [PMC free article] [PubMed] [Google Scholar]
- 90.Monje L, Varayoud J, Luque EH, Ramos JG. Neonatal exposure to bisphenol A modifies the abundance of estrogen receptor alpha transcripts with alternative 5’-untranslated regions in the female rat preoptic area. J Endocrinol. 2007; 194(1): 201–12. [DOI] [PubMed] [Google Scholar]
- 91.Yu CJ, Fang QQ, Tai FD. Pubertal BPA exposure changes central ERalpha levels in female mice. Environ Toxicol Pharmacol. 2015; 40(2): 606–14. [DOI] [PubMed] [Google Scholar]
- 92.Yu B, Chen QF, Liu ZP, Xu HF, Zhang XP, Xiang Q, Zhang WZ, Cui WM, Zhang X, Li N. Estrogen receptor alpha and beta expressions in hypothalamus-pituitary-ovary axis in rats exposed lactationally to soy isoflavones and bisphenol A. Biomed Environ Sci. 2010; 23(5): 357–62. [DOI] [PubMed] [Google Scholar]
- 93.Navarro VM, Sanchez-Garrido MA, Castellano JM, Roa J, Garcia-Galiano D, Pineda R, Aguilar E, Pinilla L, Tena-Sempere M. Persistent impairment of hypothalamic KiSS-1 system after exposures to estrogenic compounds at critical periods of brain sex differentiation. Endocrinology. 2009; 150(5): 2359–67. [DOI] [PubMed] [Google Scholar]
- 94.Ruiz-Pino F, Miceli D, Franssen D, Vazquez MJ, Farinetti A, Castellano JM, Panzica G, Tena-Sempere M. Environmentally relevant perinatal exposures to bisphenol A disrupt postnatal Kiss1/NKB neuronal maturation and puberty onset in female mice. Environ Health Perspect. 2019; 127(10): 107011. [DOI] [PMC free article] [PubMed] [Google Scholar]
- 95.Wang X, Chang F, Bai Y, Chen F, Zhang J, Chen L. Bisphenol A enhances kisspeptin neurons in anteroventral periventricular nucleus of female mice. J Endocrinol. 2014; 221(2): 201–13. [DOI] [PubMed] [Google Scholar]
- 96.Avissar-Whiting M, Veiga KR, Uhl KM, Maccani MA, Gagne LA, Moen EL, Marsit CJ. Bisphenol A exposure leads to specific microRNA alterations in placental cells. Reprod Toxicol. 2010; 29(4): 401–6. [DOI] [PMC free article] [PubMed] [Google Scholar]
- 97.Veiga-Lopez A, Luense LJ, Christenson LK, Padmanabhan V. Developmental programming: gestational bisphenol-A treatment alters trajectory of fetal ovarian gene expression. Endocrinology. 2013; 154(5): 1873–84. [DOI] [PMC free article] [PubMed] [Google Scholar]
- 98.Liu L, Sun T, Liu Z, Chen X, Zhao L, Qu G, Li Q. Traumatic brain injury dysregulates microRNAs to modulate cell signaling in rat hippocampus. PLoS One. 2014; 9(8): e103948. [DOI] [PMC free article] [PubMed] [Google Scholar]
- 99.Wang B, Teng Y, Liu Q. MicroRNA-153 regulates NRF2 expression and is associated with breast carcinogenesis. Clin Lab. 2016; 62(1–2): 39–47. [DOI] [PubMed] [Google Scholar]
- 100.Saba R, Storchel PH, Aksoy-Aksel A, Kepura F, Lippi G, Plant TD, Schratt GM. Dopamine-regulated microRNA MiR-181a controls GluA2 surface expression in hippocampal neurons. Mol Cell Biol. 2012; 32(3): 619–32. [DOI] [PMC free article] [PubMed] [Google Scholar]
- 101.Stappert L, Borghese L, Roese-Koerner B, Weinhold S, Koch P, Terstegge S, Uhrberg M, Wernet P, Brustle O. MicroRNA-based promotion of human neuronal differentiation and subtype specification. PLoS One. 2013; 8(3): e59011. [DOI] [PMC free article] [PubMed] [Google Scholar]
Associated Data
This section collects any data citations, data availability statements, or supplementary materials included in this article.
Supplementary Materials
Figure S1. Effects of BPA and GEN exposure on social behaviors separated based on sex. A) Number of times females spent investigating Stranger 1 in Trial 3 of social testing. B) Number of times females spent investigating Stranger 2 in Trial 3 of social testing. C) Duration of time females spent investigating Stranger 1 in Trial 3 of social testing. D) Duration of time females spent investigating Stranger 2 in Trial 3 of social testing. E) Number of times males spent investigating Stranger 1 in Trial 3 of social testing. F) Number of times males spent investigating Stranger 2 in Trial 3 of social testing. G) Duration of time males spent investigating Stranger 1 in Trial 3 of social testing. H) Duration of time males spent investigating Stranger 2 in Trial 3 of social testing.
Figure S3. XYZ beam breaks during the light cycle. LD BPA and GEN exposed individuals had greater number of XYZ beam breaks. N = 12 individuals (males and females combined)/treatment group.
Figure S4. Total energy expenditure during the dark cycle. LD BPA and UD BPA had greater energy expenditure during the dark cycle. N = 12 individuals (males and females combined)/treatment group.
Figure S2. Effects of BPA and GEN on vocalization behaviors separated based on sex. A) Average number of calls for females. B) Average duration of calls for females. C) Average number of calls in a burst for females. D) Average duration of bursts for females. E) Average number of calls for males. F) Average duration of calls for males. G) Average number of calls in a burst for males. H) Average duration of bursts for males. For the LD BPA, especially the males, they elicited none to minimal bursts, which is the reason no to slight bars are evident in these panels.
Figure S5. Hippocampal miR-9 expression based on maternal treatment and sex. LD BPA females had greater expression of miR-9 relative to AIN females. GEN males had lower expression of miR-9 relative to AIN males.
Figure S6. Circos plot correlations for UD BPA exposed females vs. AIN control females. Correlation value was set to 0.85. Red lines in the center indicate a positive correlation (Panel A); whereas blue lines (Panel B) indicate a negative correlation. Lines on the outside of the circle indicate whether the value was greater in controls (blue) or UD BPA (orange).
Figure S7. Circos plot correlations for UD BPA exposed males vs. AIN control females. Correlation value was set to 0.85. Red lines in the center indicate a positive correlation (Panel A); whereas blue lines (Panel B) indicate a negative correlation. Lines on the outside of the circle indicate whether the value was greater in controls (blue) or UD BPA (orange).