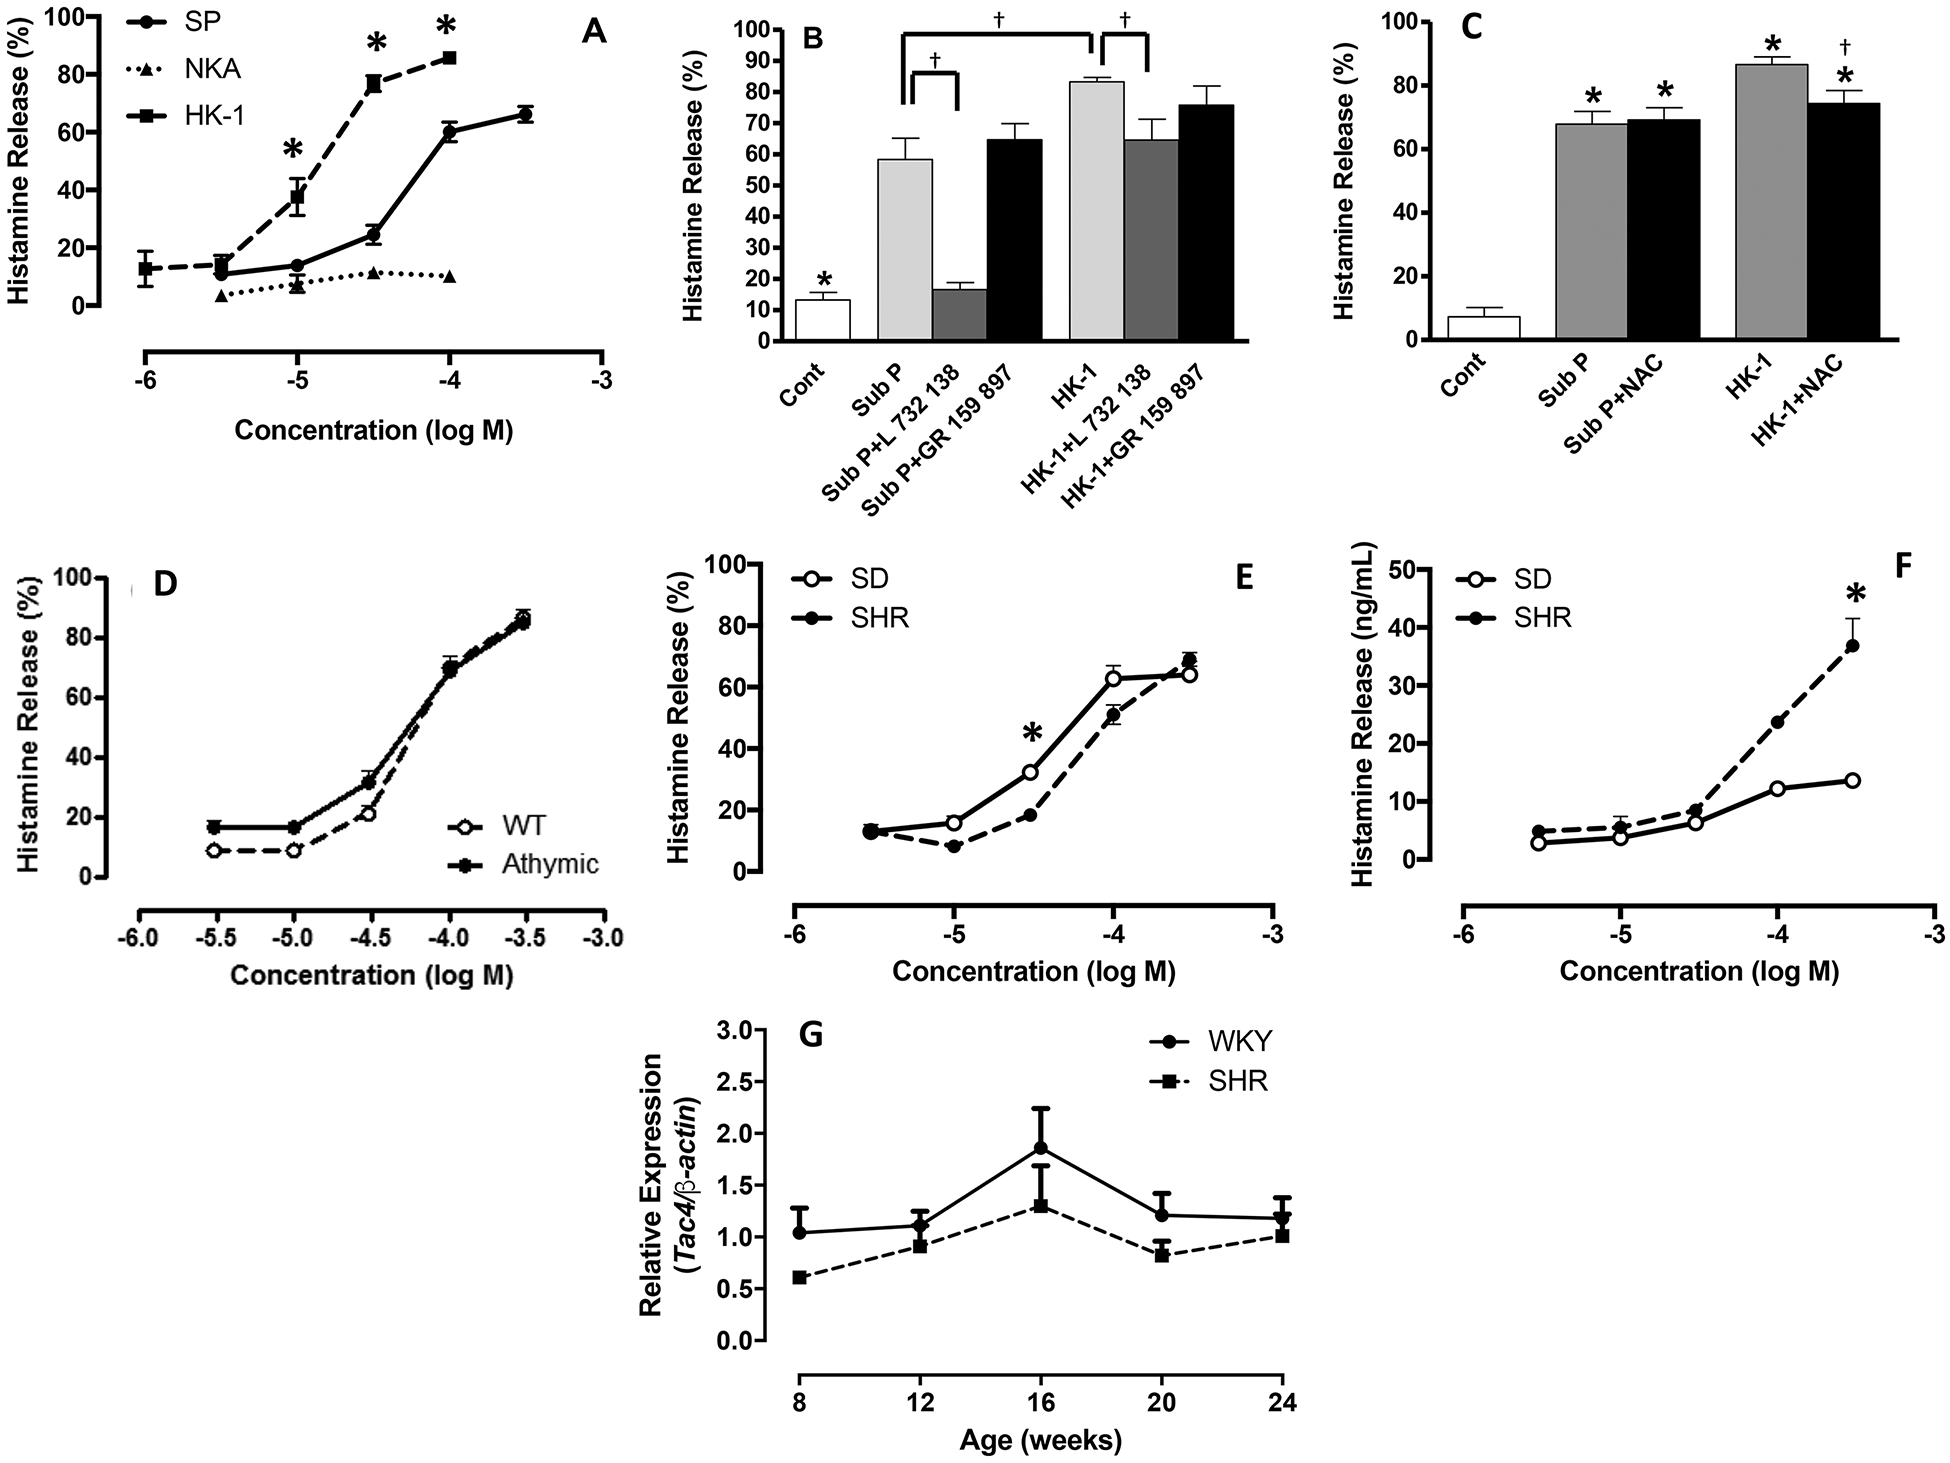
Figure 3. (A).

Concentration-response curves for percentage histamine release from cardiac MCs in response to stimulation with SP, HK-1, and NKA. Values are mean ± SEM. * = p<0.05 compared to substance P; (B) Histamine release from cardiac MCs that were untreated (cont), SP-treated (100 μM), SP-treated (100 μM) pre-incubated with the NK-1R antagonist, L 732 138 (20 μM), SP-treated (100 μM) pre-incubated with the NK-2R antagonist, GR 159 897 (10 μM), HK-1-treated (100 μM), HK-1-treated (100 μM) pre-incubated with L 732 138 (20 μM), and HK-1-treated pre-incubated with the NK-2R antagonist, GR 159 897 (10 μM).Values are mean ± SEM. * = p<0.05 control vs substance P and HK-1, † = p<0.05 compared to substance P and HK-1; (C) Histamine release from cardiac MCs that were untreated (cont), SP-treated (100 μM), SP-treated (100 μM) pre-incubated with the antioxidant, NAC (200 μM), HK-1-treated (100 μM), and HK-1-treated pre-incubated with NAC (200 μM); (D) Concentration-response curves for percentage histamine release from cardiac MCs isolated from wild type (WT, n=4/concentration) and athymic nude rats (n=3/concentration) in response to substance P; (E) Concentration-response curves for percentage histamine release from cardiac MCs isolated from normotensive Sprague-Dawley (SD, n=5/concentration) and spontaneously hypertensive rats (SHR, n=5/concentration). Values are mean ± SEM. * = p<0.05 compared to corresponding concentration; (F) Concentration-response curves for absolute histamine release from cardiac MCs isolated from SD rats (n=5/concentration) and SHR (n=5/concentration); (G) expression levels of Tac4 mRNA from SHR and WKY left ventricles (n=4/time-point). Values are mean ± SEM. * = p<0.05 compared to corresponding concentration.
