

Abstract
Effective population size, a central concept in conservation biology, is now routinely estimated from genetic surveys and can also be theoretically predicted from demographic, life-history, and mating-system data. By evaluating the consistency of theoretical predictions with empirically estimated effective size, insights can be gained regarding life-history characteristics and the relative impact of different life-history traits on genetic drift. These insights can be used to design and inform management strategies aimed at increasing effective population size. We demonstrated this approach by addressing the conservation of a reintroduced population of Asiatic wild ass (Equus hemionus). We estimated the variance effective size (Nev) from genetic data (Nev = 24.3) and formulated predictions for the impacts on Nev of demography, polygyny, female variance in lifetime reproductive success (RS), and heritability of female RS. By contrasting the genetic estimation with theoretical predictions, we found that polygyny was the strongest factor affecting genetic drift because only when accounting for polygyny were predictions consistent with the genetically measured Nev. The comparison of effective-size estimation and predictions indicated that 10.6% of the males mated per generation when heritability of female RS was unaccounted for (polygyny responsible for 81% decrease in Nev) and 19.5% mated when female RS was accounted for (polygyny responsible for 67% decrease in Nev). Heritability of female RS also affected Nev; (heritability responsible for 41% decrease in Nev). The low effective size is of concern, and we suggest that management actions focus on factors identified as strongly affecting Nev, namely, increasing the availability of artificial water sources to increase number of dominant males contributing to the gene pool. This approach, evaluating life-history hypotheses in light of their impact on effective population size, and contrasting predictions with genetic measurements, is a general, applicable strategy that can be used to inform conservation practice.
Keywords: Equus hemionus, heritability, mating system, polygyny, reproductive success, variance effective population size
Resumen:
El tamaño poblacional efectivo, un concepto central en la biología de la conservación, ahora se estima rutinariamente a partir de censos genéticos y también puede ser pronosticado teóricamente a partir de los datos demográficos, de la historia de vida, y del método de apareamiento. Cuando se evalúa la consistencia de las predicciones teóricas junto con el tamaño efectivo estimado empíricamente, puede obtenerse conocimiento con respecto a las características de la historia de vida y al impacto relativo de las diferentes características de la historia de vida sobre la deriva génica. Este conocimiento puede usarse para diseñar e informar las estrategias de manejo enfocadas en el incremento del tamaño poblacional efectivo. Demostramos esta estrategia enfocándonos en la conservación de una población reintroducida de asno asiático salvaje (Equus hemionus). Estimamos la varianza del tamaño efectivo (Nev) a partir de datos genéticos (Nev = 24.3) y formulamos predicciones para los impactos de la demografía, la poliginia, la varianza de hembras en el éxito reproductivo a lo largo de la vida, y la heredabilidad del éxito reproductivo de las hembras sobre Nev. Cuando contrastamos la estimación genética con las predicciones teóricas, encontramos que la poliginia es el factor más importante en afectar a la deriva génica, pues fue sólo cuando se tomó en cuenta a la poliginia que las predicciones fueron consistentes con el Nev medido genéticamente. La comparación entre la estimación del tamaño efectivo y las predicciones indicaron que el 10.6% de los machos por generación se apareó cuando la heredabilidad RS de las hembras no fue justificada (la poliginia es responsable de la disminución del 81% del Nev) y el 19.5% se apareó cuando la RS de las hembras fue justificada (la poliginia es responsable de la disminución del 67% del Nev). La heredabilidad del éxito reproductivo de las hembras también afectó al Nev; (la heredabilidad es responsable de la disminución del 41% del Nev). El tamaño efectivo inferior es para preocuparse, y sugerimos que las acciones de manejo se enfoquen en factores identificados como importantes en afectar al Nev, principalmente el incremento de la disponibilidad de fuentes artificiales para incrementar el número de machos dominantes que contribuyan al pool genético. Esta estrategia, la evaluación de hipótesis de historias de vida a la luz de su impacto sobre el tamaño poblacional efectivo, y el contraste entre las predicciones y las medidas genéticas, es una estrategia general y aplicable que puede usarse para informar a la práctica de la conservación.
Palabras Clave: éxito reproductivo, heredabilidad, método de apareamiento, poliginia, tamaño poblacional, varianza efectiva, Equus hemionus
摘要:
有效种群大小是保护生物学的一个核心概念, 目前常用遗传学数据来估计, 也可以用种群统计学、 生活史和婚配制度的数据进行理论预测。 通过评估有效种群大小的理论预测值和实际估计值之间的一致性, 我们可以更好地理解生物的生活史特性以及不同生活史性状对遗传漂变的相对影响, 这有助于制定增加有效种群大小 的管理策略。我们以亚洲野驴 (Equus hemionus) 一个重引入种群的保护为例来展示这个方法。 我们用遗传学 数据估计了方差有效种群大小 (Nev = 24.3), 并预测了种群统计数据、一 雄多雌制、雌性一生繁殖成功率的变 异’以及雌性繁殖成功率的遗传力对 Nev 的影响。通过对比遗传估计值和理论预测值, 我们发现一雄多雌制是影响遗传漂变最重要的因素, 因为只有当考虑一雄多雌制时预测值才与遗传估计的 Nev、相符。 对有效种群大小的估计值和预测值的比较还表明,当不考虑雌性繁殖成功率的遗传力时,每个世代有10.6% 的雄性参与交配 (81% 的Nev下降是因为一雄多雌制), 而考虑雌性繁殖成功率的遗传力时, 每个世代有 19.5% 的雄性参与交配 (67%的 Nev下降是因为一雄多雌制)。 雌性繁殖成功率的遗传力也直接影响 Nev, (41% 的Nev下降是因为遗 传力)。 有效种群大小较小令人担忧, 我们建议管理措施着重于对 Nev 有强烈影响的因素, 即提高人工水源的可 获得性,以增加对基因库有贡献的优势雄体的数量。 这个方法从影响有效种群大小的角度评估了生活史假说, 并对比了有效种群大小预测值和遗传估计值,是一个可为保护实践提供帮助的普遍可应用的策略。
关键调: 亚洲野驴(Equus hemionus), 遗传力一雄多雌, 婚配制度, 繁殖成功率, 方差有效种群大小
Introduction
Effective population size (Ne) is a fundamental concept in conservation science because it allows quantifying genetic drift in nonideal populations in a comparable manner. Such measures are crucial for monitoring and risk-assessment of small and endangered populations (Schwartz et al. 1998; Luikart et al. 2010; Allendorf et al. 2012). An Ne of a population denotes the size of an ideal population that experiences the same levels of genetic drift with respect to a certain population-genetic measure (Templeton 2006). The concept has been applied in conservation to estimate Ne from genetic data and predict Ne from demographic and life-history data and hypotheses.
Estimation of Ne from genetic data can be done based on a single sample of the population, most commonly by analyzing linkage disequilibrium, or by temporal sampling at 2 sufficiently distant periods (Schwartz et al. 1998; Luikart et al. 2010; Wang et al. 2016). Temporal samples from populations of conservation concern are more difficult to procure because they require genetic monitoring over several generations; however, these methods are considered more precise and more robust to violation of assumptions than estimates derived from a single generation (Leberg 2005; Wang et al. 2016). Predictions based on demographic and life-history data are most often made by evaluating analytic formulations of the deviation from the assumptions of an ideal population, providing predictions of expected effective population sizes for different aspects of genetic drift. For example, fluctuating population size, uneven sex ratios, and uneven distribution of reproductive success (RS) are all violations of the assumptions of idealized populations and can be accounted for in their impact on Ne (Templeton 2006; Wang et al. 2016).
Genetic estimation and theoretical prediction are most often employed separately, either to monitor the level of genetic drift with genetic samples or to provide conservation-relevant predictions based on life-history traits. However, by adopting a strategy that combines the 2 methods, it is possible to gain additional (and important) insights on wild populations—the direct genetic estimation could provide the ground truth through which hypotheses regarding life-history, ecology, and behavior can be evaluated. This strategy can provide an informative account of how different life-history traits affect Ne and genetic drift and improve comprehension of which factors actually matter, in a conservation context, and to what extent. Despite its advantages, a detailed study describing such a combined approach and highlighting its benefits for conservation has not been presented fully.
We developed a method to reveal life-history characteristics of populations and their relative impacts on genetic drift by contrasting genetic estimates with theoretical predictions that are based on demography and life-history traits. We examined how these insights can be used to inform management aimed at increasing Ne and applied our method to management of Asiatic wild ass (Equus hemionus) in the Negev Desert, Israel, a population of conservation concern. This species was once abundant throughout western and central Asia but has largely been extirpated from its native range, including from the Negev desert (Kaczensky et al. 2015). It was successfully reintroduced to the Negev, and genetic samples were collected at 2 periods 3 decades apart, allowing for a relatively accurate estimation of the variance effective population size (Nev) through analysis of the accumulation of changes in allele frequencies due to genetic drift (Nei & Tajima 1981; Wang 2005; Wang et al. 2016).
The Negev population of wild ass exhibits fission-fusion social structure (Rubenstein 1994; Saltz et al. 2000); thus, unlike the harem polygyny of several other equids, females are not constrained to mate with the same dominant male in consecutive breeding seasons. The females form unstable groups that split and join on occasion, bachelor males form small groups, and the dominant males remain solitary and defend territories. Using genetic and behavioral data, it was determined that the population is highly polygynous; < 25% of the males mate in each generation (Renan et al. 2015). Polygyny at this level is expected to increase genetic drift and decrease Ne, but other life-history traits may play an important role as well, particularly the variance in RS of females (Nunney 1996). Moreover, although rarely demonstrated in wild populations, heritability of RS, either genetically or through social inheritance, may also significantly affect genetic drift; therefore, its impact on genetic drift should be considered (Robertson 1961; Nei & Murata 1966).
To demonstrate the applicability of our suggested approach and improve understanding of genetic drift in the wild ass population, we compared genetically estimated Nev with several different theoretical predictions of Nev, each corresponding to a plausible hypothesis regarding life-history and mating-system characteristics. The genetic data were obtained from blood, tissue, and fecal samples from 2 periods for the Nev estimation, and life-history predictions were based on observations from a long-term monitoring project. Contrasting Ne predictions with empirically estimated Ne allowed us to gain insights into the life-history of the population and its impact on genetic drift and to examine implications for conservation and management. This strategy is applicable in a wide range of conservation scenarios for which genetic information is available because the theoretical predictions and hypotheses can be tailored to the issues relevant to each case.
Methods
From 1982 to 1987, 28 wild asses were introduced from a captive population into the Negev; 10 more were released from 1992 to 1993. The population was intensively monitored during reintroduction (Saltz & Rubenstein 1995; Saltz et al. 2000, 2006). In 2012, 4 generations after its reintroduction (Asiatic wild ass generation length approximately 7.4 years [Saltz & Rubenstein 1995]), a noninvasive genetic survey was conducted to evaluate the genetic composition of the current population (Renan et al. 2015).
To determine how different life-history characteristics affect genetic drift in this population, we compared and contrasted different hypotheses regarding demography, life-history, and mating system with genetic measurements. First, we formulated predictions of Nev based on the known life-history and social structure of the population. Specifically, we considered the effects of demography, polygyny, and female variance and heritability of RS (parameter summary given in Table 1). We based the formulations and their parameterization on previous studies and detailed monitoring records. Second, we estimated Nev from genetic data. Finally, we compared the predictions with the genetic measurements and determined whether our Nev predictions coincided with the genetically measured Nev.
Table 1.
Parameters and notations used to compare genetic estimations and predictions of effective population size in Asiatic wild ass.
| Parameter notation | Definition | Evaluation |
|---|---|---|
| Nev | variance effective population size | |
| Nef | inbreeding effective population size | |
| Nm, Nf | census number of males and females, respectively | evaluated from demographic data (Table 2) |
| Nd | per-generation demographic (census) variance effective population size | evaluated from demographic data (Table 2) |
| overall (multigenerational) demographic variance effective population size | ||
| p0 | proportion of mating males in the population | |
| Np | per-generation variance effective population size accounting for demography and polygyny | considered range 0 ≤ p0 ≤ 0.25 |
| overall (multigenerational) variance effective population size accounting for demography and polygyny | ||
| υm, υf | male and female variance in lifetime reproductive success, respectively | for males assumed to be Poisson-distributed among mating males; for females evaluated from observations |
| Nr | the effect of variance reproductive success on the variance effective population size (with regard to ideal size N ) | |
| , | male and female heritability in lifetime reproductive success, respectively | for males assumed ; for females was evaluated from mother—daughter regression (Fig. 2) |
| Nb | the effect of heritability of reproductive success on the variance effective population size (with regard to ideal size N) |
Predicting Nev Based on Demography
Our null hypothesis was that life-history and mating-system effects are negligible, and only demography (including sex ratios) affects genetic drift. We calculated the Nev that incorporates only direct demographic effects (including sex-ratio skew), Nd. At reintroduction and during the first generation, the population was well monitored, all individuals were accounted for, and precise census numbers were obtained (Saltz & Rubenstein 1995). For the next 3 generations, census sizes were estimated by extracting the growth rate from a life-history table (Saltz & Rubenstein 1995), estimated as R0 = 1.87 per generation (Renan et al. 2015). We assumed a margin of error of 10% of this R0 and calculated the predicted census size range for each generation. An Ne based on uneven sex ratios, for each generation, was calculated as (Wright 1931):
| (1) |
where Nm and Nf are the number of males and females in that generation, respectively. The overall effective size, , was calculated by taking the harmonic mean of Nd for each generation after the initial reintroduction (i.e., generations 1–4 after reintroduction; Nev incorporates only the offspring generations [Templeton 2006]).
Predicting Nev Based on Polygyny
The polygynous nature of the mating system of the Asiatic wild ass may have a strong effect on genetic drift in the population (Renan et al. 2015). Polygyny can be modeled in various ways, but when males can be partitioned into dominant and nondominant classes, as is the case in equids, a common approach is to evaluate the proportion of mating males (p0) per generation (Wade & Shuster 2004).
This means that, effectively, only p0Nm males participate in the mating process, and the effective population size for each generation accounting for demography and polygyny, Np, can be stated as a reformulation Eq. (1):
| (2) |
The overall Nev accounting for demography and polygyny, , is obtained by taking the harmonic mean of the sizes in generations 1–4, as explained above. Equation (2) describes the effect of polygyny in a fission-fusion social structure, where females are not constrained to mate with a single male, as is the case in this wild ass population, whereas for harem-polygyny a different formulation should be used (Wang et al. 2016).
Predicting Nev Based on Female Variance in RS
The female contribution to genetic drift may also be important even in polygynous mating systems, most commonly through variance in lifetime reproductive success (ltRS) (Nunney 1996). In an ideal population, females have equal fitness, and variance in RS follows a Poisson distribution (with a mean and variance of 2 in stable populations). If female ltRS is overdispersed compared to a Poisson distribution (i.e., variance>mean), the few individuals with higher RS will be more genetically represented in the following generation. This increases genetic drift and decreases Ne, relative to the ideal case (Nunney 1996).
Under the assumption of equal sex ratios (adjusted for in Eqs. (1) and (2)) and no correlation between offspring sex and RS, the effect of variance in ltRS on Nev (relative to an ideal size N), denoted as Nr, can be partitioned to male (υm) and female (υ f) variance components (Wang & Hill 2000):
| (3) |
Because we considered polygyny in Eq. (2), υm refers to the variance in ltRS in dominant males. We assumed that there were no major fitness differences among dominant males (i.e., υm = 2).
It was useful to parameterize Eq. (3) by estimating υ f empirically. Data regarding female ltRS are not easily attained in long-lived species; however, we were able to evaluate the ltRS distribution by examining detailed records taken during 1985–1996 (Supporting Information). These records were attained during an intensive monitoring program that included routine observations (3 times a week) of the population (Saltz et al. 2000). All adult females in the population were individually recognized, and each birth event was noted. Newborns were continuously monitored until adulthood and were individually recognized.
Examining these records, we noted the number of offspring of each female and the number of reproductive years during the records period. The number of reproductive years was defined as the number of years above the age of 3, the typical age for onset of reproduction in wild ass (Saltz & Rubenstein 1995). We then estimated the annual RS, aRS, for each female. We discarded all females for which we had <3 reproductive years in the records because wild ass sire at most one offspring per year and estimating aRS based on just 1 or 2 years may not be indicative of the actual numbers.
To evaluate female ltRS, we also needed to know the number of reproductive years for females. We did not have detailed data on life expectancy (and hence number of reproductive years) for each female because many females were still alive when the records ended. However, because life-history tables of the population are available (Saltz & Rubenstein 1995), we estimated the average life expectancy, conditioned on reaching an age of 6 (females that did not reach this age would not be included in the study because we selected only females with >3 reproductive years). We used this estimate to derive the average number of reproductive years and then to calculate ltRS for each female and the overall mean and variance of ltRS. For consistency, we used the same life-expectancy estimate even if we knew the exact lifetime of a specific female. This procedure does not account for variance in life-expectancy (of females aged >6), so our estimate of ltRS is probably an underestimate. We used it only to broadly characterize ltRS distribution and υ f.
Predicting Nev Based on Heritability of RS
Another life-history trait that may induce genetic drift, less documented in wild populations and less considered in the context of conservation, is the heritability of RS (Robertson 1961; Nei & Murata 1966). In our case, RS is said to be heritable (at least partially) when there is a significant, positive regression between RS of mothers and the RS of their daughters. Such a positive regression could arise either genetically (the usual meaning of heritability) or through nongenetic mechanisms such as social inheritance. Regardless of the cause of RS heritability, alleles found in individuals with high RS, even those not associated with RS-related phenotypes, will experience increased representation in the population until their association with high RS dissipates. This constant genome-wide pressure will increase the overall rate at which gene lineages are lost or fixed in the population, even in neutral loci (i.e., increased genetic drift and reduced effective sizes would be observed). Although for those loci associated with the inherited RS this process may be beneficial in the context of conservation (perhaps leading to adaptation), the overall genetic diversity is expected to decrease when such heritability is high.
To predict the effect of heritability on Nev, we used the formulation of Nomura (2002), who expanded on the formulations of Nei and Tajima (1981). This formulation considers separate components of heritability of RS for the 2 sexes, and for paternal and maternal inheritance, respectively. The assumption is that inherited RS is expressed only when the sex of the parent and the sex of the offspring are the same (e.g., females inherit RS from their mothers and not from their fathers). In this case, the effect of heritability on Nev due to inherited RS (relative to an ideal size N), denoted as Nb, can be expressed as (Nomura 2002):
| (4) |
where rg is the correlation between the contribution of male and female parents and υ is the overall variance in ltRS.
To make use of Eq. (4), one must first estimate heritabilities, for example, by conducting a parent–offspring regression. For this purpose, however, life-history data spanning at least 3 generations are needed, very rarely available in wild mammals. The 1985–1996 records of the Negev wild ass population were, however, sufficient to allow for a mother–daughter regression analysis. We noted all mother–daughter pairs for which we had at least 3 years of records for both and performed regression of mother’s aRS versus the mean aRS of her daughters to estimate . We had no observational data regarding ; hence, we assumed , keeping in mind that we quantified only maternal heritability of RS and that if paternal heritability is significant it would constitute an additional factor reducing Nev.
Estimation of Nev from Temporal Genetic Data
The genetic data we analyzed were composed of samples taken at 2 periods—during reintroduction and in 2012. Allele frequencies were estimated for 8 microsatellite markers from blood samples that were kept frozen since 1991 for the founding population and from the noninvasive genetic survey for the 2012 population. The genetic survey was conducted throughout the geographic range of the population distribution. Details regarding sample collection, DNA extraction, and the genotyping procedure are given in Renan et al. (2015).
We determined accumulation of changes in allele frequencies due to genetic drift in the 4 generations that separated the samples, which allowed for evaluation of Nev. We used an F-statistics approach, following Nei and Tajima (1981) and the maximum pseudo-likelihood method implemented in the software MLNE (Wang 2001) to estimate Nev. Because the results with these two approaches are qualitatively similar and there is evidence that maximum-likelihood methods are more precise (Wang et al. 2016), details of F-statistics results are in Supporting Information.
Although there is evidence for the formation of population structure in the population (Gueta et al. 2014), this estimation of Nev should be robust to the existence of population structure if sampling is not biased to specific subpopulations (Wang et al. 2016), as is the case with our sampling scheme. The existence of overlapping generations may also introduce bias to Nev estimations. Effects of overlapping generations on genetic drift can be accounted for in a similar way as for other life-history characteristics described above. Nevertheless, overlapping-generations models are typically complex and require detailed accounts of demographic parameters of the different life stages, which are not often available for wild populations. However, with 4 generations between samples and for species with type I survivorship (low fecundity rates and parental care), such as Asiatic wild ass, overlapping-generation biases should be minimal (Waples & Yokota 2007).
Contrasting Nev Estimation with Predictions
We used 2 approaches to evaluate Nev, one based on life-history data and the other on genetic data. Because the primary definition of an effective size is based on its genetic impact, we considered the genetic estimator as the ground-truth and evaluated whether the predictions from life-history data match the genetic estimation. We therefore evaluated the life-history hypotheses underlying Nev predictions to improve understanding of the life-history of the wild ass population and the effect of life-history traits on genetic drift.
Described above are predictions for the effect of genetic drift given several relevant life-history traits: demography , parameterized by observations; polygyny , parameterized by parameter p0; female variance in ltRS (Nr), parameterized by observation data; and heritability of female RS (Nh), parameterized by mother–daughter regression analysis (Table 1). Each of these traits and their different combinations allows one to predict Nev. We treated each combination of traits as a hypothesis, and by comparing Nev predictions under different hypotheses with the estimated Nev, we determined which combination of traits (and their impact on genetic drift) was consistent with the observed genetic drift. All hypotheses we considered included the effect of demography on genetic drift because census sizes were the basis from which effective-size predictions were formulated.
Results
Predictions of Nev
The census numbers and the demographic-predicted effective size (Nd) for each generation are presented in Table 2. The overall demographic-predicted for the period between reintroduction and the time of the noninvasive genetic survey was 120.9 (error margins 114.7–126.5).
Table 2.
Estimated census sizes from direct counts and life-history table and demographic-predicted variance effective size (Nd) for each generation in Asiatic wild ass in the Negev desert.
| Reintroduction (0) | Generation 1 | Generation 2a | Generation 3a | Generation 4a | |
|---|---|---|---|---|---|
| Males (Nm) | 12 | 33 | 56 | 105 | 196 |
| Females (Nf) | 10 | 27 | 56 | 105 | 196 |
| Nd | 21.8 | 59.4 | 112 (101–123) | 210 (189–231) | 392 (353–432) |
Estimated assuming R0 = 1.87. Estimations with error margins of 10% of the R0 are in parentheses.
The effect of polygyny for 0 ≤ p0 ≤0.25 was quantified (Fig. 1) Considering the effect of polygyny alone (and demography) on genetic drift, effective size was predicted to be <48.3 (error margins 45.8–50.6).
Figure 1.
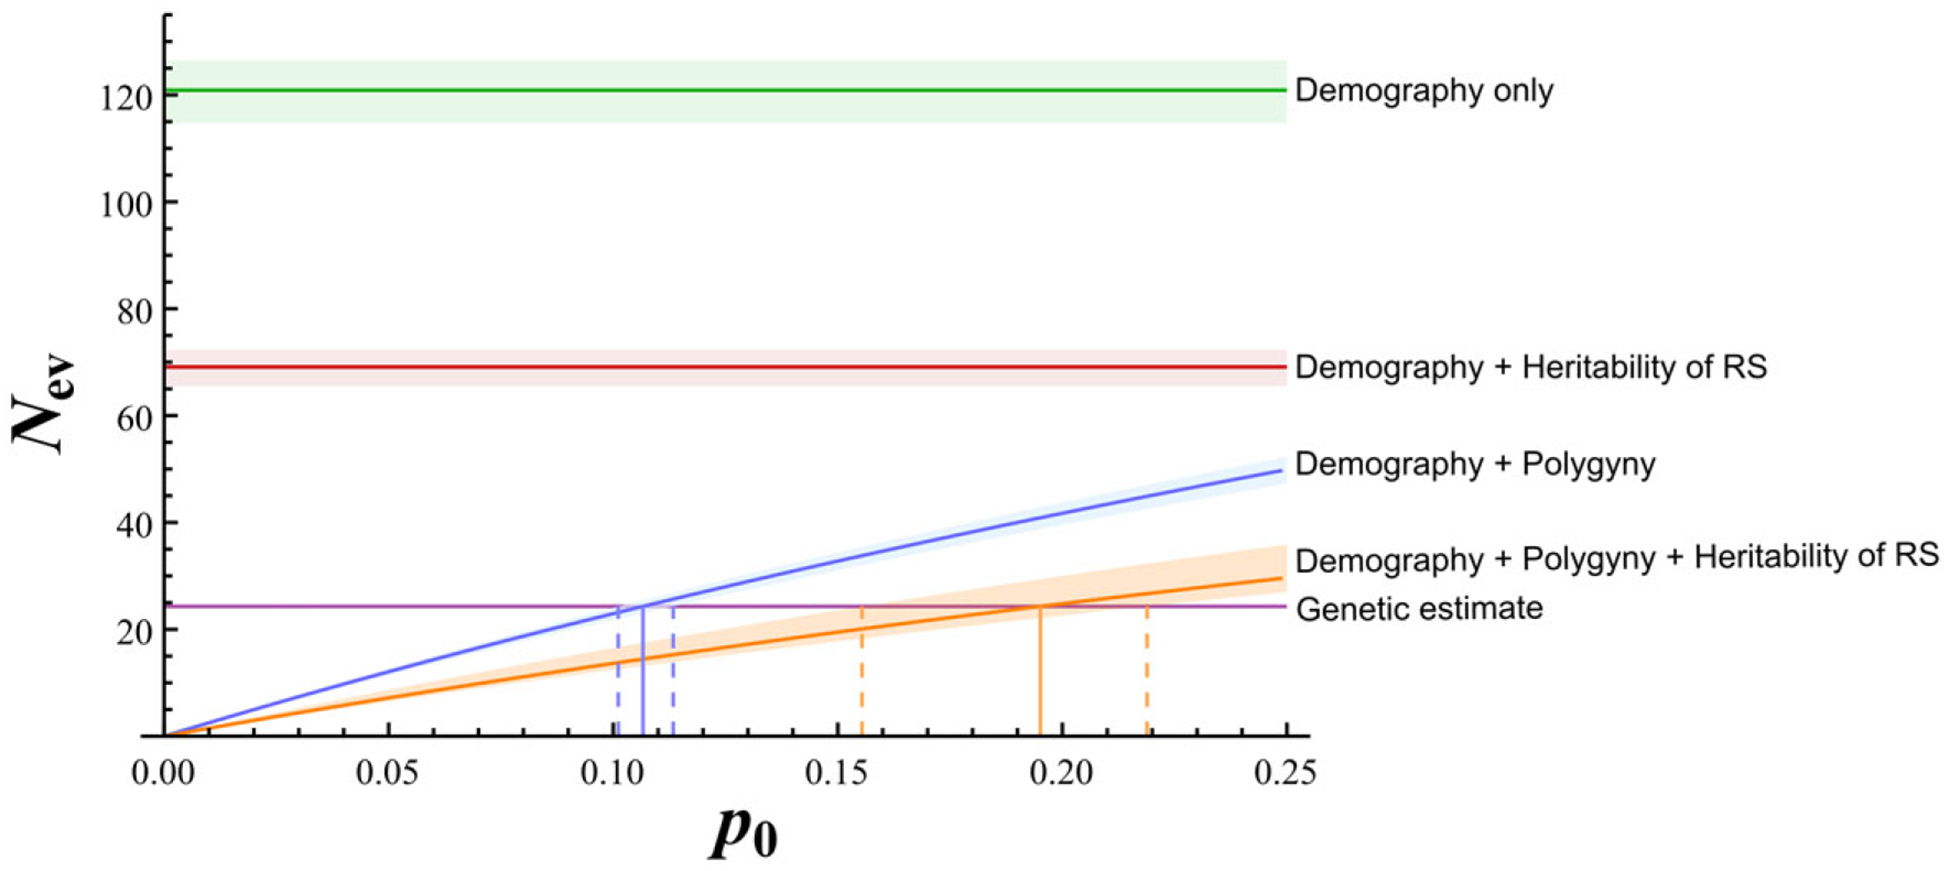
Demographic and life-history impacts on variance effective population size (Nev) in Asiatic wild ass (purple, estimated Nev based on genetic data with the maximum pseudo-likelihood method; other colors, predictions of Nev under different contributing factors to genetic drift: green, only demography; red, demography and heritability of female ltRS; blue, demography and polygyny; orange, demography, polygyny, and heritability of female ltRS; shading, margins of error; Vertical continuous lines, point estimates of p0; dashed lines, ranges when estimated error is considered).
We had RS data for 35 females (Table 3). The average life-expectancy of females >6 years old calculated from life-history table was 12.6; therefore, we considered an average of 10.6 reproductive years for the calculations of ltRS. The mean ltRS of the 23 females with sufficient data was 6.11 (SE 0.51) and the variance was 6.05 (SE 0.33). The variance-to-mean ratio was 0.99, very close to the expected value of 1 under a Poisson distribution (variance-to-mean ratio range given estimated errors was 0.88–1.16). Therefore, female ltRS was approximately Poisson-distributed, and the female variance in ltRS, after accounting for population growth, was υ f ≈ 2. This implies that female variance in ltRS was not predicted to significantly induce or reduce genetic drift (Nr ≈ N [Eq. (3)]).
Table 3.
Annual reproductive success of female Asiatic wild ass, mothers and daughters, from 1979 to 1996a.
| Mother | RY | Offspring | aRS | ltRS | Daughter | RY | Offspring | aRS | ltRS | Mean daughter aRS |
|---|---|---|---|---|---|---|---|---|---|---|
| Aphrodita | 10 | 4 | 0.4 | 4.24 | Annie | 6 | 5 | 0.83 | 8.83 | 0.58 |
| Apalusa | 3 | 1 | 0.33 | 3.53 | ||||||
| Alison | 8 | 3 | 0.38 | 3.98 | Aliab | 2 | 0 | – | – | 0 |
| Ayala | 5 | 0 | 0 | 0 | ||||||
| Crookedtail | 12 | 8 | 0.67 | 7.07 | Clairec | 6 | 4 | 0.67 | 7.07 | 0.5 |
| Cleo | 3 | 1 | 0.33 | 3.53 | ||||||
| Daphne | 8 | 7 | 0.88 | 9.28 | Daphodileb | 2 | 0 | – | – | 0.67 |
| Daisyb | 1 | 0 | – | – | ||||||
| Dalia | 6 | 4 | 0.67 | 7.07 | ||||||
| Dart | 12 | 11 | 0.92 | 9.75 | Daphne | 8 | 7 | 0.88 | 9.28 | 0.88 |
| Dreab | 2 | 0 | – | – | ||||||
| Hannah | 10 | 9 | 0.9 | 9.54 | Hailyb | 1 | 0 | – | – | 0.86 |
| Heather | 7 | 6 | 0.86 | 9.09 | ||||||
| Heather | 7 | 6 | 0.86 | 9.08 | Heidi | 4 | 2 | 0.5 | 4.06 | 0.5 |
| Radio | 12 | 9 | 0.75 | 7.95 | Raphsodyb | 1 | 0 | – | – | 0.47 |
| Radnerb | 2 | 0 | – | – | ||||||
| Rachel | 3 | 1 | 0.33 | 3.53 | ||||||
| Roxan | 5 | 3 | 0.6 | 6.36 | ||||||
| Rhonda | 12 | 8 | 0.67 | 7.07 | Rita | 4 | 2 | 0.5 | 5.3 | 0.47 |
| Rose | 3 | 1 | 0.33 | 3.53 | ||||||
| Seven | 12 | 7 | 0.58 | 4.89 | Sealyb | 0 | 0 | – | – | 0 |
| Senecab | 2 | 0 | – | – | ||||||
| Theresa | 12 | 8 | 0.67 | 7.07 | Tanya | 4 | 2 | 0.5 | 5.3 | 0.5 |
| Thelmab | 2 | 0 | – | – |
Individuals may appear both in the mother’s column and the daughter’s column.
Data regarding RS of females with <3 reproductive years during the study were not included in analyses.
RY, reproductive years: number of years above age 3 during the study period; aRS, annual reproductive success; ltRS, estimated lifetime reproductive success.
Ten mothers had daughters with information regarding RS (Table 3). The mother to mean-daughter RS regression analysis (Fig. 2) indicated significant heritability (p < 0.05) of (n = 10; y = 0.91x − 0 12; R2 = 0 54; p = 0.016; SE = 0.30). Because this was a mother–offspring regression and not a classic parent–offspring regression, implied the mode of inheritance was maternal because otherwise the overall heritability factor would be >1 and nonsensical. Therefore, the assumption that females inherit RS from their mothers alone is a valid assumption and Eq. (4) applies. Taking the total ltRS in the mating population as υ = 2 (because υ f ≈ 2 and we assumed υm = 2), we quantified the effect of heritability of female ltRS on genetic drift (Eq. (4)) as Nh = 0.59N (0.57N–0.69N, consideration estimation error and ); that is, heritability of female ltRS reduced Nev by a factor of 0.59.
Figure 2.

Mother and mean-daughter regression of annual reproductive success (RS).
Estimation of Nev From Genetic Data
We estimated Nev based on measured allele frequencies (Table 4). The maximum pseudo-likelihood point estimate was 24.3 (95% CI 13.8–44.0). The F-statistics estimates were between 17.4 and 21.9, depending on p0 (details given in Supporting Information).
Table 4.
Allele frequencies for 8 microsatellite loci of Asiatic wild ass in the Negev during the reintroduction period and in 2012.
| Reintroduction | 2012 | |||||||||||||
|---|---|---|---|---|---|---|---|---|---|---|---|---|---|---|
| allele | allele | |||||||||||||
| Microsatellite* | 1 | 2 | 3 | 4 | 5 | 6 | 7 | 1 | 2 | 3 | 4 | 5 | 6 | 7 |
| HMS2 (28, 113) | 0.55 | 0.27 | 0.13 | 0.05 | 0.43 | 0.21 | 0.03 | 0.33 | ||||||
| HMS3 (28, 125) | 0.43 | 0.21 | 0.18 | 0.18 | 0.2 | 0.38 | 0.35 | 0.07 | ||||||
| HMS6 (30, 27) | 0.75 | 0.25 | 0.81 | 0.19 | ||||||||||
| AHT4 (27, 113) | 0.35 | 0.2 | 0.17 | 0.08 | 0.07 | 0.07 | 0.06 | 0.08 | 0.2 | 0.48 | 0 | 0.11 | 0 | 0.13 |
| HTG4 (28, 109) | 0.54 | 0.43 | 0.03 | 0.57 | 0.42 | 0.01 | ||||||||
| LEX74 (29, 123) | 0.43 | 0.43 | 0.14 | 0.55 | 0.4 | 0.05 | ||||||||
| C0R70 (26, 88) | 0.33 | 0.23 | 0.23 | 0.21 | 0.16 | 0.18 | 0.09 | 0.16 | ||||||
| UM11 (27, 120) | 0.94 | 0.06 | 0.81 | 0.19 | ||||||||||
Sample sizes at the time of reintroduction and in 2012 in parentheses.
Contrasting Nev Estimation with Predictions
Variance in female ltRS did not substantially affect the prediction of Nev (Nr ≈ N) and therefore was not directly used to formulate any life-history hypothesis. The hypothesis that only demography drives genetic drift (Fig. 1) and the hypotheses that only demography and the measured heritability of RS (Nh = 69.1) (Fig. 1) are responsible were both inconsistent with the observed genetic data (Fig. 1 & Supporting Information). Given the plausible sources of genetic drift we considered, this implies that polygyny cannot be discounted as a source for genetic drift. With only demography and polygyny, taking the maximum-likelihood Nev estimate, the point estimate for the level of polygyny was 0.106 (error range 0.10–0.11) (Fig. 1). With demography, polygyny, and heritability of RS, the estimates were high (point estimate p0 = 0.195; error range 0.16–0.22) (Fig. 1). This means we estimated that 10.6% of the males participated in mating based on the genetic and demographic data and that this estimate would be 19.5% if we also accounted for the estimated level of RS heritability. For the F-statistics Nev estimates based on demography and polygyny, the estimated range was p0 = 0.08–0.10, and based on de mography, polygyny, and heritability of RS the estimated range was p0 = 0.12–0.19 (Supporting Information).
Discussion
Comparison of Nev predictions and the actual genetic estimation allows understanding of the different plausible components affecting genetic drift. In the wild ass population, the hypothesis that demography alone, unmodulated by life-history or mating system, determines genetic drift is inconsistent with the genetic measurements. The same is true for the hypothesis that demography together with heritability of female RS (as measured here) is the only contributing factor. The modulation of polygyny on demography was a strong factor because only when assuming polygyny of 8–11% (point estimate 10.6%) mating males per generation, or 12–22% (point estimate 19.5%) mating males accounting also for heritability of female RS, would the observed genetic data be explained by the hypotheses (Fig. 1 & Supporting Information). The higher range is similar to that in other strong polygynous mating systems in mammals, such as Antarctic fur seal (Arctocephalus gazella) (Hoffman et al. 2003), fallow deer (Dama dama) (Say et al. 2003), three-toed sloth (Bradypus variegatus) (Pauli et al. 2012), and elephant seals (Mirounga angustirostris and Mirounga leonina) (Hoelzel et al. 1999). However, the lower range is more extreme than any of these strongly polygynous systems. It is therefore more likely that female heritability in RS contributed considerably to genetic drift and polygyny was closer to 20% mating males per generation but not as extreme as 10%. Nevertheless, the effects of extreme modulation of polygyny on demography without heritability of female RS are also consistent with the genetic data (Fig. 1 & Supporting Information).
Heritability of RS is rarely documented in wild mammals (Charmantier et al. 2014, but see Kelly [2001] and Blomquist [2009]) because analyzing it requires long-term monitoring over at least 3 generations and individual-level recognition of at least the first 2 generations. We found that female RS was highly heritable , which implies that female RS is mainly inherited maternally. This suggests that heritability is not only due to genetically inherited traits because it is unlikely that the large number of traits influencing RS will be mostly inherited maternally. In contrast, social inheritance, if significant enough, could be a plausible explanation for such heritability because Asiatic wild ass are social animals and daughters most often remain with their mothers until at least the age of 3, and have no association with their fathers. If indeed social inheritance is the main source of heritability of RS in the population, then the assumption of is justified due to lack of social association between fathers and sons. Otherwise, could be approximated in future studies, for example, by paternity analysis, and paternal inheritance could be incorporated as an additional Nev prediction.
Heritability of RS through social inheritance could be mediated by inheritance of social status or by transfer of knowledge (e.g., distribution of key resources) from parent to offspring because both mechanisms are often linked to RS. For example, heritability of fitness in cheetahs (Kelly 2001) may also be related to social inheritance (Nomura 2002). Although inheritance of social status and the relation between socials status and RS have not been studied in wild ass, heritability of social status does occur in equids (Houpt & Wolski 1980; Feh 1999) and other social mammals (e.g., Holekamp & Smale 1991; Pereira 1995; Ilany & Akçay 2016). Social learning is the focus of many studies (Galef & Laland 2005) and has been observed in wild asses (Rubenstein et al. 2015), but there is little information regarding parent–offspring information transfer in this species. Nevertheless, the nonuniform distribution of resources in the arid environment of the Negev may potentially allow for parent–offspring knowledge transfer to have a considerable effect on heritability of RS (Danchin 2004).
Although we focused on Nev, some inference regarding inbreeding effective size (Nef) can be made. Although direct estimation of Nef requires detailed pedigree data or genetic parentage analysis of the population over the entire period considered, in populations experiencing demographic growth Nef tends to be smaller than Nev (Templeton 2006). For example, the equivalent of demographic inbreeding effective for Nef, given the data in Table 2, is 52.4 (error margins 51.4–53.2), less than half the demographic variance effective size (the harmonic mean of census numbers in generations 0–3 [Templeton 2006]). Although different aspects of life-history and mating system may affect Nef and Nev in different ways, it is very likely that Nef is lower than Nev in this expanding population.
Conservation Implications
Although the Asiatic wild ass population shows positive population growth, the low Nev, and by implication the low Nef, are of conservation concern. By separating the impacts of life-history and mating system on genetic drift into different factors, we gained detailed information that can be used to inform managers and help design management protocols for increasing effective population sizes. As the population grows and approaches carrying capacity, Nd should increase and with it Nev. However, the other factors, related more to behavioral and ecological characteristics of the species, are not expected to change without intervention. Variance in female ltRS does not seem to be a significant contributor to genetic drift and is therefore less of a concern in this population.
The main factor contributing to genetic drift in this system is polygyny; there was a reduction of 81% in Nev with p0 = 0.106 (Np = 0.19N; Eq. (2) assuming sex ratio 1:1) and of 67% with p0 = 0.195 (Np = 0.33N). In this species, p0 is determined mainly by the availability of territories because male wild ass roam in bachelor groups until they can attain and defend a valuable territory, thus gaining access to mating opportunities (Saltz et al. 2000). In the Negev desert, the population is centered around the few artificial and natural water sources in the region (Nezer et al. 2016). Geographic positioning system data suggest that territories are formed mainly around these water sources and are occupied mostly in summer, the breeding season (Giotto et al. 2015). Thus, p0 is probably constrained by the availability of water sources, and more water sources may allow for more territories to be formed and consequently for more males to attain territories and gain access to mating opportunities.
Increasing p0 in this fission-fusion population would be similar to changing harem size in populations with a harem-polygyny social structure. However, in the case of the wild ass in the Negev, this manipulation is made easier by the fact that territories are formed around water sources. Currently, artificial water-source supply is aimed only at population sustainability, but considering the strong effect of polygyny on Nev, we recommend placing more artificial water sources to increase p0, which should lead to an increase in effective population sizes.
Maternal inheritance of ltRS also has considerable impact on genetic drift and may be responsible for a 41% reduction in Nev (Nh = 0.59N). This characteristic may have either or both genetic and social components. Although intervention in genetic inheritance and social-status inheritance is difficult and probably inadvisable, parent–offspring transfer of knowledge regarding key resources may be affected by the distribution of these resources. Specifically, if the uniformity in which important resources are spatially distributed is increased, the effect of knowledge transfer, and hence heritability of RS (to the extent it is determined by social learning), should be decreased. Therefore, adding artificial water sources, as suggested, may increase effective population sizes both by increasing p0 and decreasing .
By examining the consistency of different hypothesized life-history effects with empirical genetic measurements of Nev, a comprehensive account of life-history and mating system can be attained. Moreover, understanding the relative impacts of different life-history traits on effective population size in the context of genetic measurements can help focus management efforts on the factors most affecting genetic drift. This can complement sensitivity and elasticity analyses, which evaluate relative impact of model parameters on effective size (e.g., Campbell & Husband 2005) by allowing the comparison of many different models in relation to actual genetic estimates. This approach emphasizes the importance of having both genetic data and detailed demographic records of wild populations because they can be used together to enrich our ecological understanding of populations.
The strategy we present is not limited to the hypotheses we focused on. Effective population sizes can be predicted based on various aspects of demography, life-history, ecology, and even population structure (to the extent that they can be simplified to tractable models). For different populations, different data may be available and different questions may be of conservation interest. Nevertheless, whenever genetic estimates can be attained and plausible hypotheses can be made, estimation and predictions of effective sizes can be compared to inform conservation, as we demonstrated here.
Supplementary Material
Acknowledgments
This research was supported by United States-Israel Bi-national Science Foundation grant 2011384 awarded to S.B., A.R.T., and A.B. This is publication 956 of the Mitrani Department of Desert Ecology.
Footnotes
Supporting Information
The F-statistics estimates for Nev and F-statistics analyses (Appendix S1) and records of births in the Asiatic wild ass population (Appendix S2) are available online. The authors are solely responsible for the content and functionality of these materials. Queries (other than absence of the material) should be directed to the corresponding author.
Literature Cited
- Allendorf FW, Luikart GH, Aitken SN. 2012. Conservation and the genetics of populations. Wiley-Blackwell, West Sussex, United Kingdom. [Google Scholar]
- Blomquist GE. 2009. Fitness-related patterns of genetic variation in rhesus macaques. Genetica 135:209–219. [DOI] [PubMed] [Google Scholar]
- Campbell LG, Husband BC. 2005. Impact of clonal growth on effective population size in Hymenoxys herbacea (Asteraceae). Heredity 94:526–532. [DOI] [PubMed] [Google Scholar]
- Charmantier A, Garant DD, Kruuk LEB. 2014. Quantitative genetics in the wild. Oxford University Press, Oxford, United Kingdom. [Google Scholar]
- Danchin E 2004. Public information: from nosy neighbors to cultural evolution. Science 305:487–491. [DOI] [PubMed] [Google Scholar]
- Feh C 1999. Alliances and reproductive success in Camargue stallions. Animal Behaviour 57:705–713. [DOI] [PubMed] [Google Scholar]
- Galef B, Laland KN. 2005. Social learning in animals: empirical studies and theoretical models. BioScience 55:489. [Google Scholar]
- Giotto N, Gerard JF, Ziv A, Bouskila A, Bar-David S. 2015. Space-use patterns of the Asiatic wild ass (Equus hemionus): complementary insights from displacement, recursion movement and habitat selection analyses. PLOS ONE 10 (e0143279) 10.1371/journal.pone.0143279. [DOI] [PMC free article] [PubMed] [Google Scholar]
- Gueta T, Templeton AR, Bar-David S. 2014. Development of genetic structure in a heterogeneous landscape over a short time frame: the reintroduced Asiatic wild ass. Conservation Genetics 15:1231–1242. [Google Scholar]
- Hoelzel AR, Le Boeuf BJ, Reiter J, Campagna C. 1999. Alpha-male paternity in elephant seals. Behavioral Ecology and Sociobiology 46:298–306. [Google Scholar]
- Hoffman JI, Boyd IL, Amos W. 2003. Male reproductive strategy and the importance of maternal status in the Antarctic fur seal Arctocephalus gazella. Evolution 57:1917–1930. [DOI] [PubMed] [Google Scholar]
- Holekamp KE, Smale L. 1991. Dominance acquisition during mammalian social development: the “inheritance” of maternal rank. Integrative and Comparative Biology 31:306–317. [Google Scholar]
- Houpt KA, Wolski TR. 1980. Stability of equine hierarchies and the prevention of dominance related aggression. Equine Veterinary Journal 12:15–18. [DOI] [PubMed] [Google Scholar]
- Ilany A, Akçay E. 2016. Social inheritance can explain the structure of animal social networks. Nature Communications 7:12084. [DOI] [PMC free article] [PubMed] [Google Scholar]
- Kaczensky P, Lkhagvasuren B, Pereladova O, Hemami M, Bouskila A. 2015. Equus hemionus The IUCN Red List of threatened species (eT7951A45171204). International Union for the Conservation of Nature, Gland, Switzerland. [Google Scholar]
- Kelly MJ. 2001. Lineage loss in Serengeti cheetahs: consequences of high reproductive variance and heritability of fitness on effective population size. Conservation Biology 15:137–147. [Google Scholar]
- Leberg PL. 2005. Genetic approaches for estimating the effective size of populations. Journal of Wildlife Management 69:1385–1399. [Google Scholar]
- Luikart G, Ryman N, Tallmon DA, Schwartz MK, Allendorf FW. 2010. Estimation of census and effective population sizes: the increasing usefulness of DNA-based approaches. Conservation Genetics 11:355–373. [Google Scholar]
- Nei M, Murata M. 1966. Effective population size when fertility is inherited. Genetics Research 8:257–260. [DOI] [PubMed] [Google Scholar]
- Nei M, Tajima F. 1981. Genetic drift and estimation of effective population size. Genetics 98:625–640. [DOI] [PMC free article] [PubMed] [Google Scholar]
- Nezer O, Bar-David S, Gueta T, Carmel Y. 2016. High-resolution species-distribution model based on systematic sampling and indirect observations. Biodiversity and Conservation 26:421–437. [Google Scholar]
- Nomura T 2002. Effective size of populations with heritable variation in fitness. Heredity 89:413–416. [DOI] [PubMed] [Google Scholar]
- Nunney L 1996. The influence of variation in female fecundity on effective population size. Biological Journal of the Linnean Society 59:411–425. [Google Scholar]
- Pauli JN, Peery MZ, Festa-Bianchet M. 2012. Unexpected strong polygyny in the brown-throated three-toed sloth. PLOS ONE 7 (e51389) 10.1371/journal.pone.0051389. [DOI] [PMC free article] [PubMed] [Google Scholar]
- Pereira ME. 1995. Development and social dominance among group-living primates. American Journal of Primatology 37:143–175. [DOI] [PubMed] [Google Scholar]
- Renan S, Greenbaum G, Shahar N, Templeton AR, Bouskila A, Bar-David S. 2015. Stochastic modeling of shifts in allele frequencies reveals a strongly polygynous mating system in the reintroduced Asiatic wild ass. Molecular Ecology 24:1433–1466. [DOI] [PubMed] [Google Scholar]
- Robertson A 1961. Inbreeding in artificial selection programmes. Genetics Research 2:189–194. [DOI] [PubMed] [Google Scholar]
- Rubenstein DI. 1994. The ecology of female social behavior in horses, zebras, and asses Pages 13–28 in Jarman P, Rossiter A, editors. Animal Societies: Individuals, Interactions, and Organization. Kyoto University Press, Kyoto. [Google Scholar]
- Rubenstein DI, Sundaresan SR, Fischhoff IR, Tantipathananandh C, Berger-Wolf TY. 2015. Similar but different: dynamic social network analysis highlights fundamental differences between the fission-fusion societies of two equid species, the Onager and Grevy’s zebra. PLOS ONE 10 (e0138645) 10.1371/journal.pone.0138645. [DOI] [PMC free article] [PubMed] [Google Scholar]
- Saltz D, Rowen M, Rubenstein DI. 2000. The effect of space-use patterns of reintroduced Asiatic wild ass on effective population size. Conservation Biology 14:1852–1861. [DOI] [PubMed] [Google Scholar]
- Saltz D, Rubenstein DI. 1995. Population dynamics of a reintroduced Asiatic wild ass (Equus hemionus) herd. Ecological Applications 5:327–335. [Google Scholar]
- Saltz D, Rubenstein DI, White GC. 2006. The impact of increased environmental stochasticity due to climate change on the dynamics of Asiatic wild ass. Conservation Biology 20:1402–1409. [DOI] [PubMed] [Google Scholar]
- Say L, Naulty F, Hayden TJ. 2003. Genetic and behavioural estimates of reproductive skew in male fallow deer. Molecular Ecology 12:2793–2800. [DOI] [PubMed] [Google Scholar]
- Schwartz MK, Tallmon DA, Luikart G. 1998. Review of DNA-based census and effective population size estimators. Animal Conservation 1:293–299. [Google Scholar]
- Templeton AR. 2006. Population genetics and microevolutionary theory. John Wiley & Sons, Hoboken, New Jersey. [Google Scholar]
- Wade MJ, Shuster SM. 2004. Sexual selection: harem size and the variance in male reproductive success. The American Naturalist 164:E83–E89. [DOI] [PubMed] [Google Scholar]
- Wang J 2001. A pseudo-likelihood method for estimating effective population size from temporally spaced samples. Genetics Research 78:243–257. [DOI] [PubMed] [Google Scholar]
- Wang J 2005. Estimation of effective population sizes from data on genetic markers. Philosophical transactions of the Royal Society B 360:1395–1409. [DOI] [PMC free article] [PubMed] [Google Scholar]
- Wang J, Hill WG. 2000. Marker-assisted selection to increase effective population size by reducing Mendelian segregation variance. Genetics 154:475–489.10629004 [Google Scholar]
- Wang J, Santiago E, Caballero A. 2016. Prediction and estimation of effective population size. Heredity 117:1–14. [DOI] [PMC free article] [PubMed] [Google Scholar]
- Waples RS, Yokota M. 2007. Temporal estimates of effective population size in species with overlapping generations. Genetics 175:219–233. [DOI] [PMC free article] [PubMed] [Google Scholar]
- Wright S 1931. Evolution in Mendelian populations. Genetics 16:97–159. [DOI] [PMC free article] [PubMed] [Google Scholar]
Associated Data
This section collects any data citations, data availability statements, or supplementary materials included in this article.