Abstract
The method of oncotripsy, first proposed in Heyden & Ortiz (Heyden & Ortiz 2016 J. Mech. Phys. Solids 92, 164–175 (doi:10.1016/j.jmps.2016.04.016)), exploits aberrations in the material properties and morphology of cancerous cells in order to ablate them selectively by means of tuned low-intensity pulsed ultrasound. We propose the dynamical model of oncotripsy that follows as an application of cell dynamics, statistical mechanical theory of network elasticity and ‘birth–death’ kinetics to describe the processes of damage and repair of the cytoskeleton. We also develop a reduced dynamical model that approximates the three-dimensional dynamics of the cell and facilitates parametric studies, including sensitivity analysis and process optimization. We show that the dynamical model predicts—and provides a conceptual basis for understanding—the oncotripsy effect and other trends in the data of Mittelstein et al. (Mittelstein et al. 2019 Appl. Phys. Lett. 116, 013701 (doi:10.1063/1.5128627)), for cells in suspension, including the dependence of cell-death curves on cell and process parameters.
Keywords: oncotripsy, ultrasound, low-intensity pulsed ultrasound, biomechanics, fatigue
1. Introduction
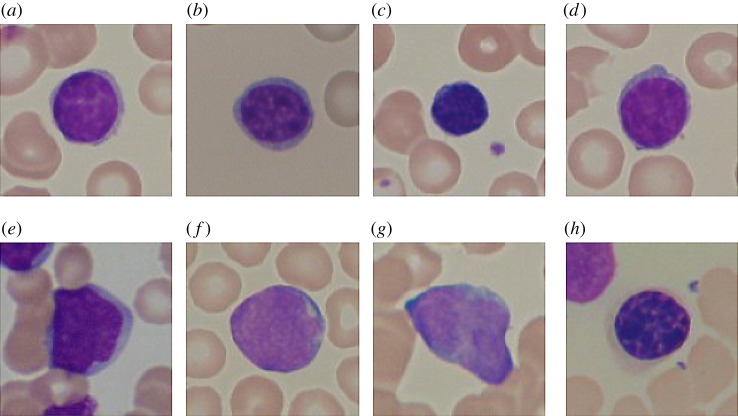
The method of oncotripsy, first proposed in [1], exploits aberrations in the material properties and morphology of cancerous cells (figures 1 and 2) in order to ablate them selectively by means of tuned low-intensity ultrasound. A wealth of observational evidence reveals that a substantial size difference between normal nuclei, with an average diameter of 7–9 μm, and malignant malignant nuclei, which can reach a diameter of over 50 μm, often characterizes malignancy [5]. Using atomic force microscopy (AFM), Cross et al. [6] reported the stiffness of live metastatic cancer cells taken from the pleural fluid of patients with suspected lung, breast and pancreatic cancer. They found that the cell stiffness of metastatic cancer cells is more than 70% softer than the benign cells that line the body cavity. Swaminathan et al. [7] applied a magnetic tweezer system to measure the stiffness of human ovarian cancer cell lines and found that cells with the highest invasion and migratory potential are up to five times softer than healthy cells [7]. Experimental investigations of hepatocellular carcinoma cells (HCCs) have also found that an increase in stiffness of the extracellular matrix (ECM) promotes HCC proliferation [8] and advances malignant growth [9].
Figure 1.
Optical images showing the deformability of three breast cells due to a constant stretching laser power of 600 mW. Deformability increases in the cancerous MCF-7 and ModMCF-7 cells in comparison with the healthy cell, MCF-10. The black scale bar is 10 μm. Reprinted from [2,3], with permission from Elsevier. (Online version in colour.)
Figure 2.
(a–d) Healthy lymphocyte cells from non-Acute Lymphoblastic Leukaemia patients. (e–h) Probable lymphoblast cells showing marked differences in size and morphology with respect to the healthy cells. ® 2020 IEEE. Reprinted, with permission, from [4]. (Online version in colour.)
Owing to these and other similar observed aberrations in material properties and morphology attendant to malignancy, the eigenfrequencies at which cell resonance occurs are expected to differ markedly between healthy and cancerous cells. In a numerical study, Heyden & Ortiz [1] showed that HCC natural frequencies lie above those of healthy cells, with a typical gap in the lowest natural frequency of about 37 kHz. For instance, they computed the fundamental frequency to be of the order of 80 kHz for HCCs and of the order of 43 kHz for healthy cells. Heyden & Ortiz [1] posited that, by exploiting this spectral gap, cancerous cells can be selectively ablated by means of carefully tuned ultrasound while simultaneously leaving normal cells intact, an effect that they referred to as oncotripsy. Specifically, by studying numerically the vibrational response of HCCs and healthy cells, Heyden & Ortiz [1] found that, by carefully tuning the frequency of the harmonic excitation, lysis of the HCC nucleolus membrane could be induced selectively at no risk to healthy cells. They also estimated that the acoustic density required for oncotripsy to operate is in the low-intensity pulsed ultrasound (LIPUS) range. This low-intensity requirement sets oncotripsy apart from high-intensity focused ultrasound, which acts via thermal ablation and is non-specific, with no selectivity for cancer cells.
The first numerical calculations of Heyden & Ortiz [1] neglected viscoelasticity and damping in the cell and ECM. Under these conditions, the resonant response of the cells exhibits rapid linear growth in time and the cells are predicted to attain lysis relatively quickly. However, experimental studies suggest that the material behaviour of the different cell constituents is viscoelastic [10–13]. In a subsequent study, Heyden & Ortiz [14] investigated the influence of viscoelasticity on the oncotripsy effect. They assumed Rayleigh damping and estimated the damping coefficients from dynamic AFM experiments on live fibroblast cells in buffer solutions [15]. They concluded that, for these cells, the main effect of viscoelasticity is a modest reduction in the resonant natural frequencies of the cells and an equally modest increase in the time to lysis of the cancerous cells. On the basis of these results, they speculated that oncotripsy remains viable when viscoelasticity is taken into account.
Following these leads, Mittelstein et al. [16] have endeavoured to assess the oncotripsy effect in carefully designed laboratory tests involving a number of cancerous cell lines in aqueous suspension. They have developed a system for testing oncoptripsy that includes a tunable source of ultrasonic transduction in signal communication with a system that allows control of several parameters, including frequency and pulse duration. Transducers were selected to produce ultrasound pulses in the frequency range of approximately 100 kHz to 1 MHz, a pulse duration range of 1 ms to 1 s, acoustic intensity up to 5 W cm−2 and output pressure up to 2 MPa. The instrumentation of the system allows the measurement of estimated cell-death rates as a function of frequency, pressure, pulse duration, duty cycle and number of cycles.
In agreement with the original oncotripsy concept, the experiments confirm that the application of LIPUS can indeed result in high death rates in the cancerous cell population selectively, i.e. simultaneously with small or zero death rates among healthy cells. The death and survival rates depend critically on the frequency of the ultrasound, indicative of a dynamical response of the cells. The oncotripsy effect is maximum at a certain frequency, and diminishes at both larger and smaller frequencies, also indicative of a resonant response of the cells. However, under the conditions of the experiments, cell death is observed to require the application of a much larger number of ultrasound cycles than anticipated by either [1] or [14], suggesting that the dynamics of cells in aqueous suspension is much more heavily damped than estimated in [14] based on the AFM measurements of Cartagena & Raman [15]. The observations reported by Mittelstein et al. [16] suggest that, under the conditions of the experiment, cell death occurs through a process of slow accumulation of damage over many cycles, instead of the rapid rupture of one of the cell membranes, as hypothesized in [1].
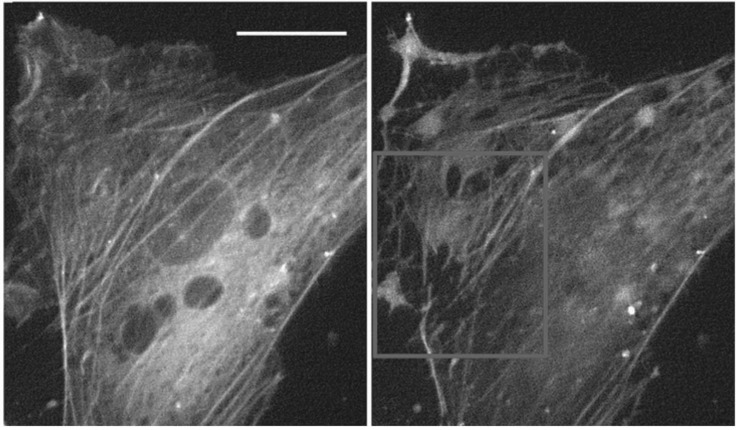
A number of experimental investigations suggest a mechanistic basis for the oncotripsy effect. The susceptibility of the cytoskeleton dynamics to therapeutic ultrasound, at strains of the order of 10−5 and frequencies in the MHz range, has been noted by Mizrahi et al. [17]. At low acoustic intensities, no structural network changes are observed over the duration of the experiments. By contrast, at sufficiently high acoustic intensities the actin network is progressively disrupted and disassembles within 3 min following exposure (figure 3). This disruption is accompanied by a 50% reduction in cell stiffness. Remarkably, after exposure to moderate acoustic intensities the stiffness of the cell gradually recovers and returns to its initial value. The mechanisms of actin stress–fibre repair have been extensively studied and are reasonably well understood at present (e.g. [18,19] and references therein). By contrast, at high acoustic intensities no recovery takes place after cessation over the span of observation.
Figure 3.
Live yellow fluorescent protein-tagged actin network staining of cells before and 5 min after exposure to 290 kPa acoustic pressure showing massive fibre disruption. Scale bar 10 μm. Republished with permission from the Royal Society of Chemistry, from [17]; permission conveyed through Copyright Clearance. Center, Inc.
To gain insight into the biomolecular mechanisms of LIPUS cytodisruption, Mittelstein et al. [16] examined CT26 cells after 2 min LIPUS treatment at 500 kHz and a focal pressure of 1.4 MPa. To evaluate the effect of LIPUS on the cytoskeleton, they plated CT26 cells after LIPUS and performed confocal microscopy immediately after insonation. Confocal images show the actin cytoskeleton, stained with phalloidin-conjugated green dye, as a ring on the cell periphery (figure 4). This ring is disrupted and shows diminished fluorescence for a 30 ms pulse duration, suggesting that cytodisruption is coupled with persistent cytoskeleton disruption. These observations are consistent with reports for other systems that LIPUS disrupts the cellular cytoskeleton [20,21]. By contrast, with a 1 ms pulse duration, the actin cytoskeleton appears unchanged from the negative control. Mittelstein et al. [16] conclude that these observations suggest that LIPUS induces actin cytoskeletal disruption and activates apoptotic cell-death pathways.
Figure 4.
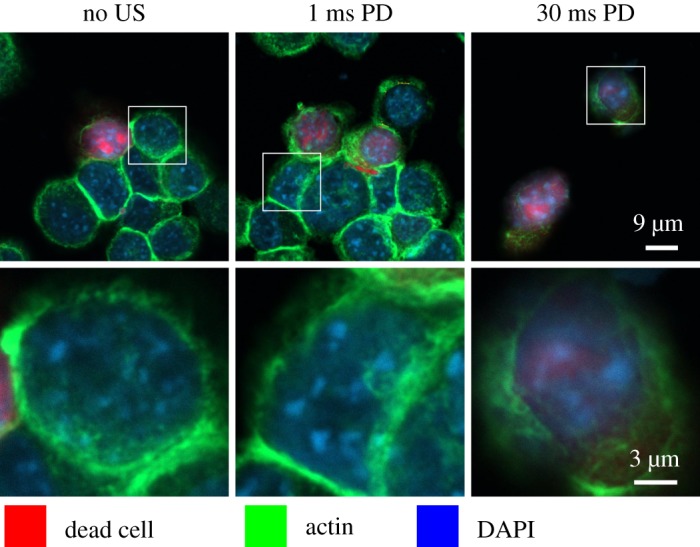
Confocal microscopy of CT26 cells immediately after LIPUS treatment at 500 kHz, a focal pressure of 1.4 MPa and pulse duration (PD) of 0 ms (control), 1 ms and 30 ms. Reprinted from [16], with the permission of AIP Publishing. Dead cells stained red with fixable LIVE/DEAD, the actin cytoskeleton stained green using phalloidin and the nucleus stained blue with DAPI (4’,6-diamidino-2-phenylindole). Confocal images show the disrupted actin cytoskeleton ring and significantly decreased actin stain intensity. Microscopy suggests that LIPUS cytodisruption is coupled with persistent cytoskeletal disruption. (Online version in colour.)
In the present work, we argue that these competing mechanisms of cytoskeletal disruption and self-repair, when coupled to the—possibly resonant—dynamics of the cells over many insonation cycles, underlie the oncotripsy observations of Mittelstein et al. [16]. Based on this hypothesis, we develop a plausible theoretical model of oncotripsy that accounts for several of the key experimental observations of Mittelstein et al. [16], including the dependence of the cell-death rates on frequency, pulsing characteristics and number of cycles. We posit that, under the conditions of the experiments, cells in suspension subjected to LIPUS act as frequency-dependent resonators and that the evolution of the cells is the result of competing mechanisms of high-cycle cumulative damage and healing of the cytoskeleton. We recall that structural materials can fail at load levels well below their static strength through processes of slow incremental accumulation of damage when subjected to a large number (millions) of loading cycles, a phenomenon known as mechanical fatigue [22]. Likewise, whereas one single LIPUS pulse is unlikely to cause significant cytoskeletal damage, we posit that over millions of cycles damage can accumulate to levels that render the cell unviable and cause it to die. By analogy with structural materials, we refer to the hypothesized necrosis mechanism as mechanical cell fatigue.
We note that, whereas the elasticity, rheology and remodelling of the cytoskeleton have been extensively studied in the past (e.g. [23–26] and references therein), no model of cumulative damage and mechanical cell fatigue appears to have been proposed as yet. The model proposed in this work uses the application of cell dynamics, statistical mechanical theory of network elasticity and ‘birth–death’ kinetics to describe processes of damage and repair of the cytoskeleton. We also develop a reduced dynamical model that approximates the three-dimensional dynamics of the cell and facilitates parametric studies, including sensitivity analysis and process optimization. The reduced dynamical system encompasses the relative motion of the nucleus with respect to the cell membrane and a state variable measuring the extent of damage to the cytoskeleton. The cell membrane is assumed to move rigidly according to the particle velocity induced in the water by the insonation. The dynamical system evolves in time as a result of structural dynamics and kinetics of cytoskeletal damage and repair. The resulting dynamics is complex and exhibits behaviour on multiple time scales, including the period of vibration and attenuation, the characteristic time of cytoskeletal healing, the pulsing period and the time of exposure to the ultrasound. We show that this multi-time scale response can effectively be accounted for by recourse to Wentzel–Kramers–Brillouin (WKB) asymptotics and methods of weak convergence [27]. We also account for cell variability and estimate the attendant variance of the time-to-death of a cell population using simple linear sensitivity analysis. The reduced dynamical model predicts, analytically up to quadratures, the response of a cell population to LIPUS as a function of fundamental cell properties and process parameters. We show, by way of partial validation, that the reduced dynamical model indeed predicts—and provides a conceptual basis for understanding—the oncotripsy effect and other trends in the data of Mittelstein et al. [16], including the dependence of cell-death curves on pulse duration and duty cycle.
2. Experimental basis
We begin with a brief summary of the experimental system developed by Mittelstein et al. [16], as well as data and observations resulting from the study that are directly relevant to the present work. Their original publication may be consulted for a complete account.
(a). Experimental system
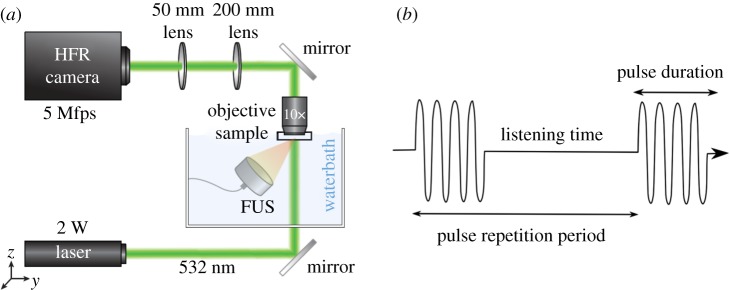
The experimental set-up (figure 5a) was developed to investigate the response of cells in aqueous suspension to ultrasound insonation [16]. Suspension cells are placed with a Mylar film pocket that is submerged within a water bath. The cells within the pocket are thus in acoustic contact with the ultrasound transducer. The investigation indicated that the cell-disruption effect through LIPUS requires the presence of spatial standing waves, which are generated by the reflection of the ultrasound wave off an acrylic or metal acoustic reflector. Several hypotheses for the requirement of a standing wave are explored in [16]. The transducer in the water tank is positioned directly incident with the Mylar pocket such that the acoustic axis is perpendicular to the optical axis, which is illuminated by laser light. The Mylar pocket is supported by a three-sided acrylic frame. One side of this frame serves as an acoustic reflector to form the standing waves. A water immersion pan-fluor objective is lowered into the water bath and a series of prism mirrors and converging lenses deliver the image into a high-speed camera. Images are acquired 100 ms after the arrival time of the pulse to observe the effect of prolonged ultrasound exposure.
Figure 5.
Experimental set-up of Mittelstein et al. [16]. (a) Schematic drawing of the LIPUS system and high frame-rate (HFR) camera set-up enabling cellular imaging at a frame rate of 5 MHz. Reprinted from [16], with the permission of AIP Publishing. (b) Schematic of pulsed ultrasound. (Online version in colour.)
The experiments aimed to isolate the mechanical effects of ultrasound by preventing local heating from taking place. In order to maintain low-intensity ultrasound conditions (spatial-peak temporal-average intensity <5 W cm−2), pulsed ultrasound was performed as shown in figure 5b. LIPUS was applied at a 10% duty cycle. However, the pulsing parameters were varied in order to investigate their role in ultrasound cytodisruption. The pulse duration corresponds to the length of each pulse during which the ultrasound is on. By varying the pulse duration, while maintaining a constant duty cycle, the pulsing pattern of the ultrasound applied to the cells can be modified while maintaining constant acoustic energy deposited on the cells. To further investigate the effects of modifying ultrasound parameters on cytodisruption, three different transducers operating at 300, 500 and 670 kHz were used during this investigation. To provide consistent comparisons, they were configured to produce a peak negative pressure of 1.4 MPa at their focus in free water.
(b). Cell motion
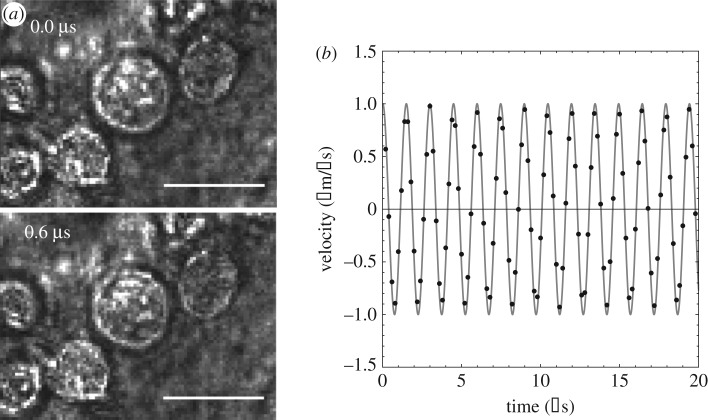
The recordings show that the entire field of view oscillates in the direction of ultrasound propagation with minimal observable cell membrane deformation (figure 6a). The damping out of cell membrane oscillations is expected given the exceedingly low Reynolds number characteristic of the cell dynamics in aqueous suspension. Figure 6b shows the measured trajectory of a K-562 cell upon insonation with a focal pressure of P0 = 1.4 MPa, frequency f0 = 670 kHz and wavelength λ = 2.2 mm. As may be seen from the figure, the cell undergoes an ostensibly harmonic motion. The period of the motion is T = 1.4 μs, which corresponds to a frequency of f = 714 kHz. In addition, the amplitudes of the motion in the x- and y-directions are ux = 0.23 μm and uy = 0.022 μm, respectively, for a total displacement amplitude of and a velocity amplitude of v = 2πf u = 1.037 m s−1. By way of reference, the particle velocity amplitude of the medium is v0 = P0/ρ0 c0 = 0.97 m s−1, where ρ0 = 1000 kg m−3 is the mass density of water and c0 = 1450 m s−1 is its speed of sound. We thus conclude that, as expected for the long wavelength of the insonation relative to the cell size, the cells move ostensibly at the particle velocity of the fluid.
Figure 6.
(a) Frames from video captured by Mittelstein et al. [16] and processed with Ncorr [28] (scale bar 10 μm). Reprinted from [16], with the permission of AIP Publishing. (b) Measured velocity of a K-562 cell under an incident plane wave of focal pressure amplitude P0 = 1.4 MPa and excitation frequency f0 = 670 kHz.
(c). Cell-death data
The experimental study of Mittelstein et al. [16] reveals that LIPUS conditions at specific frequencies and pulsing parameters can indeed achieve cell-selective cytodisruption. This capability to tune ultrasound parameters to cause selective disruption in cancer cells while sparing healthy cells appears to be a novel finding and fits with many of the predictions of the oncotripsy theory. The morphology, type and related disease for each cell line are listed in table 1. Figure 7 demonstrates that cells can have varying responses to ultrasound depending on the ultrasound waveform. All data points in this figure represent cell death assessed using LIVE/DEAD assays after exposure to an equal dosage of acoustic energy, though administered with different signal frequencies and pulse durations. These tests were all performed on cells in suspension for an exposure time of 60 s, a duty cycle of 10% and in a spatial standing wave set-up with a free-field pressure of 0.7 MPa. Remarkably, high cell-death rates are observed for both of the cancerous K-562 and U-937 cell lines at 500 kHz signal frequency and 20 ms pulse duration while, under identical conditions, the control T-cells remain nearly unaffected (figure 7b). These observations bear out the oncotripsy effect, as a frequency-dependent resonant response—and eventual death—of cells under harmonic excitation, and its selectivity.
Table 1.
Haematopoietic and lymphoid tumour cells used in the experiments of Mittelstein et al. [16], classified by morphology, tissue, disease and source.
| cell line | morphology | tissue | disease | source |
|---|---|---|---|---|
| K-562 | lymphoblast | lymphocyte | chronic myelogenous leukaemia | human cell line |
| U-937 | monocyte | lymphocyte | pleura/pleural effusion, lymphocyte, myeloid | human cell line |
| T-cells | lymphocyte | peripheral blood cells, isolated CD3+ | human primary cells |
Figure 7.
Tests of cancerous K-562 and U-937 cells and healthy CD4 T-cells at a peak negative pressure of 0.7 MPa and a time of exposure of 60 s, showing the effect of frequency and pulse duration (PD) on cell-death rates. In all cases, the pulse duration is 10% of the total pulse repetition period. (a) Cell-death fraction versus pulse duration, and (b) cell-death fraction at 20 ms pulse duration versus type. Reprinted from [16], with the permission of AIP Publishing. (Online version in colour.)
The data in figure 7 also show a strong dependence of the cell response on pulse duration, with cell death enhanced at higher pulse durations. We take this dependence to suggest that the cell response is the result of two competing effects with vastly different characteristic times: damage accumulation during the on-part of the cycle and cell repair and healing during the entire time of exposure. The efficiency of the duty cycle may then be expected to depend sensitively on the relative values of the pulsing period and the characteristic times for damage accumulation and healing.
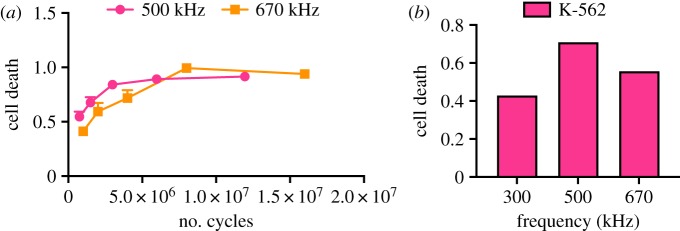
Figure 8 shows data from tests of cancerous K-562 cells, showing the effect of frequency and the number of cycles. In all cases, the pulse duration is 10% of the total pulse repetition period, or a duty factor of 0.1. As may be seen from these figures, cell death does not occur instantly but requires a certain exposure time to occur. We take this observation to suggest that death occurs by a process of damage accumulation over many insonation cycles. It is also evident from the figures that some cells die relatively early, whereas others require a considerably larger number of cycles to die. These observations are suggestive of a broad variability in the susceptibility of the cell population to LIPUS.
Figure 8.
Tests of cancerous K-562 cells at a free-field pressure of 0.7 MPa, pulse duration of 100 ms and duty cycle of 10%, showing the effect of frequency and number of cycles. (a) Cell death versus number of cycles and (b) cell death at 1.8 million cycles. Unpublished data from DR Mittelstein, J Yian, EF Schibber, A Roychoudhury, LT Martinez, MH Fekrazad, M Ortiz, PP Lee, MG Shapiro, M Gharib (2020) [16]. (Online version in colour.)
3. Oncotripsy model
We proceed to develop a theoretical framework in which to understand and rationalize the preceding observations. The framework explored in this work is based on the following assumptions.
-
(i)
For cells in suspension subjected to ultrasound, the aqueous medium damps out and suppresses the outer membrane vibrations, which translates rigidly at the particle velocity of the water.
-
(ii)
The internal structures of the cell, including its nucleus, respond as a resonator and vibrate in synchronization with the applied ultrasound.
-
(iii)
For sufficiently large pulse amplitudes, the cytoskeleton sustains cumulative mechanical damage that increases with successive cycles.
-
(iv)
At all times during exposure to ultrasound, the cytoskeleton can repair itself at a rate proportional to the level of damage sustained.
-
(v)
The cell ceases to be viable and dies when the amount of cumulative damage to the cytoskeleton exceeds a critical threshold.
The various elements of the theory are next developed in turn.
(a). Three-dimensional structure
In mammalian cells, the nucleus, as the largest cellular organelle, occupies about 10 % of the total cell volume [29,30]. It is surrounded by the cytosol, a viscoelastic solid containing several subcellular structures such as the Golgi apparatus, the mitochondrion and the endoplasmic reticulum. The cytosol and other organelles contained within the plasma membrane, for instance the mitochondria and plastids, form the so-called cytoplasm. The nucleus is bounded by the nuclear envelope and contains the nucleoplasm, a viscoelastic solid similar in composition to the cytosol. It furthermore comprises the nucleolus, which constitutes the largest structure within the nucleus and consists of proteins and RNA. In the present work, we neglect the organelles within the cytosol, which is idealized as a uniform viscous matrix containing the cytoskeleton. The nucleus is likewise idealized as rigid and we omit explicit consideration of the nucleoplasm. Given the focus on cytoskeletal dynamics, we additionally neglect the effect of the nuclear and cellular membranes.
(b). Cytoskeleton elasticity
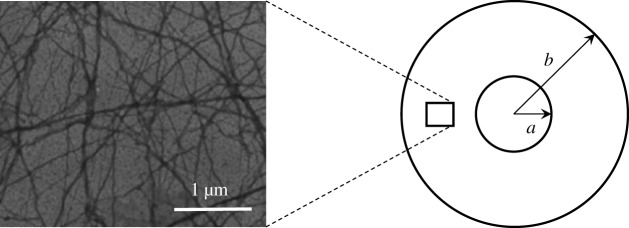
The cytoskeleton is a system of filaments in the cell that radiates from the nucleus and is anchored at the plasma membrane. In eukaryotic cells, the filament network has three major components: microtubules, intermediate filaments and microfilaments (figure 9a). Microfilaments are polymers of the protein actin, microtubules are composed of the protein tubulin and intermediate filaments are composed of various proteins, depending on the type of cell. The cytoskeleton confers elasticity to the cell, mediates the movement of the cells, helps to support the cytoplasm and responds against external mechanical stimuli. In particular, microfilaments and intermediate filaments act as cables to support tension loads while microtubules act as beams in compression [32], in analogy to tensegrity structures [33–36].
Figure 9.
Schematic of the computational model, consisting of a random three-dimensional network of filaments spanning a rigid and heavy nucleus and a cell membrane oscillating rigidly with the surrounding fluid. Left: Electron micrograph of F-actin. Reprinted from [31], with permission from Elsevier.
According to the network theory of elasticity in statistical mechanics [37,38], the cytoskeleton may be modelled as an amorphous network of cross-linked fibres. The fibres consist of many freely jointed segments and are far from full extension. It is further assumed that the cross-linking points move according to the local macroscopic deformation. In addition, the cytoskeleton is assumed to be embedded in a viscous matrix. A standard analysis (e.g. [37]) then gives the free-energy density per unit volume of the network as
| 3.1 |
up to inconsequential additive constants. In (3.1), μ(T) is a temperature-dependent shear modulus, F is the local deformation gradient, C = FTF is the right Cauchy–Green deformation tensor and T is the absolute temperature (e.g. [37,39] for background on continuum mechanics). An analysis of the configurational entropy of the fibres [37,38] gives the shear modulus as
| 3.2 |
where n is the number of fibres per unit volume, b is the segment length, l is the end-to-end distance of the fibres and kB is Boltzmann’s constant. In addition, the structure tensor K in (3.1) follows as
| 3.3 |
where ξ is the unit vector pointing from one end of the fibre to the other, or fibre direction, p(ξ) is the fraction of chains in the ensemble of direction ξ, S2 is the unit sphere and dΩ is the element of the solid angle. The density p(ξ) is subject to the normalization condition
| 3.4 |
The distribution function p(ξ) describes the structure of the cytoskeletal network and is assumed fixed and known. For instance, Smolyakov et al. [40] used single-cell force spectroscopy to test the mechanical properties of four breast cancer cell lines and found that the most invasive cells, MDA-MB231, contain actin fibres that are distributed randomly throughout the cell without any particular structure or preferred direction. For an isotropic fibre distribution of this type, p = 1/4π, and the structure tensor (3.3) reduces to the identity. Under these conditions, the free-energy density (3.1) specializes to
| 3.5 |
where tr denotes the matrix trace.
(c). Cytoskeletal damage and healing
The experimental observations of Mittelstein et al. [16] for cells in suspension (§2) reveal that cell death requires the application of a large number (millions) of insonation pulses, which in turn suggests that, under the conditions of the experiment, cell death is the result of a process of slow damage accumulation. Indeed, Mizrahi et al. [17] observed that, whereas the cytoskeletal actin fibres are catastrophically disrupted under the action of ultrasound stimulation of sufficiently high intensity (figure 3), under low-intensity ultrasound cellular responses exhibit gradual damage accumulation and sometimes complete recovery following insonation cessation. Confocal microscopy of CT26 cells assessed after LIPUS treatment reported in [16] also reveals that LIPUS cytodisruption is coupled with persistent cytoskeletal disruption (figure 4).
Whereas cytoskeletal elasticity has been extensively studied in the past, the processes of damage accumulation in the cytoskeleton under LIPUS actuation, or high-cycle cell fatigue, appear to be as yet poorly understood. Building on past work on the failure of polymer networks [41–43], we develop a model of cumulative cell damage that accounts for the gradual disruption and repair of cytoskeletal fibres. This competition between disruption (death) and repair (birth) is a classical example of a ‘birth–death’ process in evolutionary dynamics (e.g. [44]).
We assume that the mechanism of damage accumulation to the cytoskeleton is the progressive disruption of the actin fibres. In order to account for the attendant loss of stiffness, we introduce a damage variable q(ξ) ranging from 0 to 1 such that q(ξ) = 0 when all the fibres with direction ξ are intact and q(ξ) = 1 when all the fibres with direction ξ are broken. We additionally assume that the breaking of the fibres requires a certain energy to be supplied. We represent these effects by means of a free-energy density of the form
| 3.6 |
where
| 3.7 |
is the stretch ratio of the fibres of direction ξ and β is a constant. We note from (3.6) that the effect of a damage field q(ξ) is to decrease the free-energy density of the fibres of direction ξ by a factor (1 − q(ξ))2 at an energy cost of (β/2) q2(ξ). Additionally, damage relaxes the stresses in the network by reducing the stiffness of the fibres. Evidently, in the absence of damage, q(ξ) = 0, (3.6) reduces to (3.1), as required.
Following the method of Coleman & Noll [45], the thermodynamic driving forces for damage follow as
| 3.8 |
We see from this expression that, by the choice (3.6) of free-energy density, the driving force (3.8) comprises two terms. The first term represents the energy-release rate due to the disruption of the fibres and, therefore, promotes damage. The second term represents the energetic cost of disrupting the fibres, which hinders damage and promotes healing. Assuming linear kinetics, we obtain the damage evolution law
| 3.9 |
where α is a kinetic coefficient.
The kinetic relation (3.9), in combination with the driving forces (3.8), defines an evolution of the cytoskeletal state as a balance between ‘birth’ and ‘death’ processes. Thus, the energy-release term μ(T)(1 − q(ξ))(λ2(ξ) + λ−2(ξ) − 2) in the driving force induces progressive damage (death) of the fibre population proportionally to the energy μ(T)(λ2(ξ) + λ−2(ξ) − 2) of the fibres. The additional factor (1 − q(ξ)) brings the driving force to zero at full damage q(ξ) = 1 and ensures that q(ξ) ≤ 1 at all times. By contrast, the energetic cost term −βq(ξ) in the driving force tends to restore (birth) the fibre population and thus accounts for healing. Built into the form of (3.8) is the assumption that the rate of healing is proportional to the extent of damage. In particular, the healing rate vanishes for q(ξ) = 0, which ensures that q(ξ) ≥ 0 at all times.
(d). Cell viscosity
Another source of resistance to cell deformation arises from the viscosity of the cytoplasm. This viscosity damps resonant vibrations within the cell and limits their amplitude. On average, the cytoplasm viscosity does not differ significantly from that of water [46,47], but the distribution of intracellular viscosity is highly heterogeneous. Full maps of subcellular viscosity have been successfully constructed via fluorescent ratiometric detection and fluorescence lifetime imaging [48]. However, this degree of detail is beyond the scope of this study. Instead, we assume an average viscosity uniformly distributed over the cytoplasm. Further assuming linear viscosity, the viscous Cauchy stress in the cytoplasm follows as
| 3.10 |
where η is the shear viscosity, κ is the bulk viscosity, v is the velocity field, a comma denotes partial differentiation and div v is the divergence of the velocity field.
(e). Reduced model
The preceding model of cytoplasm elasticity, damage, healing and viscosity can be taken as a basis for a fully three-dimensional analysis of cell motion, e.g. by means of the finite-element method (cf. [49]). However, parametric and sensitivity studies are greatly facilitated by reduced models. We develop a reduced dynamical model of cell deformation and damage based on the following assumptions:
-
(i)
spherical geometry of the cell and nucleus
-
(ii)
rigid translational motion of the cell membrane
-
(iii)
heavy and rigid nucleus
-
(iv)
ansatz for the cytoplasm deformation and damage fields.
We note that, under the conditions of interest here, a Rayleigh treatment of the acoustic scattering problem is justified in view of the large wavelength of the ultrasound waves compared with the cell size.
We specifically consider a spherical cell of radius b containing a concentric spherical nucleus of radius a. We assume that the cell moves under the action of planar waves and executes a translational motion according to the particle velocity of the aqueous medium. We attach a moving Cartesian reference frame to the centre of the cell such that the x3-axis is aligned with the direction of motion. We additionally introduce a spherical coordinate system (r, φ, θ), such that
| 3.11 |
where r is the radius, φ is the azimuthal angle and θ is the inclination. In these spherical coordinates, the domain of the cytoplasm in its undeformed configuration is φ ∈ [0, 2π), θ ∈ [0, π) and r ∈ [a, b]. The nucleus is assumed to translate rigidly through a time-dependent displacement u(t) relative to the cell membrane. In addition, a material point in the cytoplasm initially at location (x1, x2, x3) in the undeformed configuration is assumed to be at location
| 3.12 |
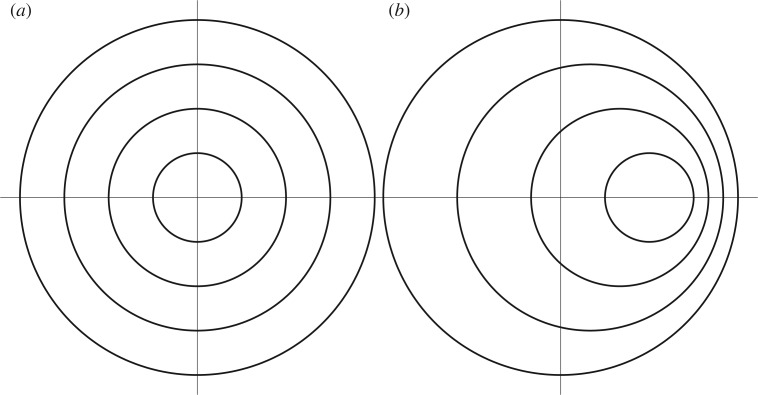
following the displacement of the nucleus. In this ansatz, a spherical material shell of radius r in the undeformed configuration translates rigidly to another spherical shell of the same radius centred at u(t) (b − r)/(b − a) following the displacement of the nucleus (figure 10).
Figure 10.
Deformation ansatz used in model reduction. (a) Cross section of the reference configuration of the cell, showing the nucleus (inner circle) and two concentric material spheres to aid in the visualization of the deformation. (b) Deformed configuration of the cell after displacement of the nucleus.
(i). (Dynamics without damage)
Inserting this ansatz into the free-energy density (3.1) and assuming small relative displacements u(t), we obtain, after a trite calculation,
| 3.13 |
and the total free energy of the cytoskeleton evaluates to
| 3.14 |
which, in the absence of damage, supplies a potential for the relative displacement of the nucleus. Likewise, the velocity field of the cytoplasm follows by time differentiation of the ansatz (3.12), with the result
| 3.15 |
Inserting this velocity field into the viscosity law (3.10) and assuming small relative displacements of the nucleus gives, after a straightforward calculation, the dissipation per unit undeformed volume
| 3.16 |
and the total dissipation follows as
| 3.17 |
Finally, the total kinetic energy of the cell follows as
| 3.18 |
where m0 is the mass of the nucleus, ρ is the density of the cytoplasm and v(t) is the prescribed velocity of the cell membrane. An appeal to the Lagrange–D’Alembert principle gives the equation of motion
| 3.19 |
Inserting (3.14), (3.17) and (3.18) into (3.19), we obtain
| 3.20 |
where
| 3.21 |
are the total mass, damping coefficient and stiffness of the cell, respectively. Equation (3.20) describes a damped and forced harmonic oscillator, with the material velocity v(t) of the aqueous medium supplying the forcing.
(ii). (Dynamics with damage)
Suppose now that the cell undergoes damage. In general, damage patterns may be expected to arise at two levels: inhomogeneously over the cytoplasm; and damage along preferential fibre directions at every material point. Such a degree of complexity requires a full three-dimensional analysis for its elucidation (cf. [49]). In order to simplify the dynamics, we simply assume that damage is isotropic at all material points, i.e. the damage parameter q is independent of direction ξ; and independent of position over the cytoskeleton. By this simple ansatz, the state of damage of the cell is characterized by a single state variable q(t). An immediate extension of (3.14) then gives the total free energy of the cell as
| 3.22 |
Likewise, the total dissipation (3.17) extends to
| 3.23 |
The Lagrange–D’Alembert principle then gives the coupled equations
| 3.24a |
and
| 3.24b |
Inserting (3.22), (3.23) and (3.18) into (3.24), we now obtain
| 3.25a |
and
| 3.25b |
with m, c and k as before and
| 3.26 |
The first of these equations represents a forced and damped harmonic oscillator in which the stiffness depends on the instantaneous state of damage. The second governs the kinetic evolution of the damage state, including damage accumulation and healing.
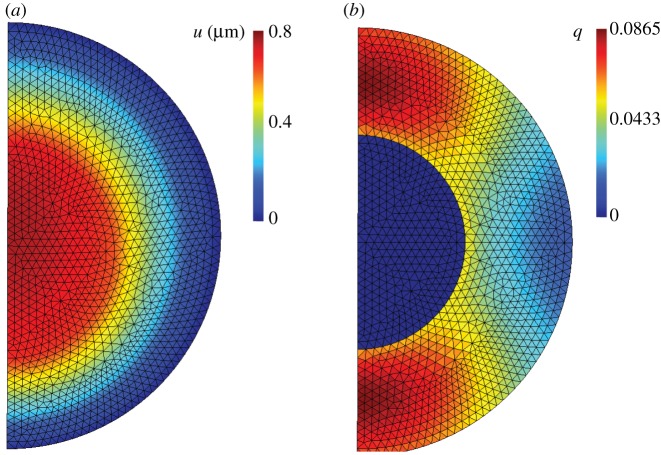
The accuracy of the reduced model just derived can be assessed by means of comparisons with finite-element implementations of the full model. Figure 11 shows a typical axisymmetric calculation in which a cell is insonated at 1.4 MPa focal pressure and 500 kHz frequency over 0.1 ms [49]. As may be seen from the figure, the damage to the cytoskeleton is localized at poles of the cell. Despite this patterning, the nuclear displacements and average cytoskeletal damage predicted by the reduced model are found to be within 7% of the full-field finite-element calculations. Given the level of observational error, this accuracy may reasonably be deemed adequate for all practical purposes. Further details of the error analysis may be found in [49].
Figure 11.
Axisymmetric finite-element results at 0.1 ms exposure using the full three-dimensional damage model [49]. The cell is insonated at 1.4 MPa focal pressure and 500 kHz frequency. (a) Magnitude of axial displacement in micrometres. (b) Damage averaged over all fibre directions. (Online version in colour.)
(f). WKB dynamics
Under the conditions of interest here, the dynamics described by system (3.24) is characterized by two disparate time scales: the period of oscillation and the characteristic time for damage evolution, the former much smaller than the latter. This two-time structure suggests analysing the problem by means of WKB asymptotics [27].
We consider a generic duty cycle such as that shown in figure 5b, starting at time t0 and consisting of an on-period ending at time t1 and an off-period ending at time t2. The duration of the on-period, or pulse duration, is T1 = t1 − t0; the duration of the off-period, or listening time, is T2 = t2 − t1; and the total duration of the duty cycle, or pulse repetition period, is T = t2 − t0. We specifically assume harmonic excitation of the form
| 3.27 |
during the on-period and v(t) = 0 during the off-period. In (3.27), V is a complex amplitude and ω is the insonation frequency.
We begin by analysing the equation of motion (3.25a), which we rewrite in the form
| 3.28 |
where is the natural frequency of the undamaged cell and ζ is the damping ratio. During the on-period of the duty cycle, we have
| 3.29 |
where, for convenience, we extend the equation to the complex domain. Assume now that the period of oscillation T0 = 2π/ω0 is much smaller than the pulse duration T1. Assume additionally that the frequency ω of insonation is comparable to ω0. Finally, suppose that the variation of the damage state variable q(t) is slow and on the scale of the pulse duration T1. Under these conditions, the solution u(t) can be obtained by performing a WKB asymptotic analysis in the small parameter T0/T1. We note that, for fixed q(t), equation (3.29) is a linear second-order ordinary differential equation and, therefore, its solution is the sum of the general homogeneous solution and a particular solution. Owing to the presence of damping, with damping coefficient ζ of O(1), the homogeneous solution decays on the scale of T0 and can be safely neglected. We seek a particular equation of the form
| 3.30a |
| 3.30b |
| 3.30c |
Inserting these expressions into (3.29) and retaining leading-order terms only, we obtain
| 3.31 |
Solving for the amplitude A(t), we find
| 3.32 |
Finally, inserting into (3.30a) we obtain
| 3.33 |
asymptotically as T0/T1 → 0. We observe from (3.33) that the nucleus executes rapid oscillations relative to the cell membrane over the pulse duration in synchronization with the ultrasound excitation, with amplitude modulated by the damage variable q(t).
Next, we turn to the damage evolution equation (3.25b). Inserting solution (3.33) into (3.25b) gives
| 3.34 |
which is now fully expressed in terms of the damage variable q(t). Conveniently, equation (3.34) is separable and admits the explicit solution
| 3.35 |
where we write q0 = q(t0). Alternatively, the equation of evolution (3.34) can be recast in terms of dimensionless variables as
| 3.36 |
where
| 3.37 |
whereupon (3.35) becomes
| 3.38 |
From this reparametrization, we observe that the evolution of damage depends on the following dimensionless parameters: (i) the ratio of the elapsed time to the relaxation time tr for healing; (ii) the ratio w between the frequency of insonation and the undamaged natural frequency; (iii) the energy deposited by insonation relative to the energy cost of repair; and (iv) the cell-damping ratio. It is also interesting to note that the damage state variable attains a steady-state maximum value qmax when
| 3.39 |
which expresses a balance between damage accumulation and healing. From this relation, the energy intensity required to attain a maximum level of damage qmax follows as
| 3.40 |
As expected, ε(qmax) reduces to zero as qmax → 0 and diverges to infinity as qmax → 1. We also note that, by virtue of the existence of a steady state at qmax, the integral in (3.38) is well defined and finite in the range q0 ≤ q < qmax and diverges to infinity at q = qmax, indicating that the steady state is attained only asymptotically at infinite time.
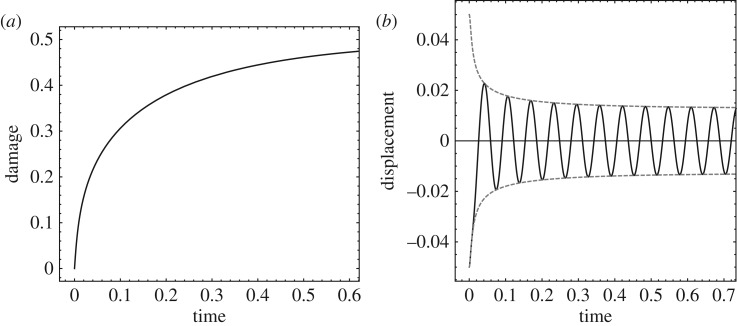
Figure 12 shows an example of the WKB dynamics just elucidated for the following parameters: tr = 1, ω = ω0 = 100, ζ = 1, qmax = 1/2. As may be seen from figure 12, the state of damage of the cell evolves on the scale of the relaxation time tr for healing and tends asympotically to qmax. The relative displacement of the nucleus is damped out on the shorter time scale 1/ζω0 and simultaneously amplified by the loss of stiffness due to damage on the time scale tr. The competition between these two opposing effects results in a well-defined steady-state amplitude, which follows from (3.31) by taking the limit of q(t) → qmax. Correspondingly, the phase-space trajectory converges to a stable limit cycle. The ability of WKB asymptotics to characterize the fast oscillations of the system and their slow modulation in time is remarkable.
Figure 12.
Example of cell response to harmonic excitation. (a) Damage state variable versus time. (b) Relative nucleus displacement and amplitude versus time. Parameters: tr = 1, ω = ω0 = 100, ζ = 1, qmax = 1/2.
During the off-period, the governing equations (3.25) reduce to
| 3.41a |
and
| 3.41b |
Again, we assume that the duration T2 of the off-period is much larger than the natural period of vibration T0. Under these assumptions, in the off-period we have
| 3.42 |
outside a short transient decay on the scale of T0 immediately following t1. Thus, modulo short transients during the off-period the cell is quiescent and repairs itself exponentially on the time scale of tr.
(g). Fractional-step approximation of high-cycle limit
Of special interest is the case in which the amount of damage accumulated over each duty cycle is small. Thus, in the experiments of Mittelstein et al. [16] the death of a significant fraction of the population requires the application of a large number of duty cycles of insonation. Correspondingly, the number of insonation pulses required to cause cell death is large, i.e. T/tr ≪ 1. We proceed to obtain an effective equation describing the evolution of the system over larger numbers of duty cycles, or a high-cycle limit. The effective equation follows by an appeal to the method of fractional steps [50].
We recall that the duty cycle under consideration consists of an on-period of scaled duration τ1 = T1/tr and an off-period of scaled duration τ2 = T2/tr. The entire scaled duration of the duty cycle is τ1 + τ2. Assuming τ1 ≪ 1, over a single on-period (3.36) gives
| 3.43 |
Likewise, with τ2 ≪ 1 over the subsequent off-period (3.41b) gives
| 3.44 |
Compounding the preceding relations and keeping the terms of first order in τ1 and τ2 gives
| 3.45 |
Rearranging terms gives the relation
| 3.46 |
where
| 3.47 |
are the on-time fraction of the duty cycle, or duty factor, and the off-time fraction, respectively. Formally passing to the limit in (3.46) gives the differential equation
| 3.48 |
which approximates slow damage evolution over larger numbers of duty cycles, or a high-cycle limit. Again, the differential equation (3.48) is separable with solution
| 3.49 |
which is explicit up to a quadrature. As in the case of steady insonation, we note that the system attains a steady state at a maximum level of damage
| 3.50 |
at which point damage accumulation and healing balance each other. The energy intensity required to attain a maximum level of damage qmax follows as
| 3.51 |
As expected, ε(qmax, λ) reduces to zero as λ → 0 and reduces to (3.40) for λ = 1. We also note that the integral in (3.49) is well defined and finite in the range q0 ≤ q < qmax and diverges to infinity at q = qmax, indicating that the steady state is attained only asymptotically.
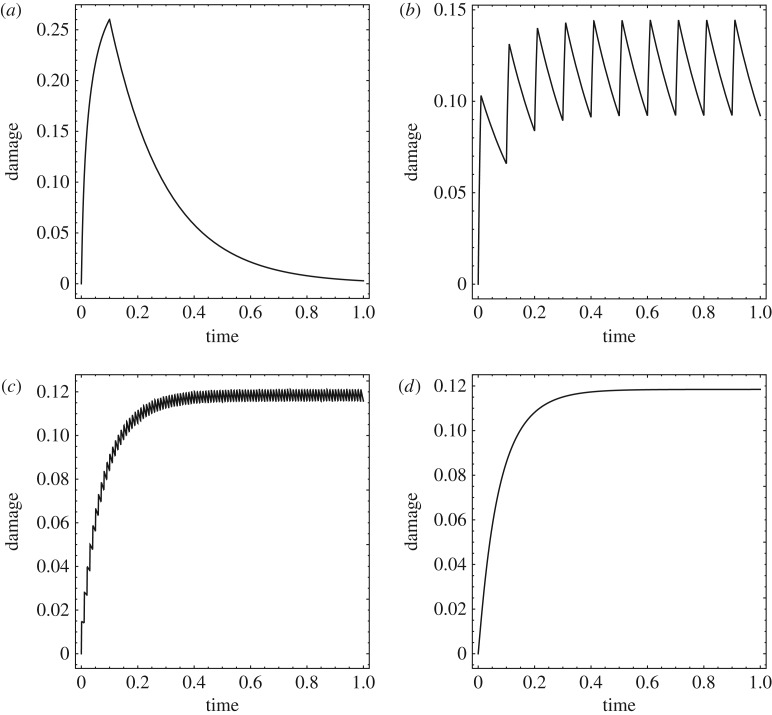
The convergence of the damage evolution to the high-cycle limit as the pulse repetition period T becomes much smaller than the characteristic time tr for healing is illustrated in figure 13, which corresponds to the choice of parameters: tr = 10, λ = 1/10, ω = ω0 = 100, ζ = 1/10, qmax = 1/2. Figure 13a–c shows the evolution of the damage state variable obtained by solving directly the WKB equations (3.36) and (3.41b) for T = 1, 1/10 and 1/100, respectively. As expected, damage accumulates during the off-period and otherwise relaxes at all times, resulting in a characteristic saw-tooth profile. Figure 13d shows the corresponding evolution of the damage state variable predicted by the effective fractional-step equation (3.48). Evidently, the high-cycle limiting curve is smooth and represents a weak limit of the damage evolution curves as the number of duty cycles tends to infinity (respectively, the pulse duration cycle tends to zero).
Figure 13.
Convergence of the damage evolution to the high-cycle limit as the pulse repetition period T becomes much smaller than the characteristic time tr for healing (cf figure 5b). Parameters: tr = 10, λ = 1/10, ω = ω0 = 100, ζ = 1/10, qmax = 1/2. (a) T = 1, (b) T = 1/10, (c) T = 1/100. (d) Damage evolution predicted by the high-cycle limit equation (3.48).
(h). Cell death
We recall that the state variable q(t) measures the amount of damage sustained by a cell at time t. A plausible assumption is that a cell becomes unviable and dies when q(t) attains a critical value qc. In light of our previous discussion, this condition cannot be met if qmax ≤ qc, i.e. if the maximum accumulated damage induced by insonation is less than the critical value. Conversely, it follows from (3.51) that cell death requires a minimum level of energy deposition
| 3.52 |
If this condition is met, then in the high-cycle limit the time to death of a cell follows from (3.49) as
| 3.53 |
otherwise, τc = +∞ and the cell survives for all time. The corresponding number of insonation pulses is
| 3.54 |
where T is the total pulse duration.
As noted in the Introduction, this type of system failure by slow damage accumulation over many cycles is observed in other systems, notably inert structural materials, in which context it is known as high-cycle mechanical fatigue [22]. The number of loading cycles to failure is correspondingly known as the fatigue life of the material. In this analogy, cell death by slow damage accumulation over many cycles may be thought of as a form of mechanical cell fatigue, and the number of cycles Nc to death as the fatigue life of the cell.
(i). Variability within a cell population
A typical population of cancerous cells exhibits broad variation in geometry and mechanical properties. This variability is strongly suggested by the cell-death curves observed by Mittelstein et al. [16], which show that some cells die much earlier than others. In order to capture this gradual cell necrosis, we regard the parameters governing the evolution of the cells as random and a cell population as a sample drawn from the probability distribution of the parameters. By virtue of the variability of the sample, parts of the population have a relatively short time to death and die early, whereas other parts have a comparatively longer time to death and die later, resulting in the gradual estimated cell-death curves observed experimentally (figure 8).
The statistics of the time to death can be estimated simply by means of a linear sensitivity analysis (e.g. [51]). We see from (3.53) that the time to death tc = τc tr depends on the cell parameters (tr, ω0, ζ, qc), respectively the relaxation time for healing, the natural frequency of vibration, the damping ratio and the critical value of damage and on the process parameters (ε, ω, λ), respectively the energy intensity, frequency and on-period fraction of the insonation. For simplicity, we assume that the process parameters can be controlled exactly and are uncertainty-free. In contrast, the cell parameters define a multivariate random variable X ≡ (tr, ω0, ζ, qc), with probability distribution reflecting the variability of the cell population.
Owing to the randomness of the cell population, the time to death tc itself defines a random variable Y. In terms of these random variables, (3.53) defines a relation of the form
| 3.55 |
In order to estimate the variability in the time-to-death random variable Y, we make a small-deviation approximation
| 3.56 |
where
| 3.57 |
is the mean value of the cell parameters and are the sensitivity parameters. The average time to death then follows as
| 3.58 |
In addition, a measure of the variability of Y is given by the variance
| 3.59 |
where
| 3.60 |
is the covariance matrix of the cell parameters.
We note that, for small deviations, the mean time to death of the cell population is obtained by evaluating (3.53) at the mean value of the cell parameters (cf. equation (3.58)), with the result
| 3.61 |
where we write and we assume that (3.52) is satisfied with . Likewise, the requisite sensitivity parameters follow by differentiating (3.58) with respect to the cell parameters and evaluating the resulting integrals at their mean value.
Simple forms of the probability distribution of tc are fully determined by the statistics and . For instance, if we hypothesize a Gamma distribution
| 3.62 |
then the parameters of the distribution follow as
| 3.63 |
The fraction of the cell population with a time to death less than or equal to t is given by the cumulative distribution function
| 3.64 |
For the Gamma distribution (3.62), we have
| 3.65 |
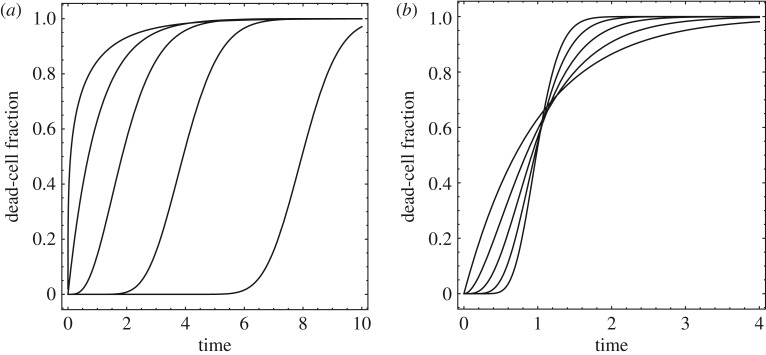
where Γ is the Gamma function. The resulting dead-cell fraction versus time curves are illustrated in figure 14.
Figure 14.
Dead-cell fraction versus time curves obtained from the Gamma-distribution. (a) , = 1/2, 1, 2, 4 and 8. (b) , = 1, 1/2, 1/4, 1/8 and 1/16.
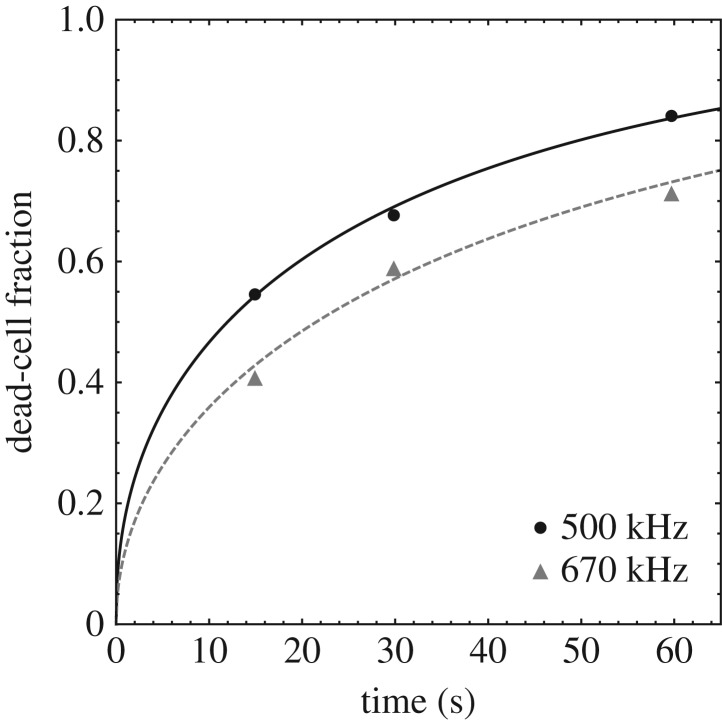
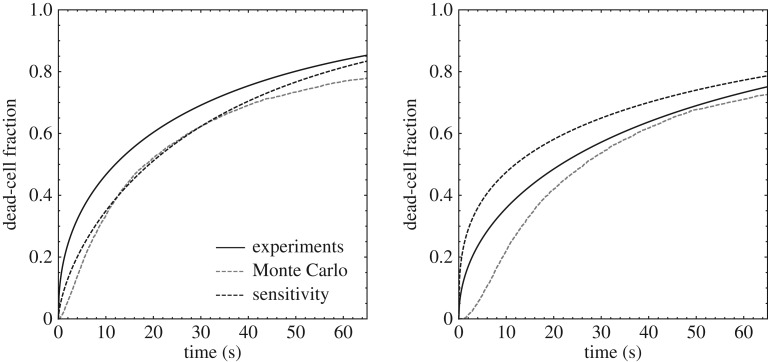
By way of an example, figure 15 shows a least-squares fit of the cell-death time data of [16] using the function F(t) obtained from the Γ distribution, equation (3.65). The data correspond to the cell line K-562 at focal pressure 1.4 MPa, pulse duration 100 ms and 10% duty cycle. The mean and standard deviation derived from the fit are listed in table 2. As may be seen from the figure, the Γ-distribution provides an adequate fit to the data.
Figure 15.
Γ-distribution fit of cell-death time data [16] for cell line K-562 at focal pressure 1.4 MPa, pulse duration 100 ms, 10% duty cycle at two insonation frequencies, 500 kHz and 670 kHz.
Table 2.
Mean and standard deviation obtained by fitting to cell-death time data [16] for cell line K-562 at focal pressure 1.4 MPa, pulse duration 100 ms, 10% duty cycle at two insonation frequencies, 500 kHz and 670 kHz.
| frequency (kHz) | (s) | σY (s) |
|---|---|---|
| 500 | 30.5 | 46.6 |
| 670 | 49.4 | 71.36 |
4. Comparison with experiment
We proceed to assess the ability of the proposed dynamical model to account for the experimentally observed trends summarized in §2.
(a). Qualitative comparison
We note that the experimentally observed dead-cell fraction versus time curves exhibit the sigmoidal form predicted by the proposed dynamical model (cf. figures 8 and 14), which can be used to fit the experimental curves. More importantly, the model explains the observed dead-cell fraction curves as a result of cell-to-cell variability; specifically, the random distribution of times to death in the cell population. Furthermore, the time to death of an individual cell is predicted by the model explicitly as a function of cell parameters (tr, ω0, ζ, qc) and process parameters (ε, ω, λ), e.g. through equation (3.53) in the high-cycle limit. Owing to the variability of the cell population, the cell parameters may be assumed to be random and, by an appeal to linear sensitivity analysis, the mean and variance of the cell time to death can be related to the mean values and covariance matrix of the cell parameters, equations (3.53) and (3.59). Thus, if the statistics of the cell parameters is known, the time-to-death statistics and, correspondingly, the dead-cell fraction curves are given explicitly by the model. In this manner, the model relates the observed dead-cell fraction curves to fundamental mechanical properties of the cell such as mass, stiffness, viscosity and damage tolerance.
The dynamical model also predicts the dependence of the dead-cell fraction curves on pulse duration observed experimentally (figure 7). Indeed, this trend is exhibited by the damage evolution curves shown in figure 13. A careful inspection of these curves shows that the maximum level of damage attained within the insonation cycles decreases as the pulse duration decreases relative to the characteristic time for healing. Thus, for long pulses the cells have time to accumulate large amounts of damage during the on-period of the pulse. For shorter pulses, the extent of damage accumulation is comparatively less. If the pulse duration is comparable to—or smaller than—the relaxation time for healing, the cell does not have sufficient time to recover during the off-period of the cycle, and the trend persists over repeated cycles. Therefore, according to the model the dependence of the dead-cell fraction curves on pulse duration is the result of a delicate interplay among the pulse repetition period and pulse duration, the cell dynamics, which determines the rate at which damage accumulates, and the kinetics of cell healing, which determines the rate at which damage is restored.
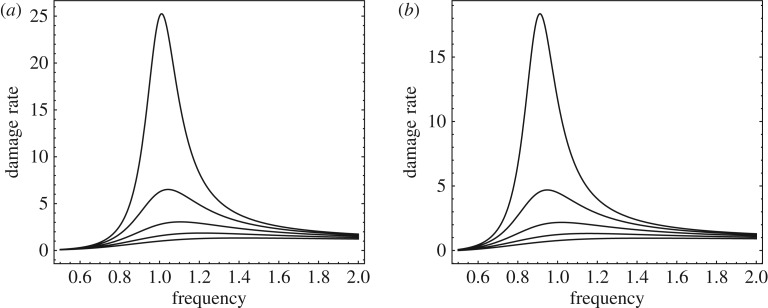
The dynamical model also exhibits the oncotripsy effect, i.e. the insonation-frequency dependence of the cell response and the window of opportunity for selective cell ablation. Figure 16 shows the damage accumulation rate computed from (3.48) as a function of insonation frequency, damping ratio and state of damage. The parameters used in the figure are: ω0 = 1, ε = 1, λ = 1, tr = 1, ζ = 1/10, 2/10, 3/10, 4/10, 5/10, q = 0, 1/10. As may be seen from the figure, the damage rate peaks sharply in the vicinity of the undamped resonant frequency ω = ω0. The damage accumulation rate is largest for a pristine cell, q = 0, and persists, albeit somewhat reduced, after the cell sustains damage, q = 1/10. This frequency dependence is clearly apparent in the experimental data (figure 8b).
Figure 16.
Damage accumulation rate as a function of insonation frequency. Parameters: ω0 = 1, ε = 1, λ = 1, tr = 1, ζ = 1/10, 2/10, 3/10, 4/10, 5/10. (a) Pristine cell, q = 0. (b) Damaged cell, q = 1/10.
(b). Quantitative comparison
A quantitative comparison between the predicted cell-death times and experimental data provides a measure of validation of the model. We recall that the death time tr of a cell characterized by parameters X ≡ (tr, ω0, ζ, qc) is given analytically by (3.53). We regard X as a multivariate random variable with a certain probability distribution reflecting the variability of the cell population. Owing to this variability, the time to death tc itself defines a random variable Y, in terms of which (3.53) is to be regarded as a response function of the form (3.55).
In order to exercise the linearized sensitivity framework formulated in §3h(i), we need to know the average values of the parameters X for a given cell population and their covariance matrix Σ. In lieu of direct characterization, we estimate these statistics as follows. We begin by assuming that the parameters X are independent and lognormal distributed with unknown mean and diagonal covariance matrix Σ. From this distribution, we generate a random sample {Xi, i = 1, …, N} of size N = 1000, compute the corresponding cell-death times using (3.53) and evaluate the fraction of the cell population with a time to death less than or equal to t as (cf. equation (3.64))
| 4.1 |
where # is the counting measure. The statistics and Σ are then obtained by means of a least-squares fit to the data. The results are listed in table 3.
Table 3.
Estimated mean, standard deviation and sensitivities of cell parameters.
| tr (s) | ω0 (rads/s) | ζ | qc | |
|---|---|---|---|---|
| mean | 100 | 3142 | 0.7 | 0.136 |
| standard deviation | 10 | 393 | 0.175 | 0.0136 |
Finally, we are in a position to compare predicted cell-death curves with the experimental data. Figure 17 shows computed cell-death curves for lognormal independent cell population parameters, with mean values and standard deviations as in table 3, together with experimental data from [16]. The predicted curves are computed directly via Monte Carlo based on a sample of size N = 1000 and by means of the linearized-sensitivity approximation. As may be seen from the figure, the linearized-sensitivity curve closely approximates the Monte Carlo curve, which establishes the validity of the linearized-sensitivity approximation under the conditions of the experiments. In addition, both the linearized-sensitivity and the Monte Carlo curves match closely the experimental data, which provides a measure of validation of the model.
Figure 17.
Comparison of predicted cell-death fraction with experimental data from [16] for a focal pressure of 1.4 MPa, pulse duration 100 ms, duty cycle 10% and frequencies 500 kHz and 670 kHz. The experimental data are represented through the Γ-distribution fit shown in figure 15.
5. Discussion and concluding remarks
The proposed dynamical model provides a rational basis for understanding the oncotripsy effect posited by Heyden & Ortiz [1] under the conditions of the experiments of Mittelstein et al. [16]. An important difference between those experiments and the scenario initially contemplated in [1] is that in the experiments of Mittelstein et al. [16] the cells are in aqueous suspension, whereas the analysis of Heyden & Ortiz [1] is concerned with cells embedded in a solid ECM. In aqueous suspension, the cells experience an exceedingly viscous environment, which is likely to suppress any vibrations of the cell membrane. The response of the cells to ultrasound stimulation is thus reduced to that of an internal resonator. Heyden & Ortiz [1] pointed out that the spectral gap between cancerous and healthy cells depends sensitively on the mechanical properties of the ECM and that the changes in those properties experienced by the cancerous tissue are a key contributing factor to the opening of a spectral gap. In addition, for cells embedded in an ECM, membrane rupture provides an additional lysis mechanism which is absent in cells in suspension. These considerations suggest the need for an independent experimental assessment of the oncotripsy effect in cancerous tissues, preferably in vivo.
The proposed dynamical model also reveals the dependence of oncotripsy on fundamental cell parameters and on process parameters. The cell parameters of the model can be calibrated from cell-death data for specific cell lines. Alternatively, fundamental cell properties such as stiffness and viscosity can be measured independently. The calibrated model can then be used as a tool for optimizing process parameters for maximum therapeutic effect. Most importantly, theoretical understanding such as that provided by the proposed dynamical model is key for interpreting experimental observations and formulating new and improved clinical therapies.
In this regard, a number of possible therapies suggest themselves as possible clinical applications of oncotripsy. Thus, owing to genomic instability and being in different states within the cell cycle, cancer cells are highly heterogeneous at any given moment. As such, it is unlikely that an entire cancer cell population can be killed by a single set of acoustic parameters. This suggests exploiting oncotripsy in connection with other synergistic cancer therapies such as immunogenic cell death (ICD). In this combination, oncotripsy does not need to kill every last cancer cell to be effective, as long as it can induce ICD of sufficient cancer cells to trigger the host immune system to kill the remaining cancer cells (abscopal effect). Again, these and other fundamental questions suggest worthwhile directions for further research.
Data accessibility
This article has no additional data.
Authors' contributions
M.O. conceived the study. E.F.S. and M.O. developed the theory and drafted the manuscript with input from all authors. All authors discussed the manuscript and gave final approval for publication.
Competing interests
We declare we have no competing interests.
Funding
The support of the California Institute of Technology through the Rothenberg Innovation Initiative and through the Caltech–City of Hope Biomedical Research Initiative is gratefully acknowledged.
Reference
- 1.Heyden S, Ortiz M. 2016. Oncotripsy: targeting cancer cells selectively via resonant harmonic excitation. J. Mech. Phys. Solids 92, 164–175. ( 10.1016/j.jmps.2016.04.016) [DOI] [Google Scholar]
- 2.Suresh S. 2007. Biomechanics and biophysics of cancer cells. Acta Biomater. 3, 413–438. ( 10.1016/j.actbio.2007.04.002) [DOI] [PMC free article] [PubMed] [Google Scholar]
- 3.Guck J. et al. 2005. Optical deformability as an inherent cell marker for testing malignant transformation and metastatic competence. Biophys. J. 88, 3689–3698. ( 10.1529/biophysj.104.045476) [DOI] [PMC free article] [PubMed] [Google Scholar]
- 4.Labati RD, Piuri V, Scotti F. 2011. ALL-IDB : the acute lymphoblastic leukemia image database for image processing. In Proc. 2011 18th IEEE Int. Conf. on Image Processing (ICIP 2011), Brussels, Belgium, 11–14 September 2011, pp. 2045–2048. New York, NY: IEEE.
- 5.Berman JJ. 2011. Precancer: the beginning and the end of cancer. London, UK: Jones & Bartlett Publishers. [Google Scholar]
- 6.Cross SE, Jin YS, Rao J, Gimzewski JK. 2007. Nanomechanical analysis of cells from cancer patients. Nat. Nanotechnol. 2, 780–783. ( 10.1038/nnano.2007.388) [DOI] [PubMed] [Google Scholar]
- 7.Swaminathan V, Mythreye K, O’Brien ET, Berchuck A, Blobe GC, Superfine R. 2011. Mechanical stiffness grades metastatic potential in patient tumor cells and in cancer cell lines. Cancer Res. 71, 5075–5080. ( 10.1158/0008-5472.CAN-11-0247) [DOI] [PMC free article] [PubMed] [Google Scholar]
- 8.Schrader J. et al. 2011. Matrix stiffness modulates proliferation, chemotherapeutic response, and dormancy in hepatocellular carcinoma cells. Hepatology 53, 1192–1205. ( 10.1002/hep.24108) [DOI] [PMC free article] [PubMed] [Google Scholar]
- 9.Levental KR, Yu H, Kass L, Lakins JN, Egeblad M, Erler JT. 2009. Matrix crosslinking forces tumor progression by enhancing integrin signaling. Cell 139, 891–906. ( 10.1016/j.cell.2009.10.027) [DOI] [PMC free article] [PubMed] [Google Scholar]
- 10.Panorchan P, Lee JSH, Kole TP, Tseng Y, Wirtz D. 2006. Microrheology and rock signaling of human endothelial cells embedded in a 3D matrix. Biophys. J. 91, 3499–3507. ( 10.1529/biophysj.106.084988) [DOI] [PMC free article] [PubMed] [Google Scholar]
- 11.Guilak F, Tedrow JR, Burgkart R. 2000. Viscoelastic properties of the cell nucleus. Biochem. Biophys. Res. Commun. 269, 781–786. ( 10.1006/bbrc.2000.2360) [DOI] [PubMed] [Google Scholar]
- 12.Zhang G, Long M, Wu ZZ, Yu WQ. 2002. Mechanical properties of hepatocellular carcinoma cells. World J. Gastroenterol. 8, 243–246. ( 10.3748/wjg.v8.i2.243) [DOI] [PMC free article] [PubMed] [Google Scholar]
- 13.Janmey PA. 1998. The cytoskeleton and cell signaling: component localization and mechanical coupling. Physiol. Rev. 78, 763–781. ( 10.1152/physrev.1998.78.3.763) [DOI] [PubMed] [Google Scholar]
- 14.Heyden S, Ortiz M. 2016. Investigation of the influence of viscoelasticity on oncotripsy. Comput. Methods Appl. Mech. Eng. 314, 314–322. ( 10.1016/j.cma.2016.08.026) [DOI] [Google Scholar]
- 15.Cartagena A, Raman A. 2014. Local viscoelastic properties of live cells investigated using dynamic and quasi-static atomic force microscopy methods. Biophys. J. 106, 1033–1043. ( 10.1016/j.bpj.2013.12.037) [DOI] [PMC free article] [PubMed] [Google Scholar]
- 16.Mittelstein DR. et al. 2019. Selective ablation of cancer cells with low intensity pulsed ultrasound. Appl. Phys. Lett. 116, 013701 ( 10.1063/1.5128627) [DOI] [Google Scholar]
- 17.Mizrahi N, Zhou EH, Lenorman G, Krishnan R, Weihs D, Butler JP, Weitz DA. 2012. Low intensity ultrasound perturbs cytoskeleton dynamics. Soft Matter 8, 2438–2443. ( 10.1039/c2sm07246g) [DOI] [PMC free article] [PubMed] [Google Scholar]
- 18.Smith M, Hoffman LM, Beckerle MC. 2014. LIM proteins in actin cytoskeleton mechanoresponse. Trends Cell Biol. 24, 575–583. ( 10.1016/j.tcb.2014.04.009) [DOI] [PMC free article] [PubMed] [Google Scholar]
- 19.Nakamura M, Hull AJ, Verboon JM, Parkhurst SM. 2018. Into the breach: how cells cope with wounds. Open Biol. 8, 180135 ( 10.1098/rsob.180135) [DOI] [PMC free article] [PubMed] [Google Scholar]
- 20.Noriega S, Hasanova G, Subramanian A. 2013. The effect of ultrasound stimulation on the cytoskeletal organization of chondrocytes seeded in three-dimensional matrices. Cells Tissues Organs 197, 14–26. ( 10.1159/000339772) [DOI] [PMC free article] [PubMed] [Google Scholar]
- 21.Samandari M, Abrinia K, Mokhtari-Dizaji M, Tamayol A. 2017. Ultrasound induced strain cytoskeleton rearrangement: an experimental and simulation study. J. Biomech. 60, 39–47. ( 10.1016/j.jbiomech.2017.06.003) [DOI] [PubMed] [Google Scholar]
- 22.Suresh S. 1998. Fatigue of materials. Cambridge, MA: Cambridge University Press. [Google Scholar]
- 23.Lim CT, Zhou EH, Quek ST. 2006. Mechanical models for living cells–a review. J. Biomech. 39, 195–216. ( 10.1016/j.jbiomech.2004.12.008) [DOI] [PubMed] [Google Scholar]
- 24.Mofrad MRK. 2009. Rheology of the cytoskeleton. Annu. Rev. Fluid Mech. 41, 433–453. ( 10.1146/annurev.fluid.010908.165236) [DOI] [Google Scholar]
- 25.Fletcher DA, Mullins RD. 2010. Cell mechanics and the cytoskeleton. Nature 463, 485–492. ( 10.1038/nature08908) [DOI] [PMC free article] [PubMed] [Google Scholar]
- 26.Jensen MH, Morris EJ, Weitz DA. 2015. Mechanics and dynamics of reconstituted cytoskeletal systems. Biochim. Biophys. Acta 1853, 3038–3042. ( 10.1016/j.bbamcr.2015.06.013) [DOI] [PMC free article] [PubMed] [Google Scholar]
- 27.Bender CM, Orszag SA. 1978. Advanced mathematical methods for scientists and engineers. International Series in Pure and Applied Mathematics New York, NY: McGraw-Hill. [Google Scholar]
- 28.Blaber J, Adair B, Antoniou A. 2015. Ncorr: open-source 2D digital image correlation Matlab software. Exp. Mech. 55, 1105–1122. ( 10.1007/s11340-015-0009-1) [DOI] [Google Scholar]
- 29.Alberts B, Johnson A, Lewis J, Raff M, Roberts K, Walter P. 2002. Molecular biology of the cell, 4th edn New York, NY: Garland Science. [Google Scholar]
- 30.Lodish H, Berk A, Matsudaira P, Kaiser CA, Krieger M, Scott MP, Zipursky SL, Darnell J. 2004. Molecular cell biology, 5th edn New York, NY: WH Freeman. [Google Scholar]
- 31.Gardel ML, Kasza KE, Brangwynne CP, Liu J, Weitz DA. 2008. Mechanical response of cytoskeletal networks. In Biophysical tools for biologists, vol. 2. In vivo techniques (eds J Correia, W Detrich III), pp. 487–519. Methods in Cell Biology, vol. 89. Amsterdam, The Netherlands: Elsevier Inc.
- 32.Li S, Sun B. 2011. Advances in cell mechanics. Berlin, Germany: Springer. [Google Scholar]
- 33.Ingber DE. 2003. Tensegrity II. How structural networks influence cellular information processing networks. J. Cell Sci. 116, 1397–1408. ( 10.1242/jcs.00360) [DOI] [PubMed] [Google Scholar]
- 34.Kardas D, Nackenhorst U, Balzani D. 2013. Computational model for the cell-mechanical response of the osteocyte cytoskeleton based on self-stabilizing tensegrity structures. Biomech. Model. Mechanobiol. 12, 167–183. ( 10.1007/s10237-012-0390-y) [DOI] [PubMed] [Google Scholar]
- 35.Barreto S, Clausen CH, Perrault CM, Fletcher DA, Lacroix D. 2013. A multi-structural single cell model of force-induced interactions of cytoskeletal components. Biomaterials 34, 6119–6126. ( 10.1016/j.biomaterials.2013.04.022) [DOI] [PMC free article] [PubMed] [Google Scholar]
- 36.Li J, Dao M, Lim CT, Suresh S. 2005. Spectrin-level modeling of the cytoskeleton and optical tweezers stretching of the erythrocyte. Biophys. J. 88, 3707–3719. ( 10.1529/biophysj.104.047332) [DOI] [PMC free article] [PubMed] [Google Scholar]
- 37.Weiner JH. 2002. Statistical mechanics of elasticity, 2nd edn Mineola, NY: Dover Publications. [Google Scholar]
- 38.Flory PJ. 1989. Statistical mechanics of chain molecules. Munich, Germany: Hanser Publishers. [Google Scholar]
- 39.Marsden JE, Hughes TJR. 1994. Mathematical foundations of elasticity. Dover Civil and Mechanical Engineering Series New York, NY: Dover. [Google Scholar]
- 40.Smolyakov G, Thiebot B, Severac C, Pelta J, Dague E. 2016. Elasticity, adhesion, and tether extrusion on breast cancer cells provide a signature of their invasive potential. ACS Appl. Mater. Interfaces 8, 27 426–27 431. ( 10.1021/acsami.6b07698) [DOI] [PubMed] [Google Scholar]
- 41.Balzani D, Ortiz M. 2012. Relaxed incremental variational formulation for damage at large strains with application to fiber-reinforced materials and materials with truss-like microstructures. J. Numer. Methods Eng. 92, 551–570. ( 10.1002/nme.4351) [DOI] [Google Scholar]
- 42.Heyden S, Conti S, Ortiz M. 2015. A nonlocal model of fracture by crazing in polymers. Mech. Mater. 90, 131–139. ( 10.1016/j.mechmat.2015.02.006) [DOI] [Google Scholar]
- 43.Heyden S, Li B, Weinberg K, Conti S, Ortiz M. 2015. A micromechanical damage and fracture model for polymers based on fractional strain-gradient elasticity. J. Mech. Phys. Solids 74, 175–195. ( 10.1016/j.jmps.2014.08.005) [DOI] [Google Scholar]
- 44.Nowak MA. 2006. Evolutionary dynamics: exploring the equations of life. Cambridge, MA: Belknap Press of Harvard University Press. [Google Scholar]
- 45.Coleman B, Noll W. 1963. The thermodynamics of elastic materials with heat conduction and viscosity. Arch. Ration. Mech. Anal. 13, 167–179. ( 10.1007/BF01262690) [DOI] [Google Scholar]
- 46.Fushimi K, Verkman AS. 1991. Domain of cell cytoplasm measured by picosecond polarization microfluorimetry. J. Cell Biol. 112, 719–725. ( 10.1083/jcb.112.4.719) [DOI] [PMC free article] [PubMed] [Google Scholar]
- 47.Luby-Phelps K, Mujumdar S, Mujumdar RB, Ernst LA, Galbraith W, Waggoner AS. 1993. A novel fluorescence ratiometric method confirms the low solvent viscosity of the cytoplasm. Biophys. J. 65, 236–242. ( 10.1016/S0006-3495(93)81075-0) [DOI] [PMC free article] [PubMed] [Google Scholar]
- 48.Liu T, Liu X, Spring DR, Xuhong Qian X, Cui J, Xu Z. 2014. Quantitatively mapping cellular viscosity with detailed organelle information via a designed pet fluorescent probe. Sci. Rep. 4, 5418 ( 10.1038/srep05418) [DOI] [PMC free article] [PubMed] [Google Scholar]
- 49.Schibber EF. 2019. High-cycle dynamic cell fatigue with applications on oncotripsy. PhD thesis, California Institute of Technology, Pasadena, CA, USA.
- 50.Yanenko NN. 1971. The method of fractional steps: solution of problems of mathematical physics in several variables. Berlin, Germany: Springer. [Google Scholar]
- 51.Sullivan TJ. 2015. Introduction to uncertainty quantification, vol. 63 Texts in Applied Mathematics Berlin, Germany: Springer. [Google Scholar]
Associated Data
This section collects any data citations, data availability statements, or supplementary materials included in this article.
Data Availability Statement
This article has no additional data.


