Abstract
While two classes of non-heme iron enzymes use ferric centers to activate singlet organic substrates for the spin forbidden reaction with 3O2, most classes use high spin ferrous sites to activate dioxygen. These FeII active sites do not exhibit intense absorption bands and have an integer spin ground state thus are mostly EPR inactive. We have developed new spectroscopic methodologies that provide geometric and electronic structural insight into the ferrous centers and their interactions with cosubstrates for dioxygen activation and into the nature of the intermediates generated in these reactions. First, we present our variable-temperature variable-field magnetic circular dichroism (VTVH MCD) methodology to experimentally define the geometric and electronic structure of the high spin ferrous active site.
Then, we focus on using Nuclear Resonance Vibrational Spectroscopy (NRVS, performed at SPring-8) to define geometric structure and VTVH MCD to define the electronic structure of the FeIII-OOH and FeIV=O intermediates generated in O2 activation and the spin state dependence of their frontier molecular orbitals (FMOs) in controlling reactivity. Experimentally validated reaction coordinates are derived for the anticancer drug bleomycin in its cleavage of DNA and for an alpha- ketoglutarate dependent dioxygenase in its selective halogenation over the thermodynamically favored hydroxylation of substrate.
Keywords: Bioinorganic Chemistry, O2 Activation, Non-Heme Iron, Magnetic Circular Dichroism, Nuclear Resonance Vibration Spectroscopy, Frontier Molecular Orbitals
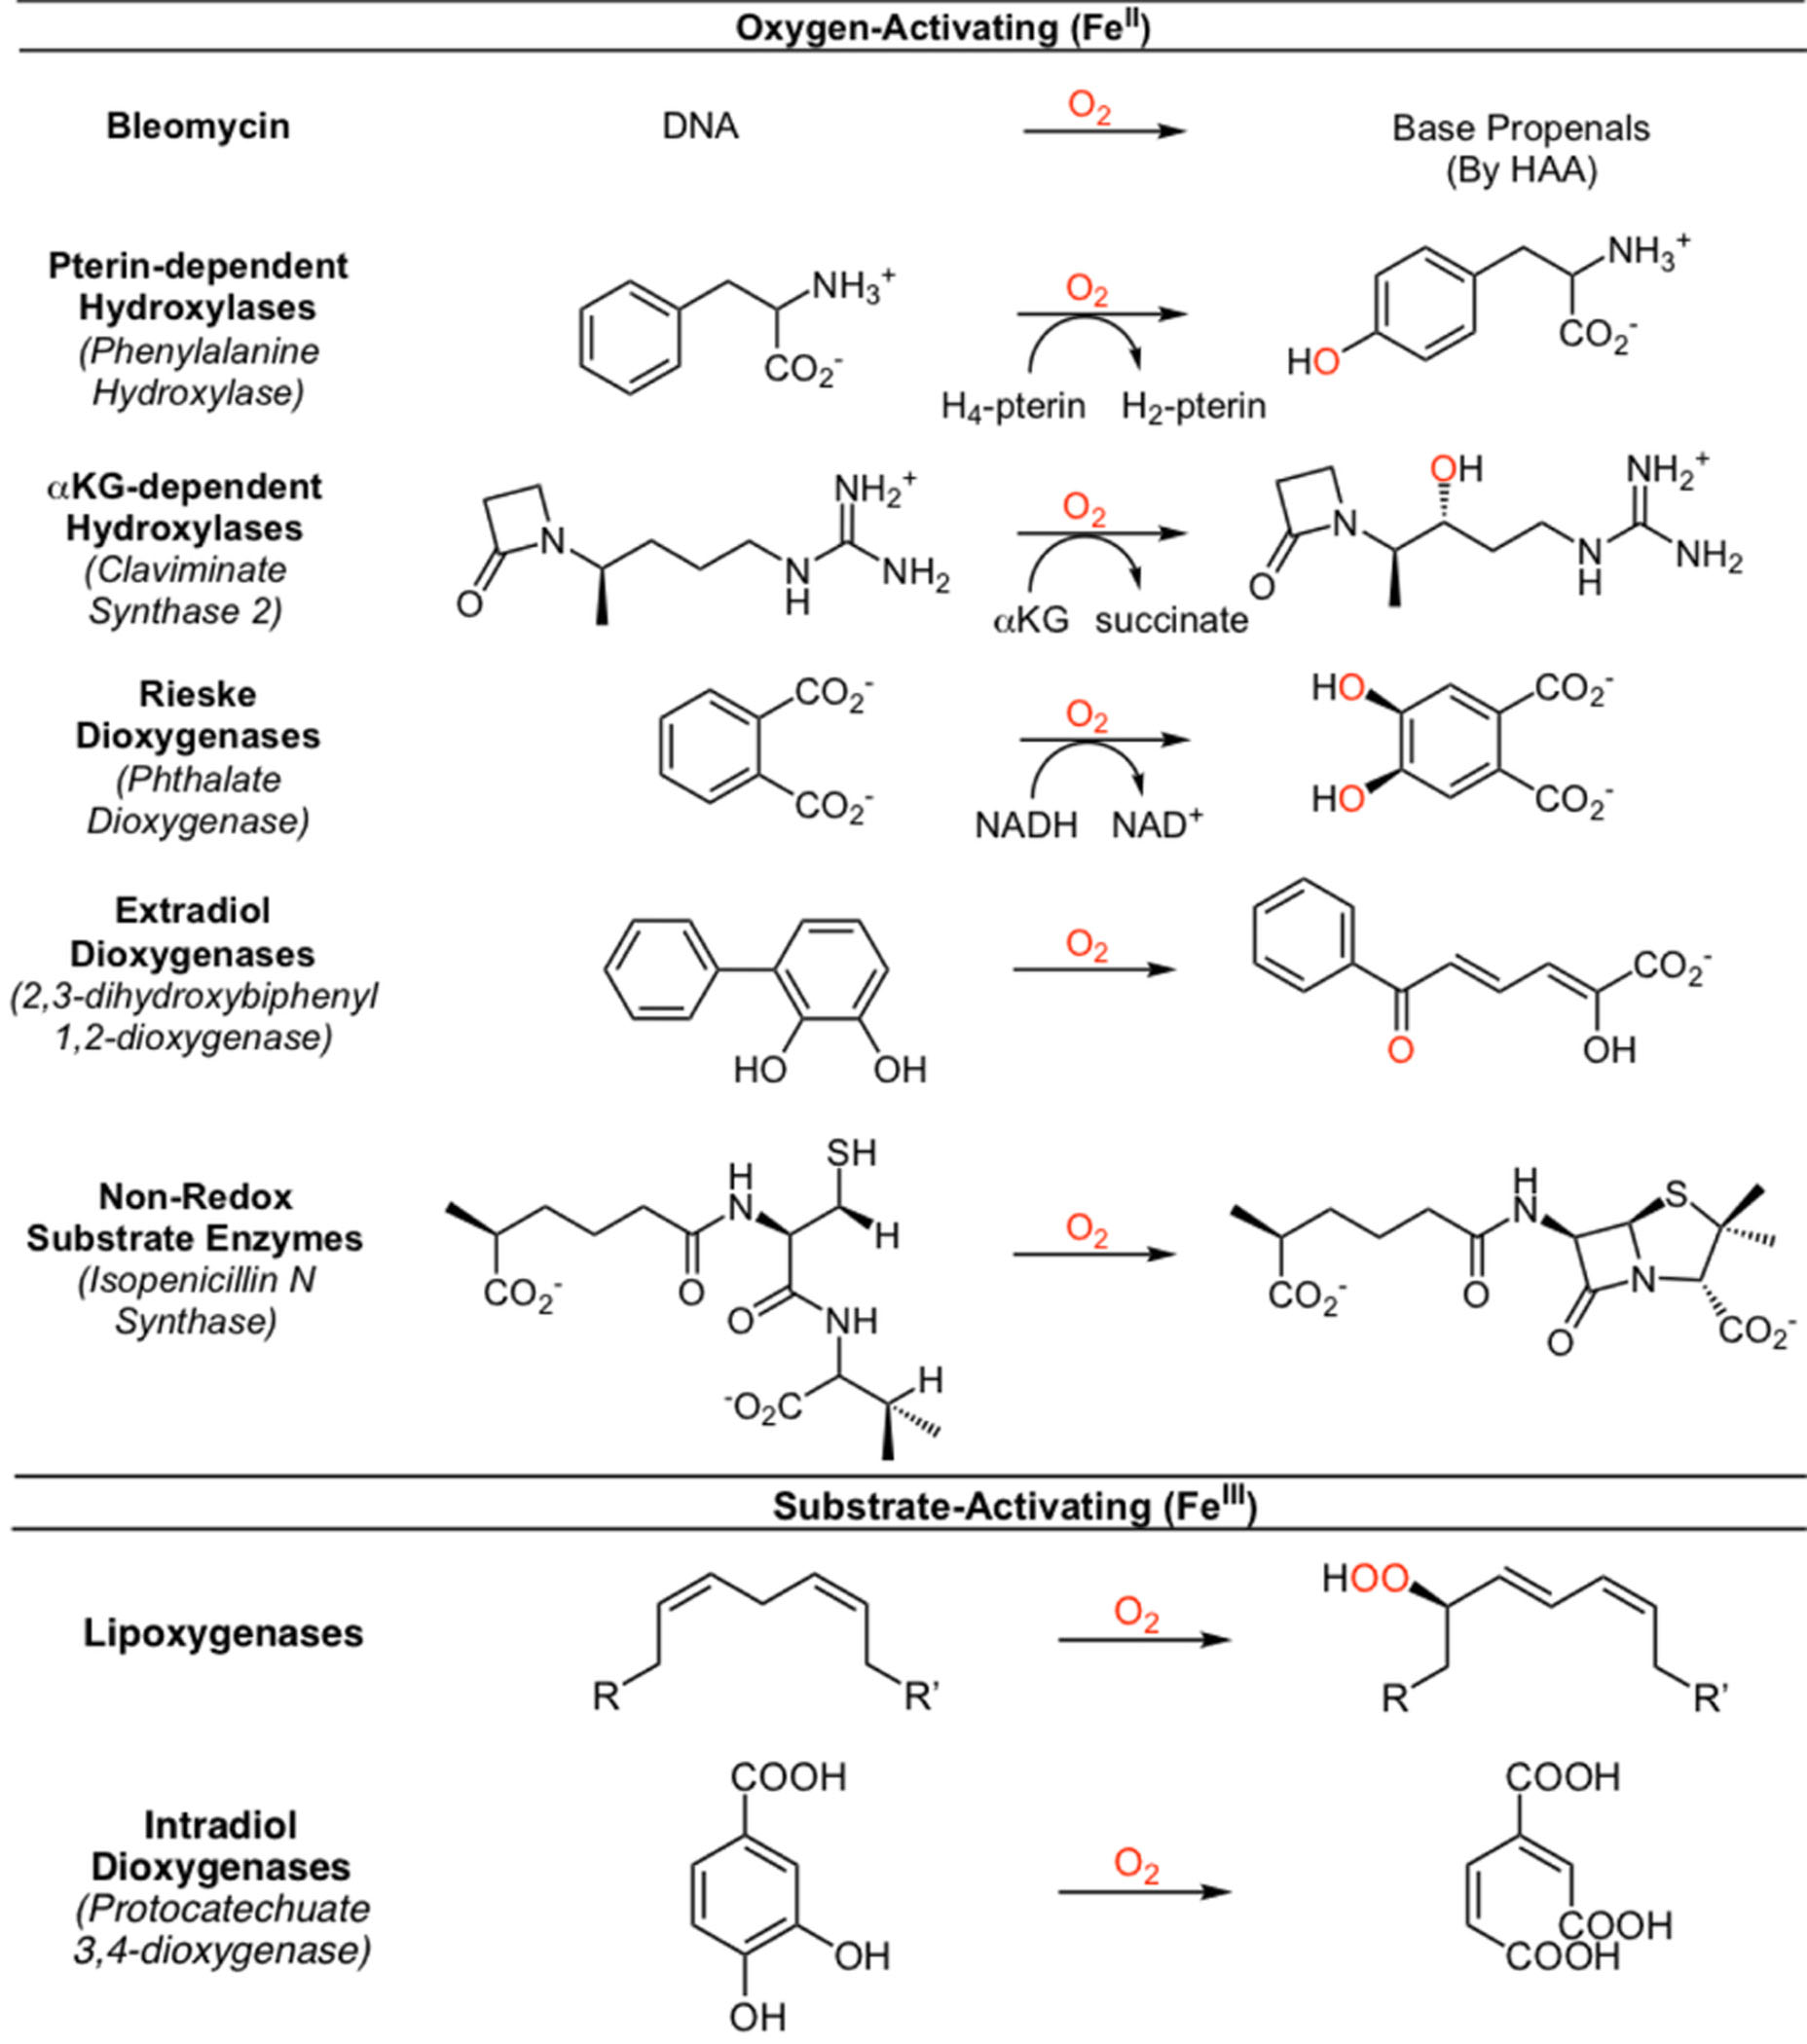
Mononuclear non-heme iron (NHFe) enzymes play important roles in DNA repair, hypoxia regulation, antibiotic and natural products biosynthesis and bioremediation.1–3 They catalyze H-atom abstraction (HAA) and electrophilic aromatic substitution (EAS) leading to monooxygenation, dioxygenation, desaturation and ring expansion, contraction or cleavage. The major classes of NHFe enzymes are listed in Table 1. While lipoxygenases and intradiol dioxygenases (Table 1, bottom) use FeIII sites to activate substrates, most of the classes of enzymes activate O2 using a high-spin (HS) FeII active site.4 These have been challenging to spectroscopically study as they do not have the intense π → π* absorption features of heme enzymes and they have S = 2 integer spin ground states, hence are non-Kramers ions that cannot generally be studied by electron paramagnetic resonance (EPR) spectroscopy. While Mossbauer is accessible, HS FeII quadrupole doublets are generally very similar. They do, however, have ligand-field (LF) transitions that are very sensitive to active site geometric structure.5
Table 1.
Classes of oxygen-activating (FeII) and organic substrate-activating (FeIII) mononuclear nonheme iron enzymes.
|
1. Structure/Function Correlations over FeII Active Sites
1.1. Ligand Field Theory (LFT)
As shown in Fig. 1A, a HS FeII d6 octahedral site has a 5T2g ground state and one spin allowed 5Eg excited state at 10Dq, which for the NHFe relevant N/O ligation is at ~10,000 cm−1.2 This 5Eg excited state is doubly degenerate and will split in energy in a low symmetry protein environment by up to 2,000 cm−1. Removal of an axial ligand leads to a 5-coordinate (5C) square pyramidal (SP) site with a larger splitting of the 5E predicting LF transitions at >10,000 and >5,000 cm−1. Distortion of the 5C LF to a trigonal bipyramidal (TBP) structure shifts these transitions down in energy to <10,000 and <5,000 cm−1. Removal of an additional ligand to form a 4C distorted tetrahedral site predicts only low energy spin allowed LF transitions in the 5,000 – 7,000 cm−1 region (i.e. ). Thus, as shown in Fig 1A, LF transitions from the quintet ground state to the components of the 5E excited state are diagnostic of the active site geometric structure. However, d → d transitions are parity forbidden, making them weak in absorption and the 12,000 – 5,000 cm−1 near-infrared (NIR) spectral region is obscured by protein vibrations, making absorption (Abs) spectroscopy inaccessible. However, the quintet, paramagnetic nature of the ground state enables study of the FeII site by magnetic circular dichroism (MCD) spectroscopy at low temperature (LT).2,5
Fig. 1.
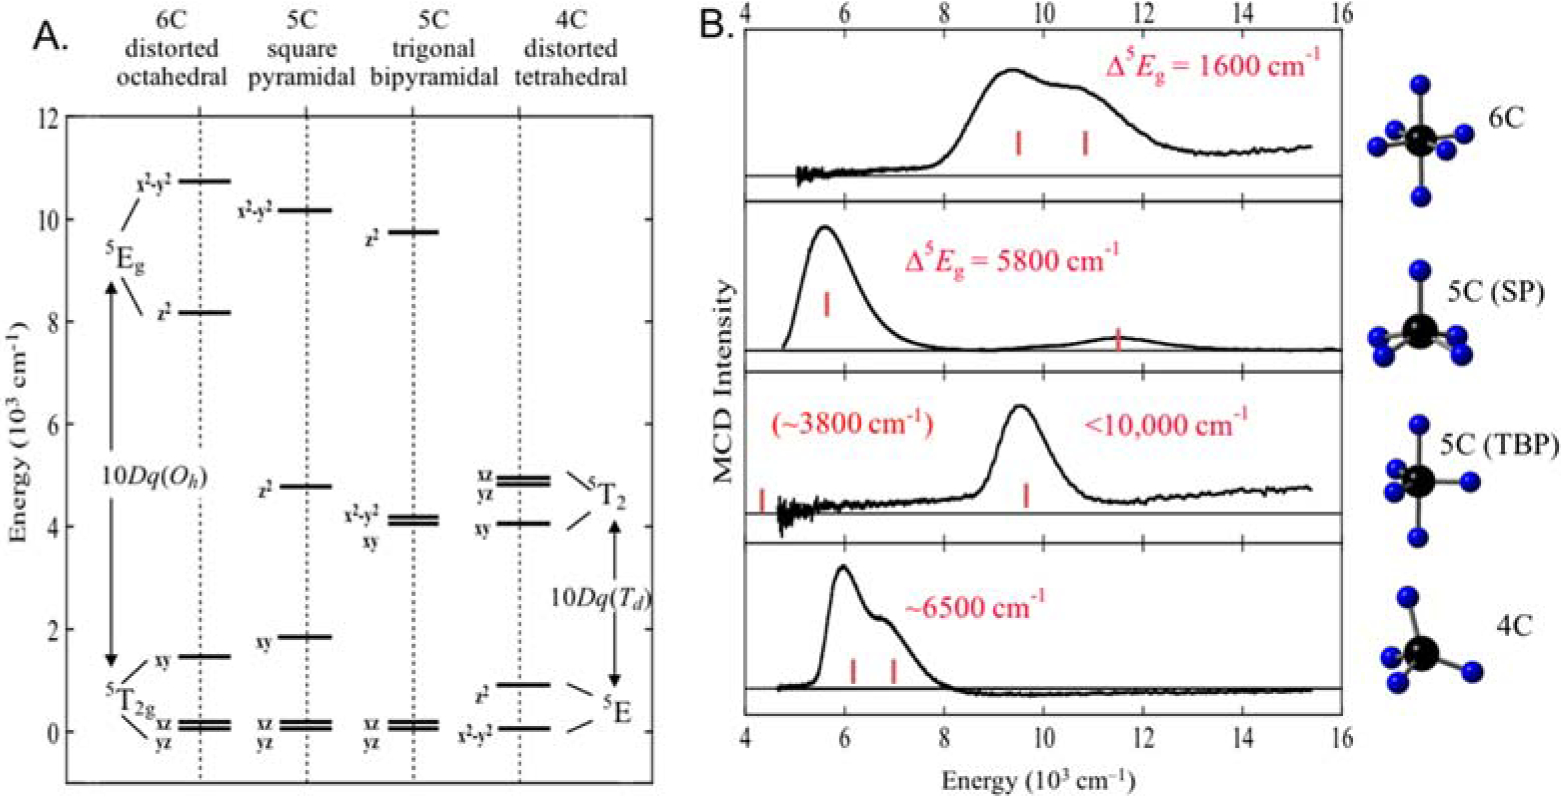
A) Theoretical LF d-orbital splittings for different FeII geometries. B) Representative LT MCD spectra for 6C distorted octahedral, 5C square pyramidal, 5C trigonal bipyramidal and 4C distorted tetrahedral non-heme Fe complexes. Adapted from Ref. 2.
1.2. Variable Temperature, Variable Field (VTVH) MCD Spectroscopy
Fig. 1B shows representative LT MCD spectra from a series of >20 structurally defined HS FeII complexes.6 These experimental data strongly support the predictions from LFT (from top to bottom): 6-coordinate (6C) sites have 2 LF transitions at ~10,000 cm−1 split by < 2,000 cm−1; 5C SP sites have LF transitions at >10,000 and >5,000 cm−1, 5C TBP at <10,000 and <5,000 cm−1 and distorted tetrahedral has only low energy LF transitions.6
From Fig 1A, the ground state is a 3-fold orbitally degenerate 5T2g that will also split in energy in different protein active site geometries and is particularly sensitive to π interactions with the ligands. This splitting can be obtained using the VTVH MCD methodology we have developed.2 As shown in Fig. 2A, at low temperature, increasing the magnitude of the magnetic field leads to an increase in amplitude of the MCD signal of a specific transition. This is plotted in Fig. 2B which shows that the MCD signal (plotted as H/T) increases linearly with increasing field and decreasing temperature until approaching large values of H/T when the signal level off and is considered “saturated”. This saturation magnetization behavior can be understood considering the simplest case of a S = 1/2 Kramers doublet ground state as shown in the inset in Fig. 2B. For S = 1/2, both the ground and excited states split in a magnetic field by gβH. As indicated in the inset, the MCD selection rule predicts 2 transitions of equal magnitude but opposite sign. At high temperature and low field, these mostly cancel. As one decreases the temperature and increases the field, the population of the MS = +1/2 component of the ground state decreases and the LCP (left circularly polarized) intensity increases initially linearly with H/T. However, at high field and low temperature only the MS = −1/2 sublevel of the ground state is populated, which saturates the MCD intensity. For a S = 1/2 Kramers doublet, the saturation magnetization isotherms obtained at different temperatures plotted as H/T will superimpose and behave as the Brillouin function for a S = 1/2 system.2,7
Fig. 2.
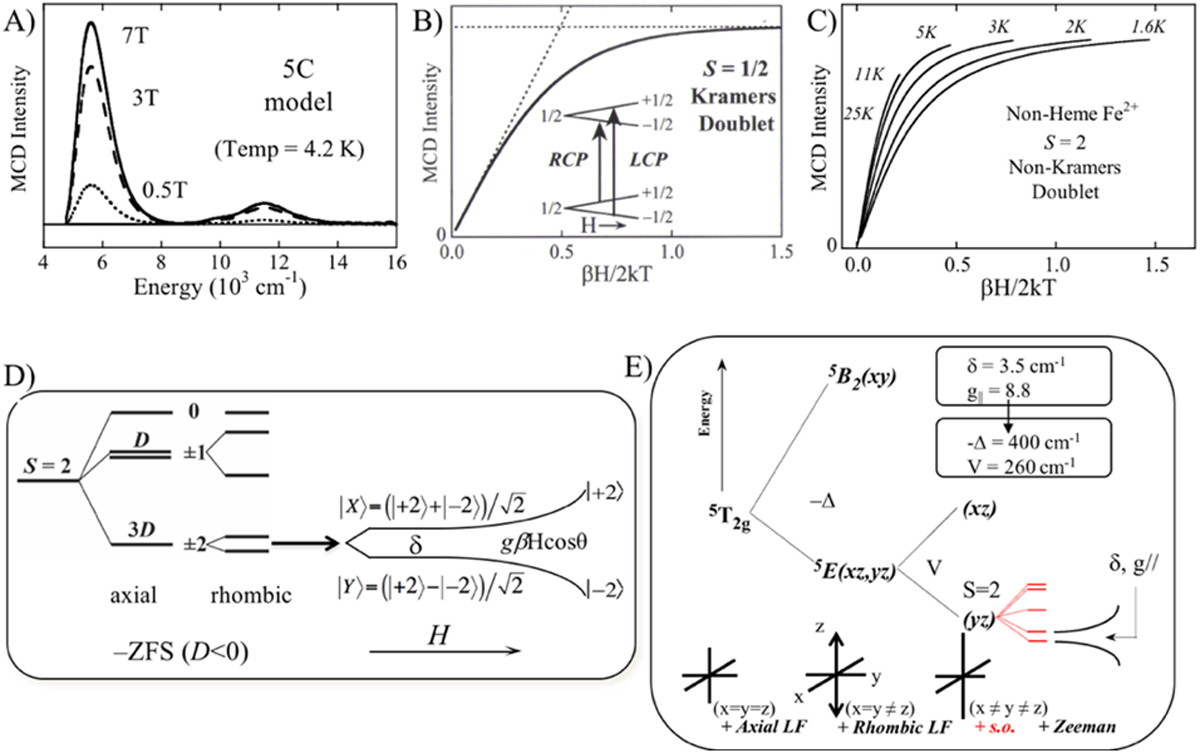
A) Field-dependence of MCD signal at LT. B) Saturation magnetization for an S = 1/2 Kramers doublet with signal plotted as a function of H/T. Inset shows Kramers doublet ground and excited states in a magnetic field and the two allowed MCD transitions between these states. C) Nested saturation magnetization isotherms for S = 2 non-Kramers system. D) Energy splitting diagram of a negative zero-field split S = 2 non-Kramers system depicting axial, rhombic and magnetic field splittings. Note that the |+2> and |−2> wavefunctions equally mix at zero magnetic field and then change to pure |+2> and |−2> at high field. E) LF splitting diagram for 5T2g ground state depicting the effects of axial and rhombic distortions, spin-orbit coupling (+ s.o.) and magnetic field Zeeman splittings. Adapted from Ref. 2.
However, for the non-Kramers S = 2 FeII protein sites, this behavior is no longer observed and instead there is a spread or nesting in the saturation magnetization isotherms (Fig. 2C) reflecting the non-Kramers nature of the S = 2 ground state. As shown in Fig 2D, when S > 1/2, the ground state (2S+1) degeneracy will split in the absence of a magnetic field due to zero-field splitting (ZFS). A negative axial ZFS is shown in Fig 2D leading to a MS = ±2 at lowest energy (the case of a positive ZFS is given in Ref. 8). Only for non-Kramers doublets, this ±MS axial degeneracy will further split in energy in the absence of a magnetic field in less than axial symmetry (i.e. a rhombic splitting). This splits the MS ±2 by δ (in Fig. 2D) and mixes these wavefunctions. Application of a magnetic field both further splits the sublevels (by gβH) and also changes the wavefunctions to pure |−2> and |+2> at high magnetic fields. This non-Kramers doublet behavior in Fig. 2D ([right], i.e. the splitting of the non-Kramers doublet at zero field [δ] and the change in wavefunctions with increasing magnetic field) is responsible for the nested set of saturation magnetization isotherms in Fig. 2C and the data can be fit to this model to acquire experimental values for the δ and g|| parameters. Thus, we use an excited state to probe the ground state and obtain spin Hamiltonian EPR parameters (SHP) for an EPR inactive active site. As shown in Fig. 2E, we can further analyze these SHPs to obtain the axial (Δ = dxz,yz – dxy) and rhombic (V = dxz – dyz) splittings of the 5T2 set of dπ orbitals of the FeII active site. Thus, for the complexes given in Fig. 1B, we experimentally obtained the LF splitting of the d-orbitals (Fig. 3) giving the geometric and electronic structure of non-heme FeII active sites.2,5 This has been used to obtain molecular level insight into metalloenzyme catalysis as illustrated below.
Fig 3.
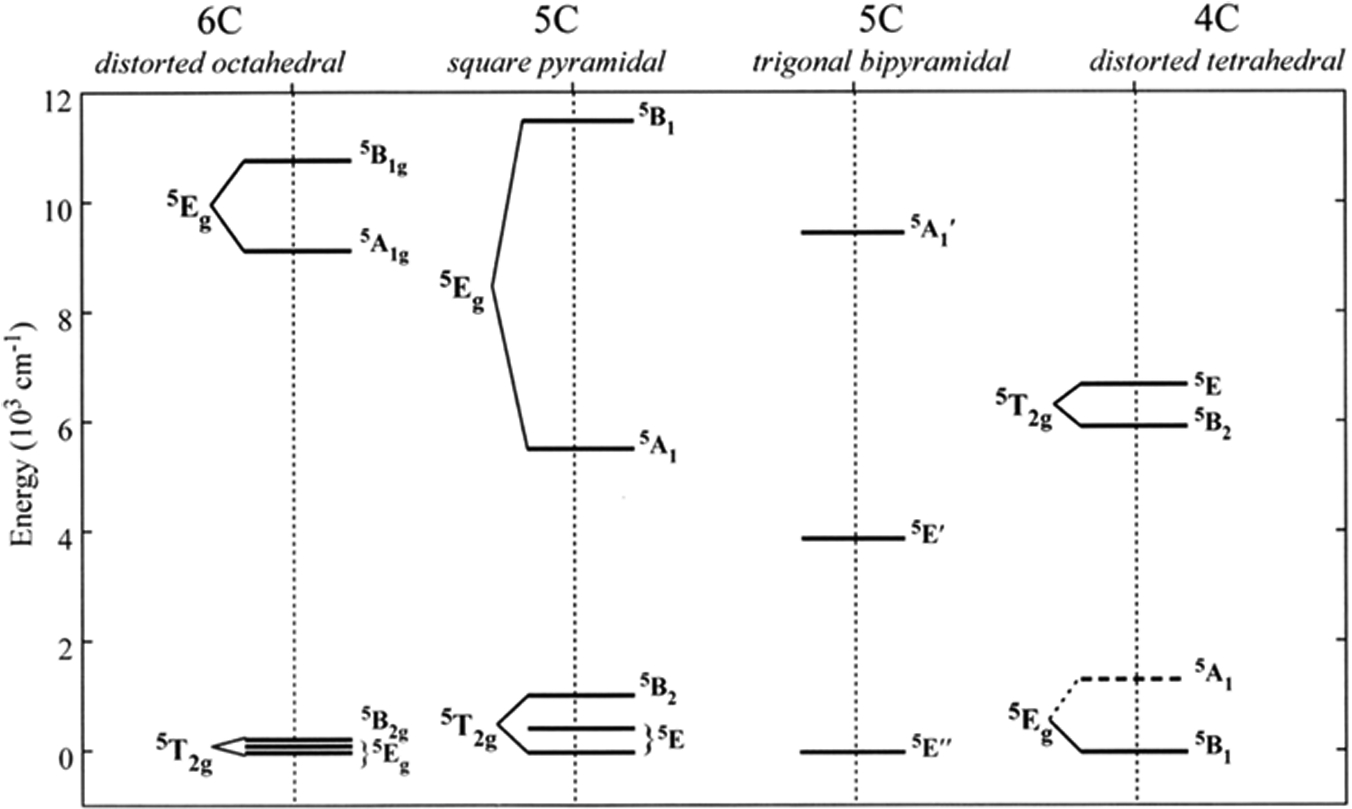
Experimental d-orbital LF splitting of the nonheme FeII models in Fig. 1B. Adapted from Ref. 6.
1.3. General Mechanistic Strategy
Fig 4 shows the VTVH MCD data and analysis for phenylalanine hydroxylase (PAH)9, a member of the pterin-dependent class of NHFe enzymes in Table 1. The LT MCD spectrum for the resting FeII site of PAH in Fig 4A (black) shows 2 LF transitions at ~10,000 cm−1 split by <2,000 cm−1 indicating a 6C FeII site. Binding substrate (L-phe) to the protein pocket in the vicinity of the FeII site in Fig. 4A (blue) only slightly perturbs the LF transitions. Binding pterin (green) cofactor also has only a small effect (Fig. 4A, green); these were the first data that demonstrated that the pterin cofactor does not bind directly to the FeII. Importantly, simultaneous binding of both substrate and cofactor produces the red MCD spectrum in showing transitions at ~10,000 and ~5,000 cm−1 indicating that the FeII active site has gone 5C. This is also observed in the VTVH MCD saturation magnetization plots in Fig 4B where resting (or substrate or cofactor only bound) sites show a nesting behavior (in black) giving a small splitting of the 5T2 ground state (bottom left in Fig 4C), while substrate plus cofactor binding leads to a large change in the nesting behavior (Fig 4B, red) indicating a large splitting of the 5T2 ground state (bottom right in Fig 4C). The combination of excited and ground state MCD data lead to the energy level diagrams in Fig 4C. For resting (or substrate or cofactor bound) PAH, the FeII has a larger 10Dq and small splittings of the 5E and 5T2 states while upon substrate plus cofactor binding (right of Fig 4C, red), 10Dq decreases and both the 5E and 5T2 splittings greatly increase; thus indicating that the FeII site has gone 5C.9
Fig. 4.
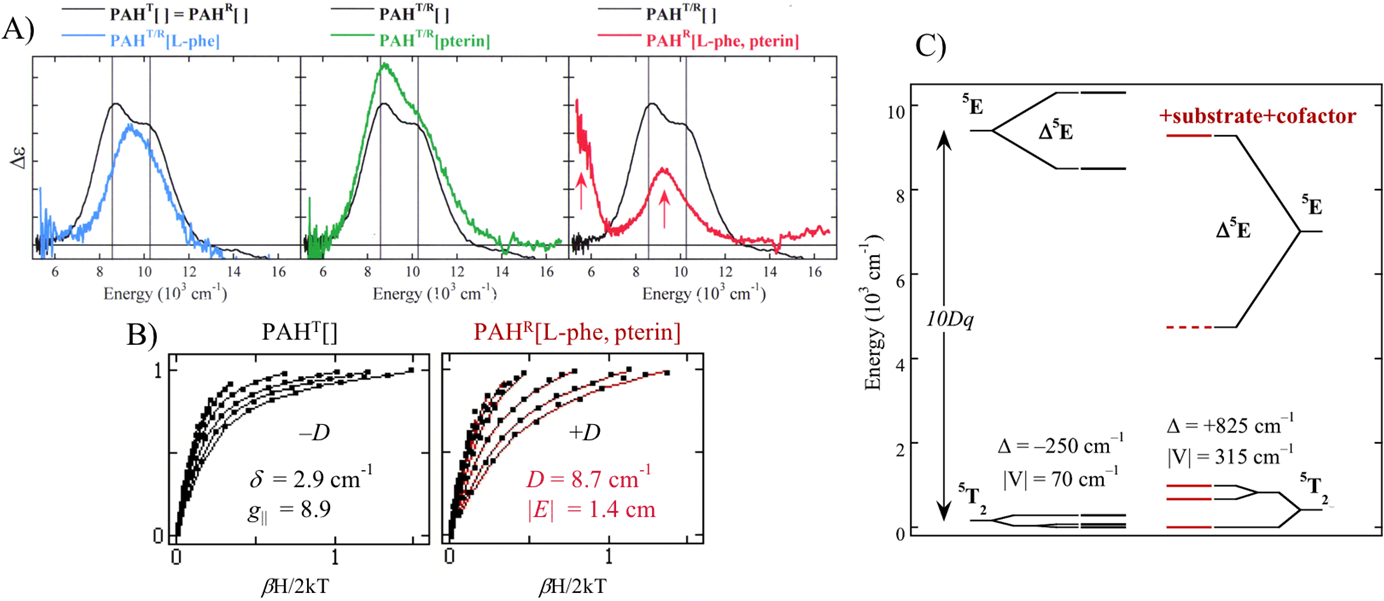
A) LT MCD spectra of resting PAH (black), substrate-bound PAH (blue), cofactor-bound PAH (green) and substrate plus cofactor bound PAH (red). B) Saturation magnetization data for resting PAH (black, left) and substrate plus cofactor bound PAH (red, right). C) VTVH MCD obtained LF splitting of d-orbitals in resting PAH (black, left) and substrate plus cofactor bound PAH (red, right). Adapted from Ref. 9.
Parallel behavior has been observed for all the different classes of NHFeII enzymes10–14 in Table 1 and is summarized in Fig. 5. The resting, substrate-bound or cofactor-bound sites are 6C, coordinatively saturated and relatively stable in the presence of oxygen. However, upon binding of both substrate and cofactor, the site goes 5C, opening a coordination position for O2 activation only in the presence of both cosubstrates. Thus, nature has evolved a general mechanistic strategy for efficient coupled turnover to avoid autooxidation and self-hydroxylation.
Fig. 5.
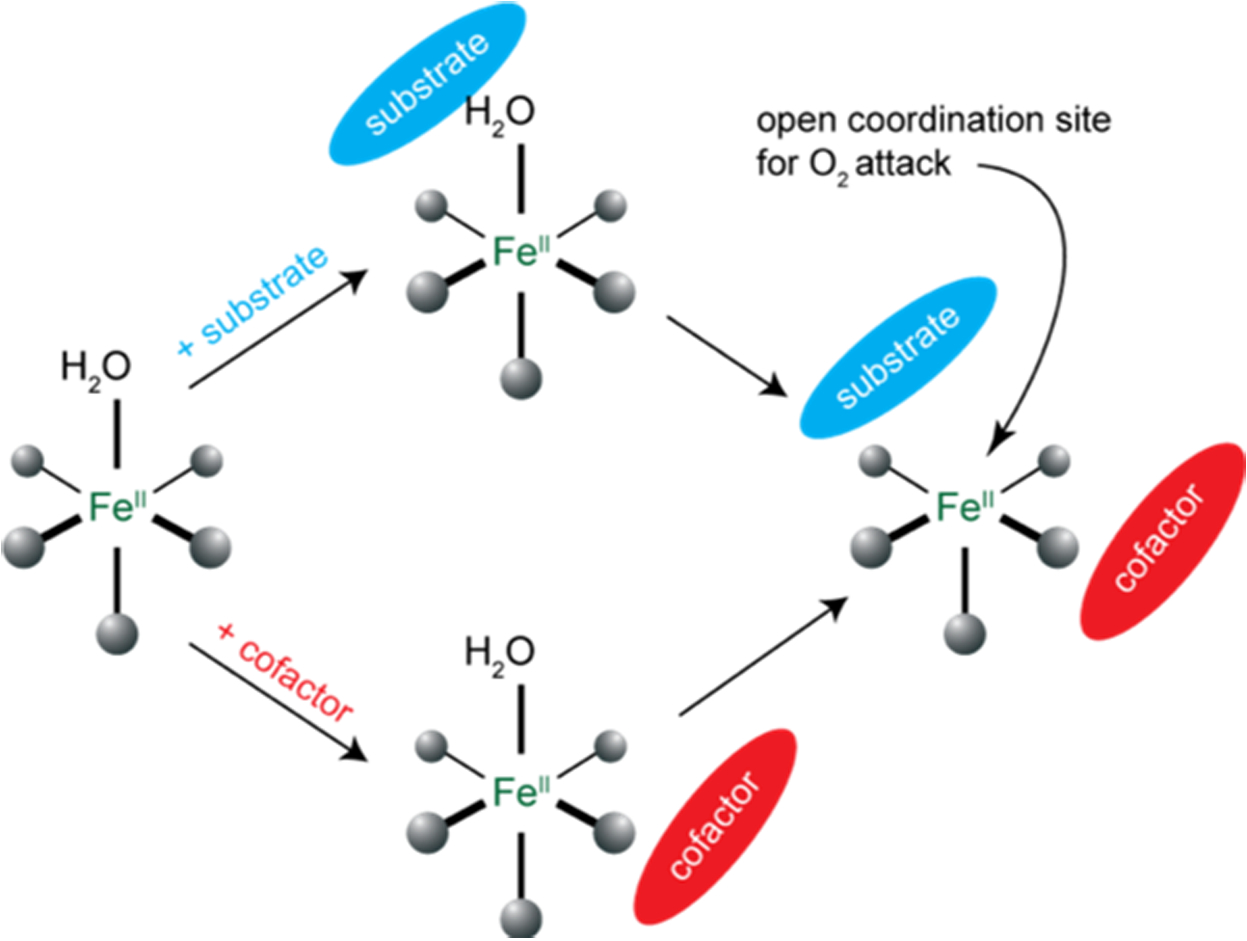
General Mechanistic Strategy observed in mononuclear NHFe enzymes. Adapted from Ref. 1.
Once the 5C site forms, reaction with O2 generates intermediates that are key in substrate reactivity. In section 2, we consider the 2-electron reduction of O2 to an FeIII-OOH intermediate (one electron from the Fe- and another from an exogenous source). In section 3, we focus on O2 reduction by 4 electrons to generate FeIV=O intermediates (2 electrons from FeII and 2 electrons from the cofactor).
2. O2 Activation – Low-Spin (LS) FeIII-OOH Intermediate – Nonheme vs Heme Reactivity
Bleomycin (BLM) is an anticancer drug that deviates from the NHFeII enzymes in Table 1 in having all N ligation with one open site for O2 binding producing a low spin oxy site. This parallels heme chemistry but the BLM ligation (5-nitrogen based ligands – modified histidine, pyrimidine and amide) does not have the π-delocalization of the porphyrin ring. Thus, BLM bridges between non-heme and heme in O2 activation. From equation 1, FeII-BLM binds O2 and an exogenous electron to generate activated BLM (ABLM), the last observable intermediate before HAA from DNA in its anticancer activity.15 We and others have assigned ABLM as a LS FeIII-OOH complex with the geometry optimized structure shown in Fig 6A.13,16–19 As shown in equation 2, this parallels heme chemistry where, in P450, compound 0 is also a LS FeIII-OOH. This intermediate is well defined20 to protonate and heterolytically cleave to generate compound I, an FeIV=O with a 1-electron oxidized porphyrin radical. This reaction is calculated to be highly exergonic depending on the source of the proton (−58 kcal/mol from water). Performing the parallel calculation of protonation and heterolytic cleavage from ABLM also give an FeIV=O with a 1-electron oxidized BLM ligand. However, this reaction is 70 kcal/mol less favorable and endergonic by at least 13 kcal/mol (proton from solvent). This large energy difference reflects the fact that, in heme chemistry, the electron hole is delocalized over the porphyrin ring and the porphyrin ligand is a dianion. This can be seen explicitly from the lowest energy ligand-to-metal charge transfer (LMCT) transition for the FeIII heme relative to FeIII-BLM (Fig. 6B, assigned from MCD) where the BLM CT transition is higher in energy by 54 kcal/mol. Alternatively, evaluation of the thermodynamics of the direct reaction of ABLM with DNA (equation 3B) indicated a >20kcal/mol more favorable reaction, exergonic by 7 kcal/mol.21
Fig 6.
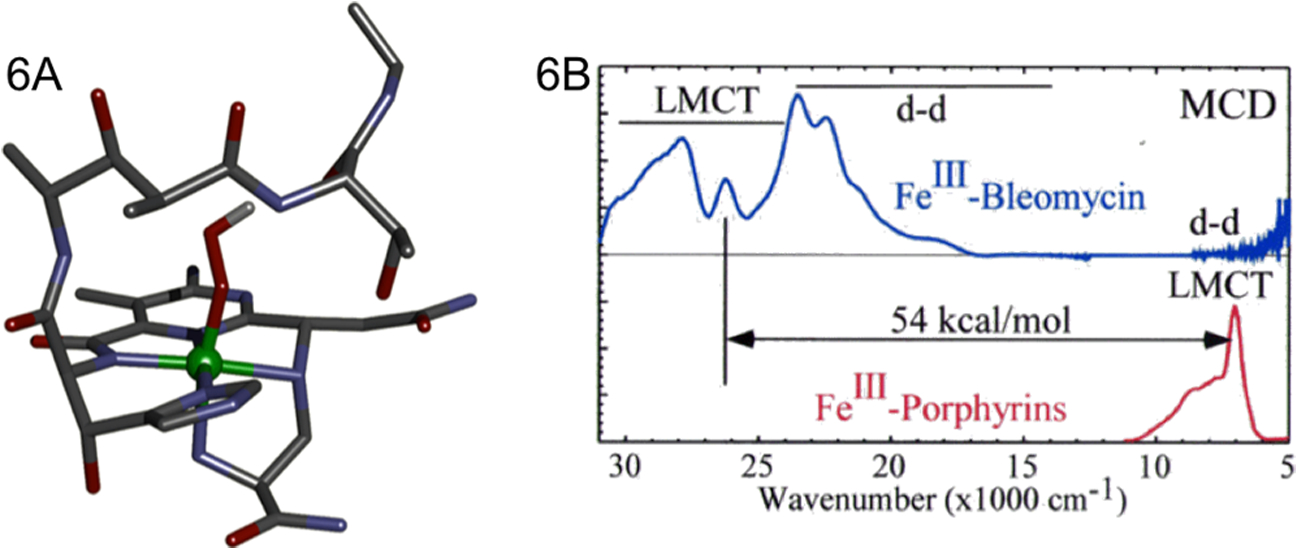
A) Geometry optimized structure of ABLM. B) MCD spectra of FeIII-Bleomycin (blue) and FeIII-Porphyrins (red) with LMCT transitions assigned. Adapted from Refs. 26 and 17 respectively.
This, however, is not in agreement with the prediction from a computational study22 focusing on the peroxide shunt reaction where ABLM is generated by addition of hydrogen peroxide to LS FeIII-BLM (equation 4). From these calculations, that assume a water ligand in LS FeIII-BLM, H2O2 would bind in the diprotonated state. The extra proton that would already be present in this model of ABLM lowers the heterolytic cleavage energy by 15 kcal/mol and this becomes competitive with the direct reaction of ABLM with the H-C bond of DNA (equation 3B). Thus, the issue was the nature of the axial ligands in FeIII-BLM and ABLM. This would normally be probed by resonance Raman (rR) spectroscopy, however ABLM does not have a unique feature in absorption (needed for rR) and is unstable in the laser beam. So, instead we pursued nuclear resonance vibrational spectroscopy (NRVS) studies at SPring8. This spectroscopy uses 3rd generation synchrotron radiation to probe the nuclear Mossbauer transition of 57Fe, but also obtains the vibrational sidebands to higher energy by >600 cm−1. This reveals all vibrations associated with Fe motion.23,24
| Eqn 1: |
| Eqn 2: |
| Eqn 3A: |
| Eqn 3B: |
 |
Eqn 4: |
The NRVS spectrum for FeIII-BLM and ABLM are shown at the top of Fig 7A and 7B respectively, where the intensity reflects the amount of Fe motion in a normal mode of vibration at a given energy. Below the spectra in Fig. 7A and 7B are the predicted NRVS spectra for the two possible axial ligands using a DFT (density functional theory) approach we developed that was calibrated to NRVS data using structurally defined model complexes.25 From Fig. 7A, the NRVS spectrum of FeIII-BLM shows an 16/18OH2 sensitive vibration at 567 cm−1. From this high frequency, the axial ligand in LS FeIII-BLM is a hydroxide and not a water. The most intense feature in the NRVS spectrum of FeIII-BLM (Fig. 7A, top) is the peak at 407 cm−1, which reflects a degenerate pair of trans-axial bends (Fig. 7C, middle) where the Fe moves in the opposite direction of the axial ligands. In the NRVS spectrum of ABLM, these trans-axial bends split in energy by 40 cm−1 and there is a new low energy feature at 328 cm−1. This splitting is only reproduced by a monoprotonated FeIII-OOH structure (Fig. 7B, bottom simulation) where the low energy mode is the O-O-Fe bend (Fig 7C top) that interacts with the in plane trans-axial bend (Fig. 7C middle right) and thus splits the trans-axial modes. This assignment eliminates the possibility of heme like chemistry of protonation and heterolytic cleavage as it is not thermodynamically favorable (equation 3A and 4 [top]).26
Fig 7.
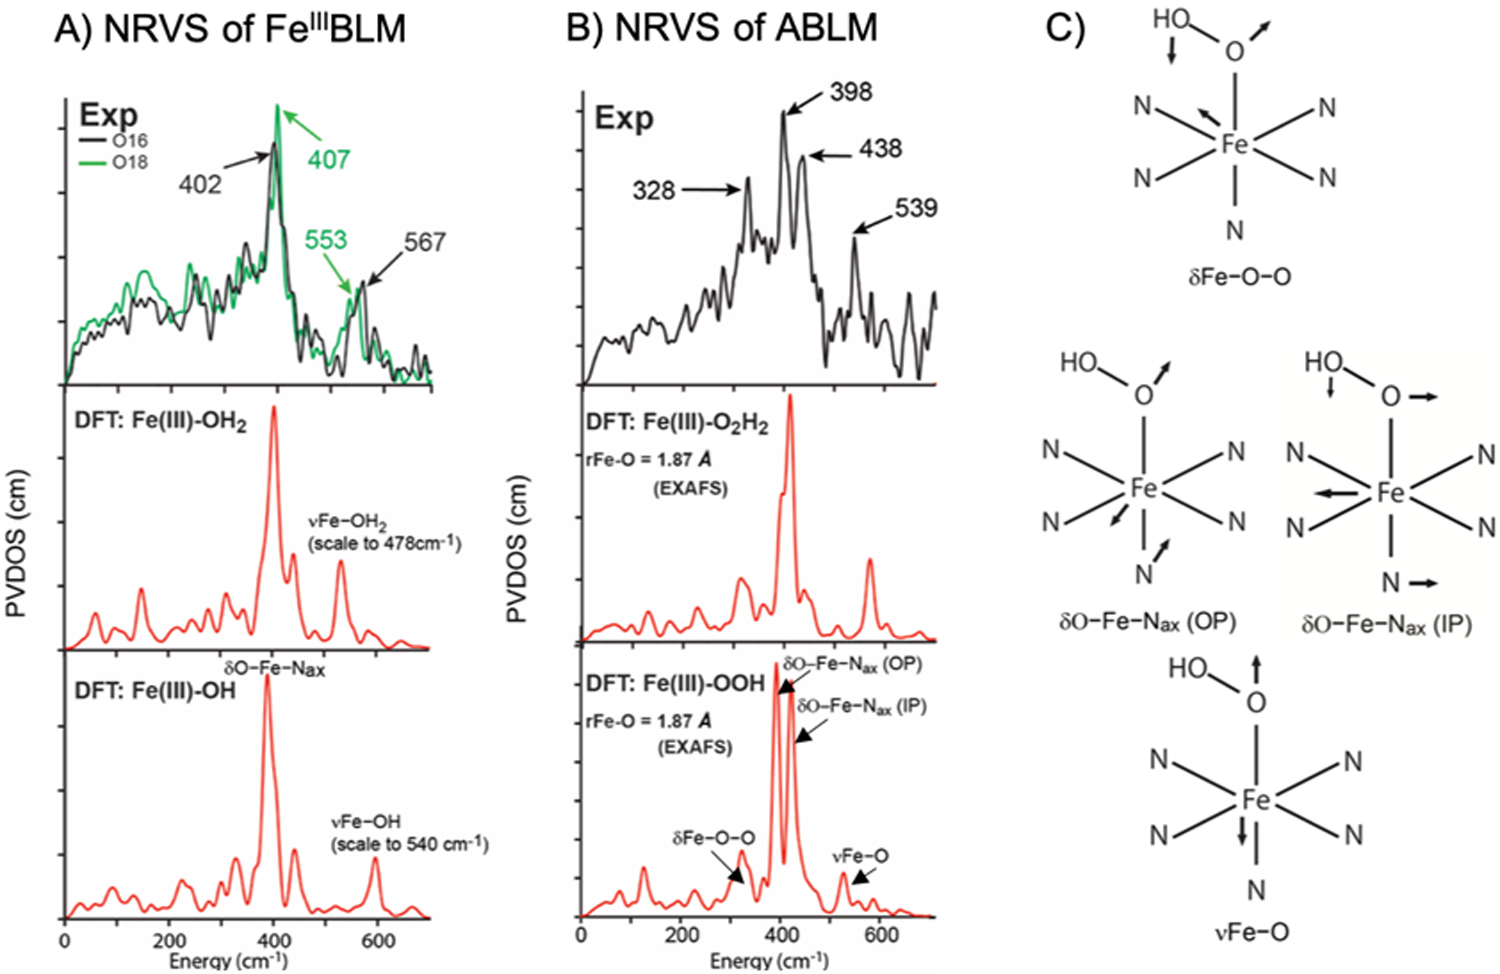
A) NRVS spectrum of FeIII(BLM) in 16O (black) and 18O (green) and DFT simulations of (BLM)FeIII-OH2 (second panel) and (BLM)FeIII-OH (third panel). B) NRVS spectrum of ABLM in black and DFT simulations of (ABLM)FeIII-O2H2 (second panel) and (ABLM)FeIII-OOH. C) Vibrational modes of the FeIII-OOH model of ABLM depicting the Fe-O-O bend, in-plane and out-of-plane trans-axial bends and Fe-O stretch. Adapted from Ref. 26.
The direct HAA reaction of ABLM with DNA requires that the DNA substrate participate in the transition state (TS) and should impact the decay rate of ABLM (equation 3B). This had not been studied in stopped-flow Abs spectroscopy as there is not a suitable Abs feature associated with ABLM. However, there is a CD feature at 450nm unique to ABLM (inset in Fig 8) that was used to measure the kinetic effect of DNA on the decay of ABLM.21,27 As shown in Fig 8, DNA accelerates this rate by more than a factor of two (0.044 s−1 for ABLM + DNA decay compared to 0.018 s−1 for ABLM decay). The primary kinetic isotope effect (KIE) of the self-decay (kH/kD = 3.6) is rather small (involving an exchangeable N-H on the BLM ligand) while the secondary KIE in the reaction of ABLM with DNA (C-H not exchangeable) is large (kH/kD = 1.7).
Fig 8:
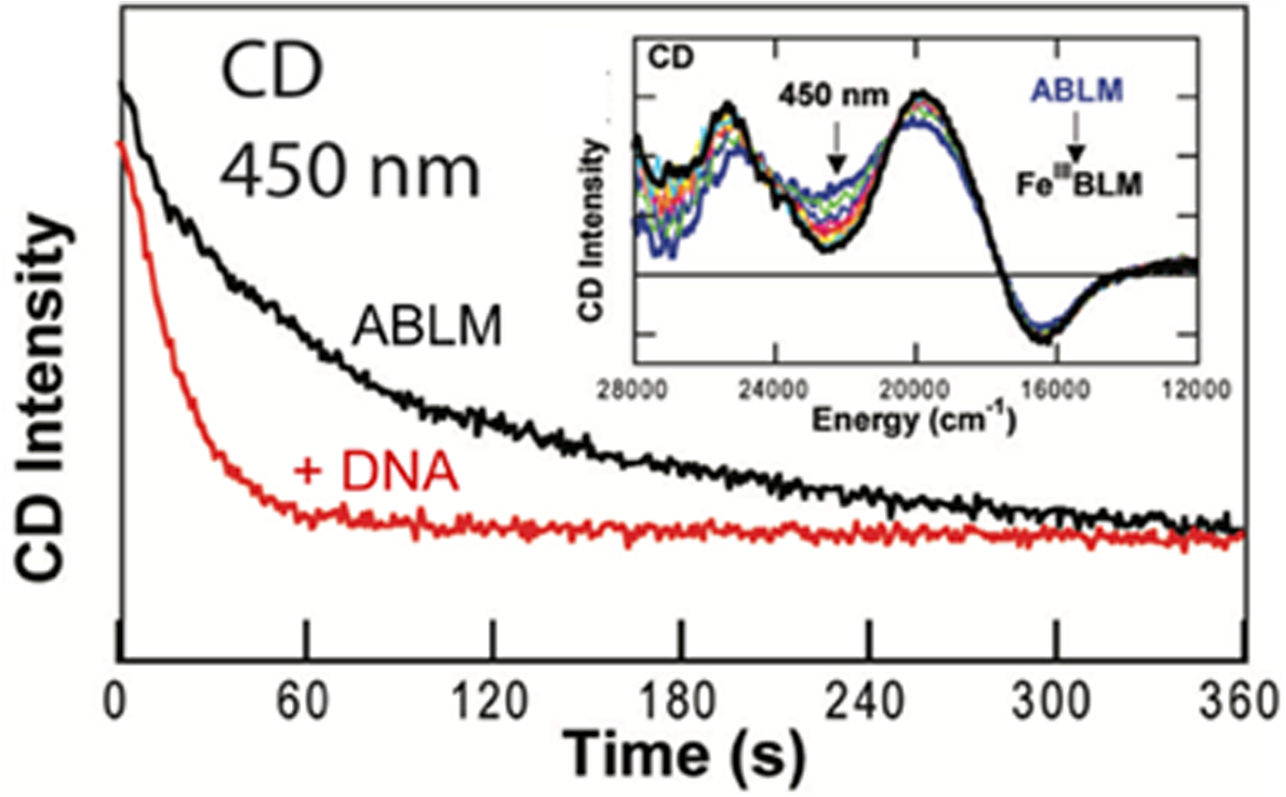
CD kinetics of the effect of DNA (red) on the decay of ABLM (black). Inset shows decay of ABLM with time using the 450nm CD feature. Adapted from Ref. 21.
Having detailed the reaction of ABLM with DNA experimentally, we also evaluated it computationally. In Fig. 9A, we describe this by a 2D potential energy surface where one dimension is HAA by the distal O of the hydroperoxide and the second very important dimension is O-O cleavage (axis on the right). The reaction goes from the front to the diagonal at the back and gives a TS about half that predicted by heme like protonation and O-O cleavage in ABLM (13 for direct vs 22–30 kcal/mol for protonation/cleavage). The TS is consistent with the small primary and larger secondary KIE in that it (Fig 9A right) is very late in O-O cleavage (this bond increases from 1.45 to 2.7 Å at the TS) and early in HAA. This reflects the behavior of the key frontier molecular orbital (FMO) of the LS FeIII-OOH complex at the TS. From Fig. 9B, the FMO is the σ* of the hydroperoxide. At the long O-O distance of the TS in Fig 9A right, the σ bond is lost and the α,β electron holes localize: one on the distal “O” that is basically a OH• well oriented for HAA from the H-C of DNA, and the second hole on the proximal “O” generating an FeIV=O, which, as shown in Fig. 9C, can perform a 2nd HAA with a low barrier.27 This produces double strand DNA cleavage, which is key to the anticancer activity of this drug.28
Fig 9:

A) 2D potential energy diagram for direct HAA by ABLM; TS structure at right. B) ABLM α and β spin FMOs (σ* in reactants [left], loss of σ bonding at TS [right]). C) TS for 2nd strand DNA cleavage by Fe(IV)=O S=1 produced by direct reaction of ABLM (FeIII-OOH) with DNA model. Adapted from Ref. 27.
3. O2 Activation – FeIV=O Intermediates
The αKG- and pterin-dependent classes of NHFeII enzymes in Table 1 react with O2 to generate FeIV=O intermediates (i.e. 2 electrons from cofactor and 2 electrons from FeII).29,30 These enzyme intermediates are high-spin FeIV=O S = 2 species. These have generated much interest in models and now structurally defined FeIV=O S = 1 and S = 2 model complexes31–34 are available that enable experimental definition of key FMOs involved in reactivity.
3.1. Spin State Dependence of FeIV=O FMOs
The first structurally defined FeIV=O complex was the TMC/acetonitrile complex pictured at the bottom right of Fig. 10A, which has an S = 1 ground state (by Que Jr. and colleagues).31 This site is 6C, thus the eg orbitals are above the t2g orbitals by 10Dq; however, the strong oxo ligand (1.64Å bond length) perturbs this site to a C4v geometry. The oxo pz has a strong σ bonding/antibonding interaction with the dz2 orbital and the oxo px,y (perpendicular to the O-Fe bond) has strong π bonding/antibonding interactions with the dxz,yz π orbitals. This leads to the energy splitting in the middle of the MO diagram in Fig. 10A.35 FeIV is d4 and populating the d valence orbitals with an S = 1 ground state gives a dπ* β-LUMO (lowest unoccupied MO) that is the FMO key in reactivity (HAA or EAS). Our studies focused on probing this FMO experimentally through the excitation of a non-bonding dxy electron into the dxz/yz π* FMO. This is a d → d transition and is in the 12,000 cm−1 region but does not provide much insight from its absorption spectrum (Fig. 10B, top). However, the corresponding variable temperature (VT) MCD data in Fig 10B (middle) provide fundamental insight into its electronic structure and reactivity. The band at 12,000 cm−1 in absorption, in fact, has three overlapping d → d transitions as revealed by the VT MCD data. Band III at highest energy starts out with little intensity at low temperature and high field (blue spectrum) but increases in intensity with increasing temperature. Alternatively, band I, a broad positive band at lowest energy, starts intense in MCD at low temperature but decreases in intensity with increasing temperature. These differences in temperature dependent MCD reflect the different polarizations of the LF transitions (see Fig 10B and caption text).36 Importantly, the negative sharp structure of band II starts weak at low temperature and increases in negative MCD intensity with increasing temperature. This enables its assignment as the lowest energy x,y polarized transition which is the dxy (non-bonding [n.b.]) → dxz/yz π* transition with the sharp features being vibronic structure in the Fe-O vibration experimentally defining how this bond changes (i.e. the FMO is activated) in this excited state.
Fig 10:
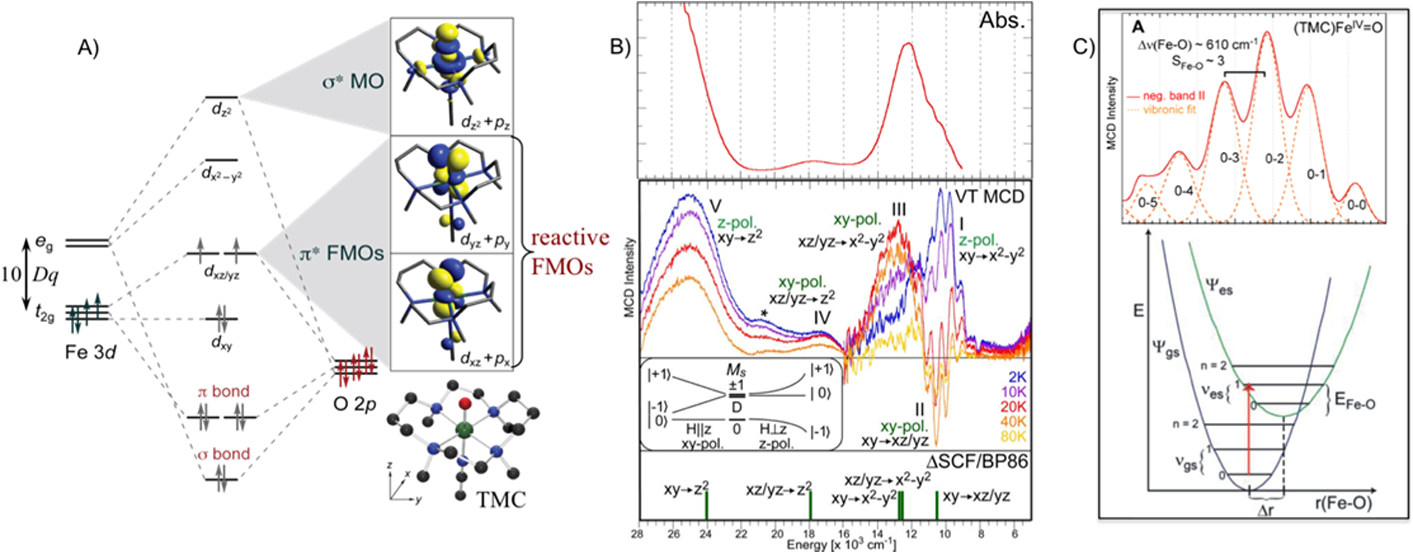
A) FMOs of S = 1 (TMC)FeIV=O. B) Abs (top) and VT MCD (top middle) spectra of (TMC)FeIV=O. Inset shows ground state spin-manifold depicting MS sublevels and MCD selection rules that determine polarization based on temperature-dependent MCD behavior. xy-polarized transitions have MS = 0 lowest in energy and have low MCD intensity at low temperature that increases with temperature (population of MS = −1). z-polarized transitions have MS = −1 character in ground sublevel and MCD intensity at low temperature that decreases with increasing temperature. (Bottom) DFT predicted transitions. C) (Top) Vibronic progression of band II (plotted positive). (Bottom) Ground and excited state potential energy surfaces for non-bonding → dπ* transition along Fe-O bond. Adapted from Refs. 35 and 36.
This vibronic band abstracted from the overlapping spectra and plotted as a positive progression is given in Fig. 10C (top).36 This is a Franck-Condon (FC) progression reflecting the excited state distortion that occurs upon excitation of a non-bonding electron into the dxz/yz FMO (Fig. 10C, bottom). The Fe-O frequency has decreased from 830 cm−1 in the ground state to 610 cm−1 in the dπ* FMO reflecting a major decrease in the strength of the bond. This is also reflected in the intensity distribution over the FC progression which fits to a distortion of the FeIV=O bond from 1.65Å in the ground state to 1.77Å in the dπ* excited state. These data experimentally show a strong π-bonding interaction between the oxo pπ and the dπ* FMOs. This results in significant oxo pπ character mixed into the dπ orbital (Fig 11A) that activates the FeIV=O for reaction perpendicular to the Fe-O bond.36 This is the FMO active in reactivity for S = 1 FeIV=O species.
Fig 11.
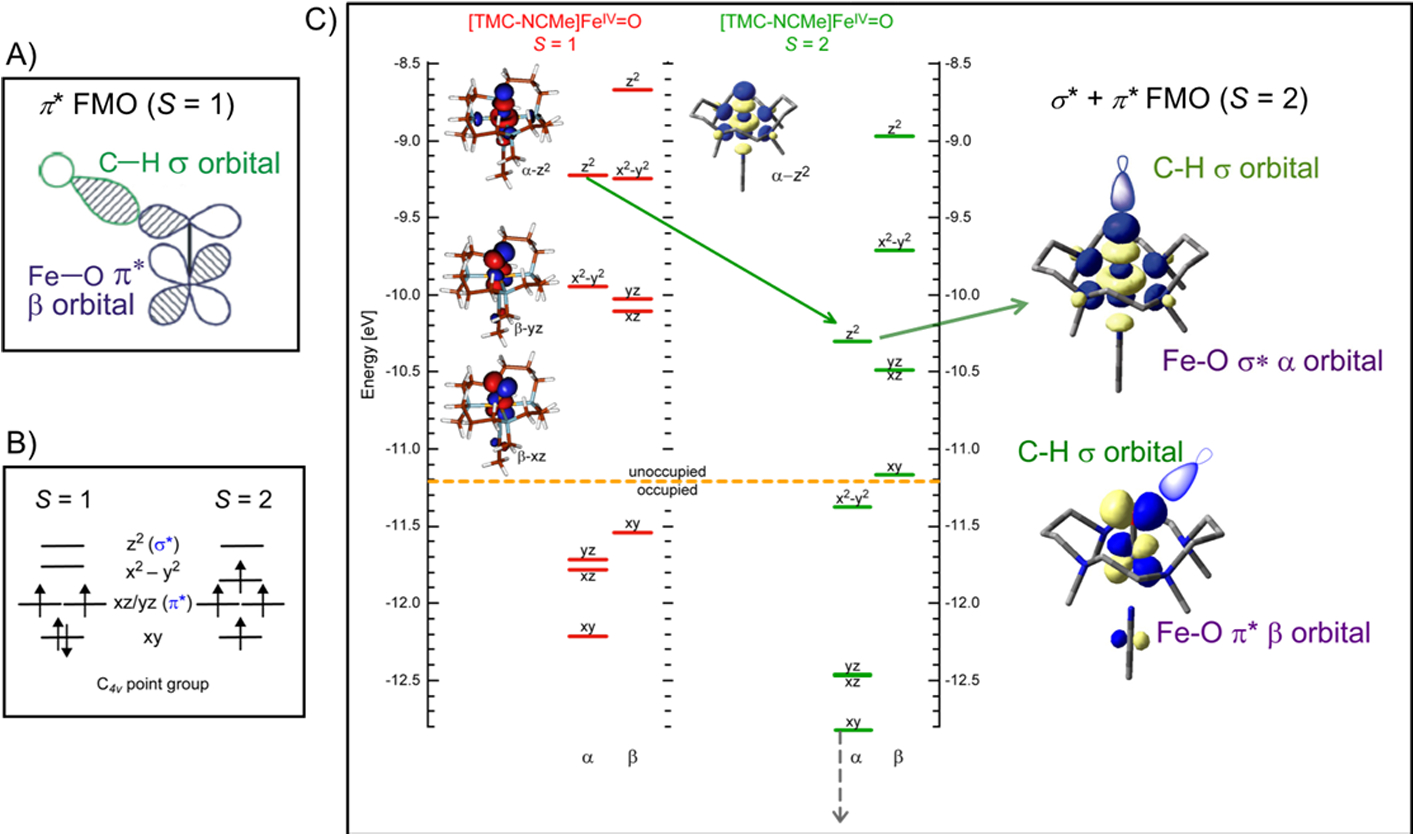
A) π* FMO of S = 1 (TMC)FeIV=O. B) Spin restricted S = 1 compared to S = 2 C4v d-manifold. C) (left) Spin unrestricted comparison of S = 1 (red) and S = 2 (green) electronic structures of the (TMC-NCMe)FeIV=O complex. (right) Key σ* and π* FMOs for S = 2 FeIV=O. Adapted from Refs. 36 and 37.
In correlating to an S = 2 iron-oxo system, as in the enzyme intermediates, in a spin restricted picture (Fig. 11B), the dxy β electron is promoted into the dx2-y2 orbital with α spin. Using a spin unrestricted description (where the α and β manifolds can have different energetics and wavefunctions) of the FeIV=O electronic structure (Fig 11C), excitation of a β electron from dxy into an α-dx2-y2 orbital (from red to green) results in a large stabilization of the α manifold (Fig 11 C, green).37–39 This is a spin polarization effect associated with the increased exchange interaction. This brings the dz2 orbital down in energy and becomes an FMO (Fig 11C, right) with significant oxo pz character and is activated for reaction along the Fe-O bond. However, it is important to note that in S = 2 FeIV=O, there is still a dπ* FMO at low energy and with significant oxo pπ character that would be active in reactivity perpendicular to the Fe-O bond (Fig 11C, right bottom).
These predicted FMOs for an S = 2 FeIV=O system could be experimentally evaluated using VT MCD spectroscopy on a structurally defined FeIV=O S = 2 model complex. The complex studied was the (TMG3tren)FeIV=O shown in Fig. 12A (defined by Que Jr., et. al.)32, which has the trigonal bipyramidal ligand field and energy level diagram (Fig. 12B). Again, the VT MCD provides significant insight into the FMOs relative to the absorption spectrum in Fig. 12A top.38 At lowest energy, 12,000 cm−1, there is a transition weak in absorption that is relatively intense in LT MCD assigning it as a LF transition. From its temperature dependent MCD and vibronic structure, it is assigned as a dπ* → dσ* transition between two key FMOs in Fig. 12B (bottom in red). At higher energy in the electronic spectrum is a third FMO revealed by the negative LT MCD feature at 19,000 cm−1. From its temperature dependence and vibronic structure, it is assigned as the oxo π → dπ* transition (given in Fig. 12B, bottom in green). CASPT2 multireference calculations were then correlated to the electronic spectra in Fig. 12A at the FeIV=O ground state geometry and were extended to the Fe-O geometry at the TS for HAA from the TMG3tren ligand. From the right of Fig 12C, there are three FMOs available for FeIV=O reactivity and all three strongly polarize and become oxyl-FeIII in character at the TS. One is a σ FMO activated for reaction along the Fe-O bond and the other two are π FMOs for HAA and EAS perpendicular to the Fe-O bond.
Fig 12:

A) Abs (top) and VT MCD (bottom) data on S = 2 (TMG3tren)FeIV=O. B) Geometry optimized computational model (top) and MO diagram showing the origin of the d → d and CT transitions observed in Abs and MCD spectroscopy on (TMG3tren)FeIV=O. C) Potential energy surface of S = 2 (TMG3tren)FeIV=O states along the Fe-O coordinate which reveal one σ and two π FMOs with oxyl-FeIII character at the TS (at right). Adapted from Ref 38.
3.2. Halogenation vs Hydroxylation – FMO Control of Selectivity
The π and σ FMO concepts developed from these model complex studies were extended to understand the reactivity of the FeIV=O S = 2 intermediate in the halogenase SyrB2 (that is important in biosynthesis of plant pathogen syringomycin E40). As shown in Fig 13A, this is an αKG-dependent enzyme that binds a halide rather than the carboxylate residue present in most other αKG-dependent NHFe enzymes.41 When substrate is also present, the αKG-bound FeII enzyme reacts with O2 to generate an FeIV=O S = 2 (observed by Bollinger and Krebs) with bound succinate from decarboxylation of the αKG cofactor.42 This then performs HAA from the substrate and selectively halogenates in the case of the native substrate L-Thr rather than performing the more thermodynamically favorable hydroxylation, which is observed with non-native substrates (L-Nva in Fig 13A).43
Fig 13:
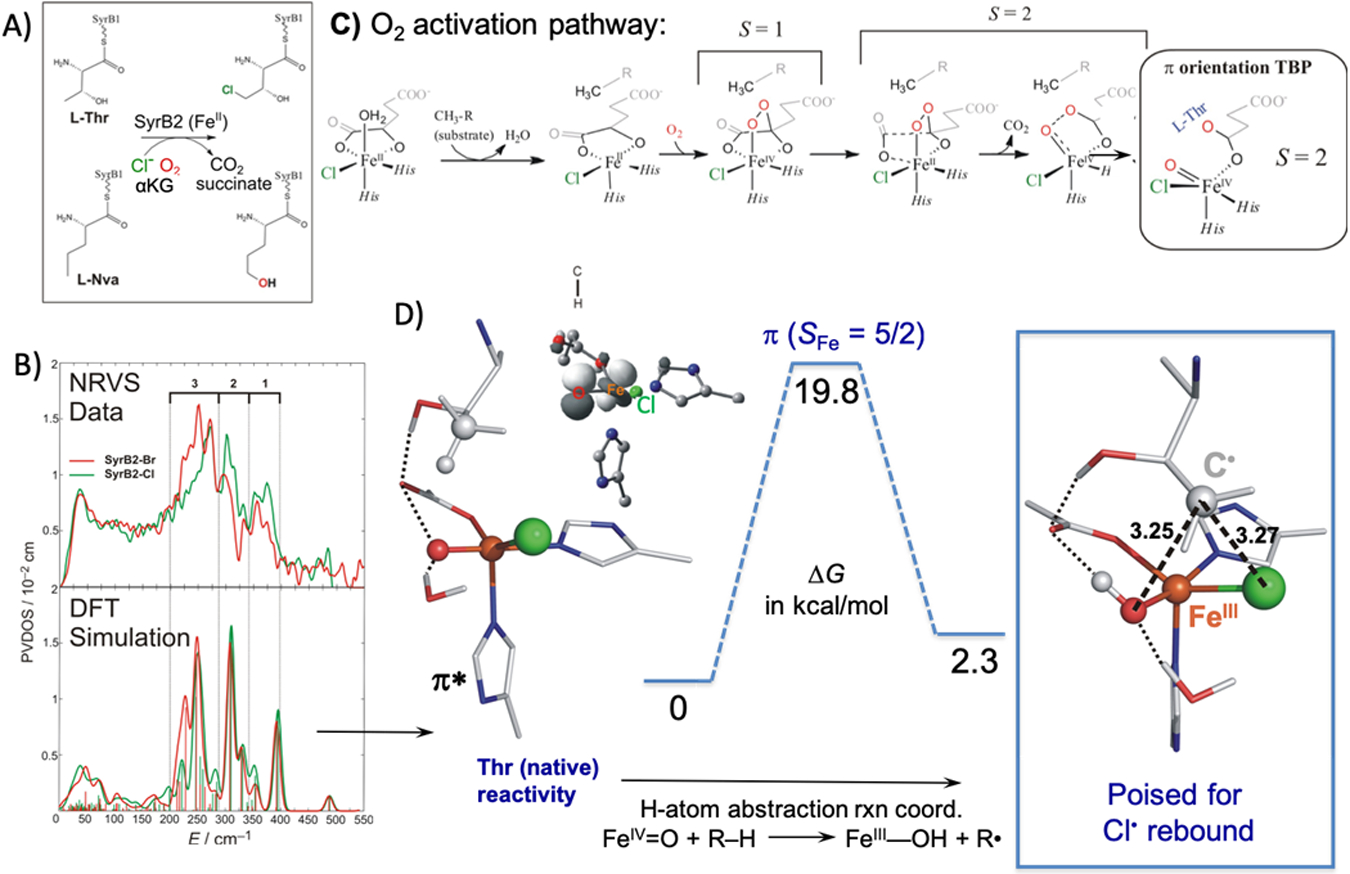
A) Reactions catalyzed by the halogenase SyrB2 using native substrate L-Thr and non-native substrate L-Nva. B) (Top) NRVS data for (SyrB2)FeIV=O with Br (red) and Cl (green) bound; (Bottom) DFT Simulation of TBP (SyrB2)FeIV=O computational model with Br (red) and Cl (green). C) O2 activation pathway in SyrB2 to generate the computational model with the substrate C-H bound perpendicular to the FeIV=O. D) HAA reaction coordinate for (SyrB2)FeIV=O with the reactive FMO (inset) and the geometry of the carbon radical product perpendicular to the HO-FeIII-Cl plane. Adapted from Ref. 44.
We defined the geometric structure of this intermediate through NRVS spectroscopy.44 These data in Fig 13B (top) show a 3 peak pattern where intensity shifts from the high energy into the low energy modes with the Cl → Br substitution. This is a mass effect that involves a redistribution of Fe motion into low energy vibrations with Br. We evaluated a wide range of possible intermediate structures but only the structure at the left of Fig 13D reproduced the 3 peak pattern and shift of intensity into low frequency modes with the Br substitution (Fig 13B, bottom). This is a 5C trigonal bipyramidal structure with the iron-oxo along the C3 axis of the site. This structure was derived from the reaction coordinate in Fig 13C, which generated this TBP intermediate with its Fe-O bond oriented perpendicular to the H-C bond of the substrate.
For reaction with the substrate, this FeIV=O S = 2 intermediate would need a π* FMO. This was evaluated using VT MCD spectroscopy on the Br-bound FeIV=O intermediate in SyrB2.45 These data are compared to VT MCD and absorption data of (TMG3tren)FeIV=O analyzed above. From Fig 14A, the FeIV=O in SyrB2 has very similar spectral features to the FeIV=O in TMG3tren including a structured xy polarized low energy LF transition at ~12,000 cm−1 and the negative intensity oxo-pπ → dπ MCD feature at 18,000 cm−1 indicating that the enzyme intermediate has a very similar geometric and electronic structure as the (TMG3tren)FeIV=O model with a C3 TBP FeIV=O core. There are, however, quantitative differences. The oxo-to-dπ CT is lower in energy in SyrB2 indicating a more covalent oxo-Fe bond and the vibronic structure of the 5E LF transition is different reflecting a π-anisotropy due to the equatorial halide. From the calculated reaction energies in Fig 14B and wavefunction changes along the Fe-O reaction coordinate in Fig 14C (i.e. more FeIII-oxyl character at the TS in SyrB2), the FeIV=O intermediate in SyrB2 is more reactive (a lower intrinsic barrier due to the higher FeIII-oxyl character at the TS). These derive from the higher covalency and anisotropy of the π* FMO of SyrB2.
Fig 14:
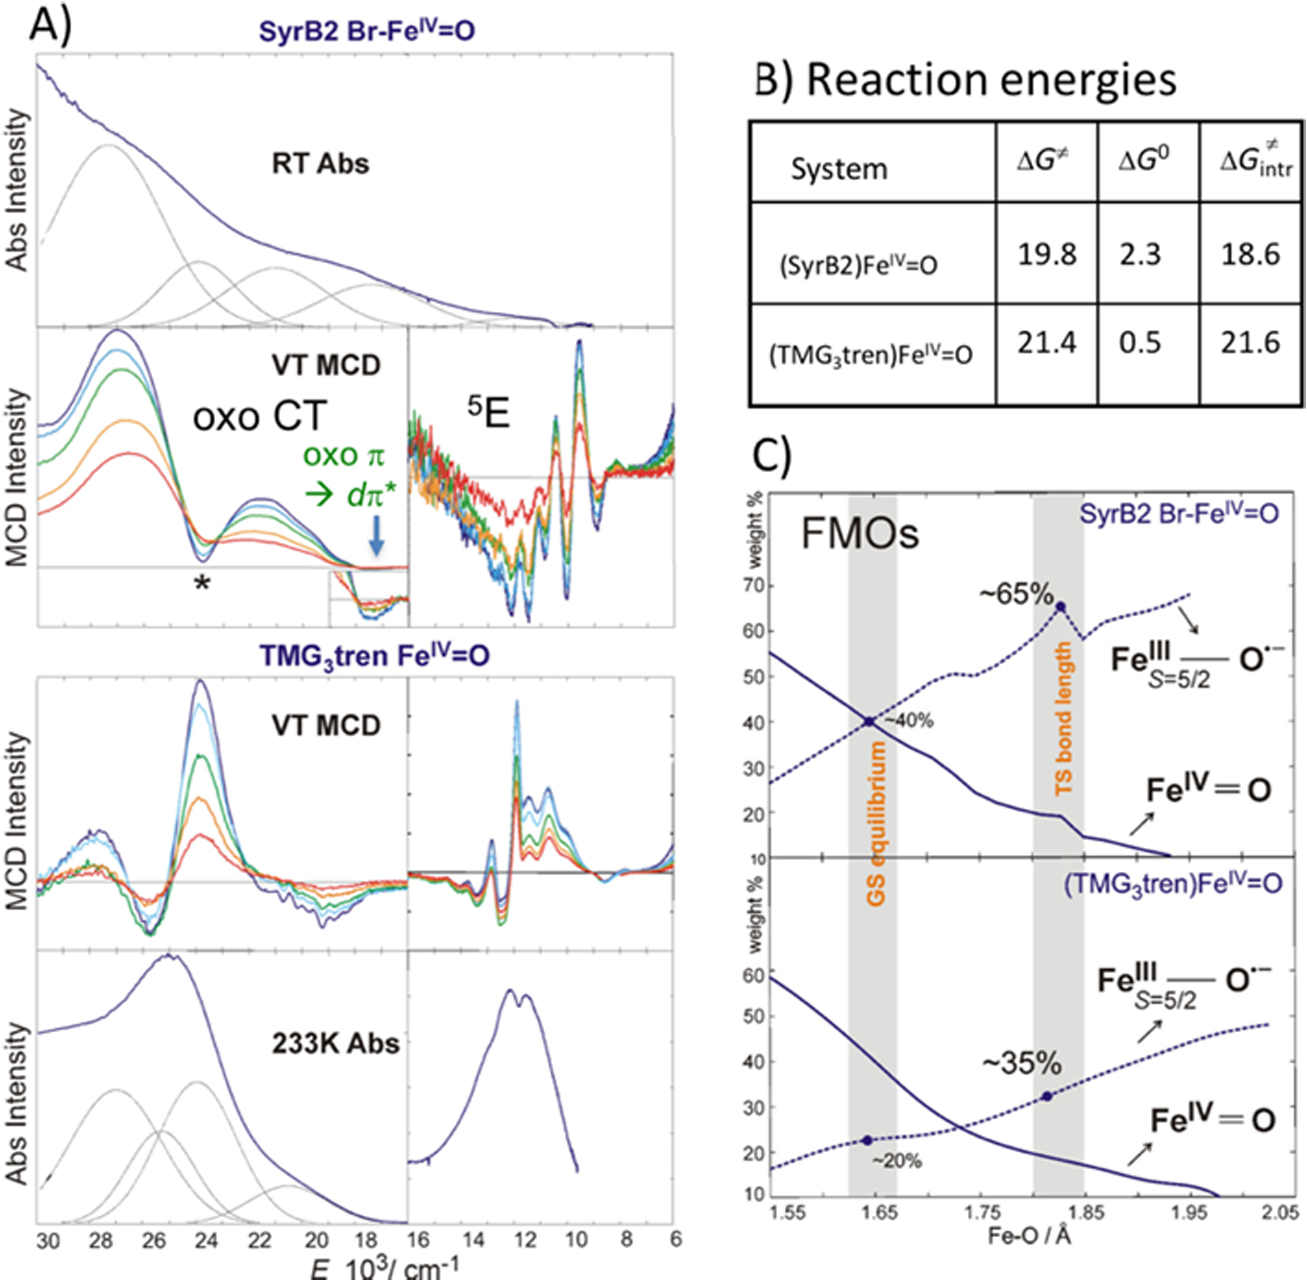
A) Comparison between (SyrB2)- and (TMG3tren)-FeIV=O Abs and MCD spectra. B) Free energies of HAA reaction by (SyrB2)- and (TMG3tren)-FeIV=O on respective substrates including the thermodynamically corrected intrinsic barrier. C) Evolution of wavefunction along Fe-O vector in the HAA reaction coordinate using CASPT2 calculations. Adapted from Ref. 45.
From Fig 13D (left), the FeIV=O intermediate in SyrB2 can thus react with its substrate using the π* FMO giving a Gibbs free energy barrier of ~20kcal/mol consistent with the slow kinetics42 of this reaction. This HAA generates the ferric hydroxide intermediate shown at the right of Fig 13D, which has the substrate radical positioned above its HO-FeIII-Cl plane. Starting from this orientation, the rebound halogenation vs hydroxylation reactions were evaluated and, from Fig 15A for the native substrate, the halogenation (green) has a lower barrier than the hydroxylation (red) even though the hydroxylation is thermodynamically favored by 12 kcal/mol. Marcus theory was applied to remove the thermodynamic contribution to the barrier (raising the TS by ~4 kcal/mol in Fig 15B) which showed that halogenation (green) has a lower intrinsic barrier than hydroxylation by 4.6 kcal/mol. This again derives from FMO differences (Fig 15B, inset) where the π* FMO for halide rebound is 4.5 kcal/mol lower in energy than the π* FMO for hydroxide rebound. Thus, the thermodynamic contribution to the barrier and the intrinsic rebound barrier are very similar in energy and mostly cancel. The factor that determines the selectivity in the rebound is thus the overlap of the substrate radical with the π* FMO of the halide (green) vs hydroxide (red) in Fig 15C, with the native substrate radical positioned for selective halide overlap and rebound. It is important to emphasize that this selectivity derives from the π FMO reactivity pictured in Fig 13D left. For an FeIV=O intermediate oriented along the H-C bond of the substrate, the σ attack would produce a FeIII-OH intermediate oriented toward the radical and only hydroxylation would be observed.46
Fig 15:
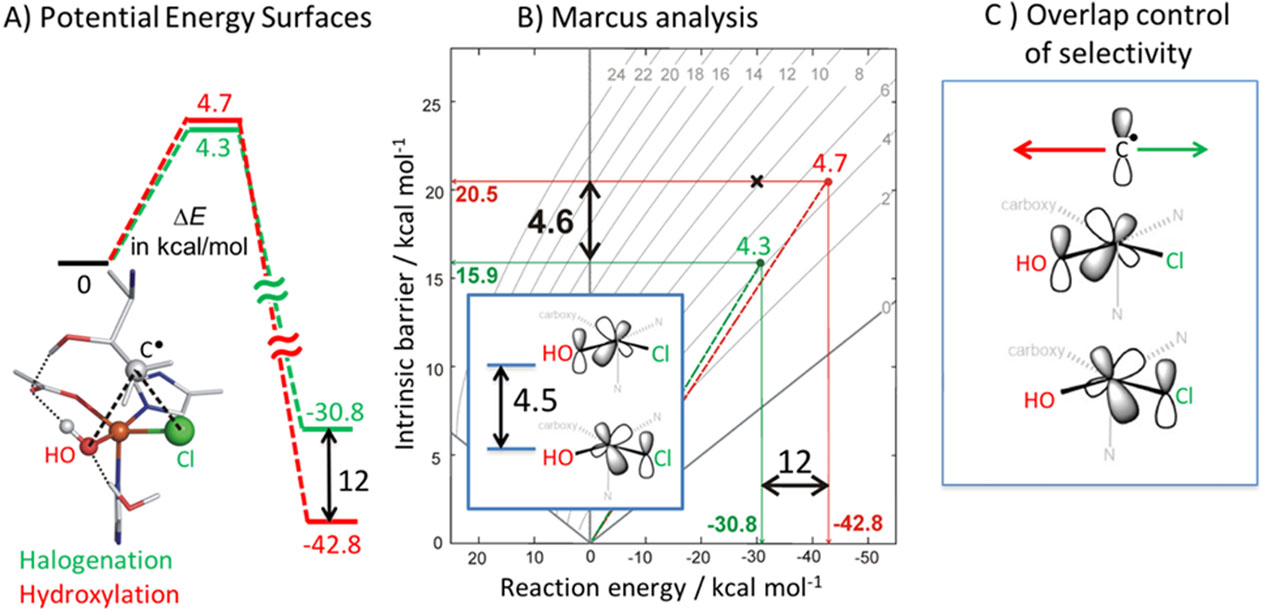
A) Thermodynamic differences between hydroxylation vs halogenation reaction coordinates. B) Marcus analysis comparing the intrinsic barriers with reaction energies for hydroxylation vs halogenation. Inset shows energetic difference between dπ orbitals oriented towards the OH− and Cl−. C) Overlap of C radical with either OH− for hydroxylation or Cl− for halogenation. Adapted from Ref. 46.
4. Future Directions
Our recent progress in NHFe enzymes is now evolving in a number of directions. For the FeIV=O intermediates, we are interested in understanding their additional reactivities in desaturation, ring expansion and EAS. We are further interested in defining experimentally the reaction coordinates in generating these in the αKG- and pterin-dependent enzymes. We are also extending these mononuclear NHFeII studies to the other three classes in Table 1. We have now found that, in the Rieske dioxygenases, the extradiol dioxygenases and the sulfur oxidases and oxygenases, an FeIII-superoxo appears to be the catalytic intermediate47–49 and we will determine the associated FeIII-O2•- FMOs and then their reaction coordinates in selective catalysis.
In the Rieske dioxygenases and the extradiol dioxygenases, a high-spin FeIII-OOH can be trapped; however we have found this to not be reactive relative to the FeIII-O2•- intermediate in these enzymes.47,49 Alternatively, in binuclear NHFe enzymes, in a number of cases, there is a high spin hydroperoxo intermediate50 that is reactive and we would like to understand the binuclear activation mechanism relative to their mononuclear counterparts. Finally, we are very interested in understanding how the FeIV=O S = 1 intermediates in non-heme iron relate to heme Fe=O intermediates in compound I and II. Here, new spectral methods are required that enable studying the Fe site in the highly delocalized porphyrin ligand.51
Acknowledgment
This research is funded by the National institutes of Health (Grant GM 40392). We would like to thank our collaborators listed in the associated references for providing the model complexes and enzyme samples used for our studies. EIS thanks Prof. Funahashi and Prof. Masuda for the JSCC award nomination and Prof. Fujisawa for the JSPS fellow nomination enabling participation in the JSCC national and ICCC international meetings in Sendai.
Biographies

Edward I. Solomon
Edward I. Solomon grew up in North Miami Beach, Florida, received his Ph.D. at Princeton (1972) and was a postdoctoral fellow at The Ørsted Institute in Denmark and at Caltech. He started his career at MIT in late 1975, became a full professor in 1981, and joined the faculty at Stanford in 1982 where he is now the Monroe E. Spaght Professor of Humanities and Sciences and Professor of Photon Science at SLAC National Accelerator Laboratory. He has been a visiting professor in France, Argentina, Japan, China, India and Brazil. He has received ACS National Awards in Inorganic Chemistry, Distinguished Service in the Advancement of Inorganic Chemistry, The Bader Award in Bioinorganic Chemistry, the Ira Remsen Award and The Kosolapoff Medal, the Centenary Medal from the RSC, The Pittsburgh Spectroscopy Award and a range of other recognitions. He is a member of the National Academy of Sciences, the American Academy of Arts and Sciences and a Fellow of the ACS and the AAAS.
Professor Solomon’s research is in the fields of Physical-Inorganic, Bioinorganic, and Theoretical-Inorganic Chemistry. His focus is on spectroscopic elucidation of the electronic structure of transition metal complexes and its contribution to reactivity. He has made significant contributions to our understanding of metal sites involved in electron transfer, copper sites involved in O2 binding, activation and reduction to water, in structure/function correlations over non-heme iron enzymes, in correlations between metalloenzyme and heterogeneous catalysis and in the development of new spectroscopic methods.

Shyam R. Iyer
Shyam Iyer was born in India and was drawn to chemistry when he participated in a flame test lab and saw the different colors that different metals emitted. He completed his undergraduate education at the University of Minnesota, Twin Cities, where he worked on olefin catalysis using biomimetic iron complexes in Prof. Lawrence Que’s lab. In 2014, he started his Ph.D. studies in Prof. Solomon’s group where he is currently using spectroscopic, kinetic and computational methods to understand the requirements for O2 activation and to characterize reactive intermediates in mononuclear and binuclear iron enzymes.
References
- (1).Solomon EI; Light KM; Liu LV; Srnec M; Wong SD Acc. Chem. Res 2013, 46, 2725–2739. [DOI] [PMC free article] [PubMed] [Google Scholar]
- (2).Solomon EI; Brunold TC; Davis MI; Kemsley JN; Lee S; Lehnert N; Neese F; Skulan AJ; Yang Y; Zhou J Chem. Rev 2000, 100, 235–349. [DOI] [PubMed] [Google Scholar]
- (3).Que L; Ho RY N. Chem. Rev 1996, 96, 2607–2624. [DOI] [PubMed] [Google Scholar]
- (4).Solomon EI; Goudarzi S; Sutherlin KD Biochemistry 2016, 55, 6363–6374. [DOI] [PMC free article] [PubMed] [Google Scholar]
- (5).Solomon EI; Pavel EG; Loeb KE; Campochiaro C Coord. Chem. Rev 1995, 144, 369–460. [Google Scholar]
- (6).Pavel EG; Kitajima N; Solomon EI J. Am. Chem. Soc 1998, 120, 3949–3962. [Google Scholar]
- (7).Neese F; Solomon EI Inorg. Chem 1999, 38, 1847–1865. [DOI] [PubMed] [Google Scholar]
- (8).Campochiaro C; Pavel EG; Solomon EI Inorg. Chem 1995, 34, 4669–4675. [Google Scholar]
- (9).Kemsley JN; Mitić N; Zaleski KL; Caradonna JP; Solomon EI J. Am. Chem. Soc 1999, 121, 1528–1536. [Google Scholar]
- (10).Zhou J; Kelly WL; Bachmann BO; Gunsior M; Townsend CA; Solomon EI J. Am. Chem. Soc 2001, 123, 7388–7398. [DOI] [PubMed] [Google Scholar]
- (11).Ohta T; Chakrabarty S; Lipscomb JD; Solomon EI J. Am. Chem. Soc 2008, 130, 1601–1610. [DOI] [PMC free article] [PubMed] [Google Scholar]
- (12).Davis MI; Wasinger EC; Decker A; Pau MYM; Vaillancourt FH; Bolin JT; Eltis LD; Hedman B; Hodgson KO; Solomon EI J. Am. Chem. Soc 2003, 125, 11214–11227. [DOI] [PubMed] [Google Scholar]
- (13).Loeb KE; Zaleski JM; Westre TE; Guajardo RJ; Mascharak PK; Hedman B; Hodgson KO; Solomon EI J. Am. Chem. Soc 1995, 117, 4545–4561. [Google Scholar]
- (14).Brown CD; Neidig ML; Neibergall MB; Lipscomb JD; Solomon EI J. Am. Chem. Soc 2007, 129, 7427–7438. [DOI] [PMC free article] [PubMed] [Google Scholar]
- (15).Burger RM; Peisach J; Horwitz SB J. Biol. Chem 1981, 256, 11636–11644. [PubMed] [Google Scholar]
- (16).Westre TE; Loeb KE; Zaleski JM; Hedman B; Hodgson KO; Solomon EI J. Am. Chem. Soc 1995, 117, 1309–1313. [Google Scholar]
- (17).Neese F; Zaleski JM; Loeb Zaleski K; Solomon EI J. Am. Chem. Soc 2000, 122, 11703–11724. [Google Scholar]
- (18).Burger RM; Kent TA; Horwitz SB; Munck E; Peisach J J. Biol. Chem 1983, 258, 1559–1564. [PubMed] [Google Scholar]
- (19).Guajardo RJ; Hudson SE; Brown SJ; Mascharak PK J. Am. Chem. Soc 1993, 115, 7971–7977. [Google Scholar]
- (20).Sono M; Roach MP; Coulter ED; Dawson JH Chem. Rev 1996, 96, 2841–2888. [DOI] [PubMed] [Google Scholar]
- (21).Chow MS; Liu LV; Solomon EI Proc. Natl. Acad. Sci 2008, 105, 13241–13245. [DOI] [PMC free article] [PubMed] [Google Scholar]
- (22).Kumar D; Hirao H; Shaik S; Kozlowski PM J. Am. Chem. Soc 2006, 128, 16148–16158. [DOI] [PubMed] [Google Scholar]
- (23).Sturhahn W; Toellner TS; Alp EE; Zhang X; Ando M; Yoda Y; Kikuta S; Seto M; Kimball CW; Dabrowski B Phys. Rev. Lett 1995, 74, 3832–3835. [DOI] [PubMed] [Google Scholar]
- (24).Seto M; Yoda Y; Kikuta S; Zhang XW; Ando M Phys. Rev. Lett 1995, 74, 3828–3831. [DOI] [PubMed] [Google Scholar]
- (25).Bell CB; Wong SD; Xiao Y; Klinker EJ; Tenderholt AL; Smith MC; Rohde J-U; Que L; Cramer SP; Solomon EI Angew. Chemie Int. Ed 2008, 47, 9071–9074. [DOI] [PMC free article] [PubMed] [Google Scholar]
- (26).Liu LV; Bell III CB; Wong SD; Wilson SA; Kwak Y; Chow MS; Zhao J; Hodgson KO; Hedman B; Solomon EI Proc. Natl. Acad. Sci. U. S. A 2010, 107, 22419–22424. [DOI] [PMC free article] [PubMed] [Google Scholar]
- (27).Decker A; Chow MS; Kemsley JN; Lehnert N; Solomon EI J. Am. Chem. Soc 2006, 128, 4719–4733. [DOI] [PubMed] [Google Scholar]
- (28).Stubbe J; Kozarich JW Chem. Rev 1987, 87, 1107–1136. [Google Scholar]
- (29).Price JC; Barr EW; Glass TE; Krebs C; Bollinger JM Jr. J. Am. Chem. Soc 2003, 125, 13008–13009. [DOI] [PubMed] [Google Scholar]
- (30).Eser BE; Barr EW; Frantom PA; Saleh L; Bollinger JM Jr.; Krebs C; Fitzpatrick PF J. Am Chem. Soc 2007, 129, 11334–11335. [DOI] [PMC free article] [PubMed] [Google Scholar]
- (31).Rohde J-U; In J-H; Lim MH; Brennessel WW; Bukowski MR; Stubna A; Munck E; Nam W; Que L Jr. Science 2003, 299, 1037–1039. [DOI] [PubMed] [Google Scholar]
- (32).England J; Martinho M; Farquhar ER; Frisch JR; Bominaar EL; Münck E; Que L Jr. Angew. Chem. Int. Ed. Engl 2009, 48, 3622–3626. [DOI] [PMC free article] [PubMed] [Google Scholar]
- (33).Nam W Acc. Chem. Res 2015, 48, 2415–2423. [DOI] [PubMed] [Google Scholar]
- (34).Cook S. a.; Borovik AS Acc. Chem. Res 2015, 48, 2407–2414. [DOI] [PMC free article] [PubMed] [Google Scholar]
- (35).Decker A; Rohde J; Que L; Solomon EI J. Am. Chem. Soc 2004, 126, 5378–5379. [DOI] [PubMed] [Google Scholar]
- (36).Decker A; Rohde J-U; Klinker EJ; Wong SD; Que L; Solomon EI J. Am. Chem. Soc 2007, 129, 15983–15996. [DOI] [PMC free article] [PubMed] [Google Scholar]
- (37).Srnec M; Wong SD; Solomon EI Dalt. Trans 2014, 43, 17567–17577. [DOI] [PMC free article] [PubMed] [Google Scholar]
- (38).Srnec M; Wong SD; England J; Que L Jr.; Solomon EI Proc. Natl. Acad. Sci. U. S. A 2012, 109, 14326–14331. [DOI] [PMC free article] [PubMed] [Google Scholar]
- (39).Decker A; Clay MD; Solomon EI J. Inorg. Biochem 2006, 100, 697–706. [DOI] [PubMed] [Google Scholar]
- (40).Vaillancourt FH; Yin J; Walsh CT Proc. Natl. Acad. Sci 2005, 102, 10111–10116. [DOI] [PMC free article] [PubMed] [Google Scholar]
- (41).Blasiak LC; Vaillancourt FH; Walsh CT; Drennan CL Nature 2006, 440, 368–371. [DOI] [PubMed] [Google Scholar]
- (42).Matthews ML; Krest CM; Barr EW; Vaillancourt FH; Walsh CT; Green MT; Krebs C; Bollinger JM Jr. Biochemistry 2009, 48, 4331–4343. [DOI] [PMC free article] [PubMed] [Google Scholar]
- (43).Matthews ML; Neumann CS; Miles LA; Grove TL; Booker SJ; Krebs C; Walsh CT; Bollinger JM Jr. Proc. Natl. Acad. Sci. U. S. A 2009, 106, 17723–17728. [DOI] [PMC free article] [PubMed] [Google Scholar]
- (44).Wong SD; Srnec M; Matthews ML; Liu LV; Kwak Y; Park K; Bell III CB; Alp EE; Zhao J; Yoda Y; Kitao S; Seto M; Krebs C; Bollinger JM; Solomon EI Nature 2013, 499, 320–323. [DOI] [PMC free article] [PubMed] [Google Scholar]
- (45).Srnec M; Wong SD; Matthews ML; Krebs C; Bollinger JM; Solomon EI J. Am. Chem. Soc 2016, 138, 5110–5122. [DOI] [PMC free article] [PubMed] [Google Scholar]
- (46).Srnec M; Solomon EI J. Am. Chem. Soc 2017, 139, 2396–2407. [DOI] [PMC free article] [PubMed] [Google Scholar]
- (47).Sutherlin KD; Rivard BS; Böttger LH; Liu LV; Rogers MS; Srnec M; Park K; Yoda Y; Kitao S; Kobayashi Y; Saito M; Seto M; Hu M; Zhao J; Lipscomb JD; Solomon EI J. Am. Chem. Soc 2018, 140, 5544–5559. [DOI] [PMC free article] [PubMed] [Google Scholar]
- (48).Goudarzi S; Babicz JT; Kabil O; Banerjee R; Solomon EI J. Am. Chem. Soc 2018, 140, 14887–14902. [DOI] [PMC free article] [PubMed] [Google Scholar]
- (49).Sutherlin KD; Wasada-Tsutsui Y; Mbughuni MM; Rogers MS; Park K; Liu LV; Kwak Y; Srnec M; Böttger LH; Frenette M; Yoda Y; Kobayashi Y; Kurokuzu M; Saito M; Seto M; Hu M; Zhao J; Alp EE; Lipscomb JD; Solomon EI J. Am. Chem. Soc 2018, 140, 16495–16513. [DOI] [PMC free article] [PubMed] [Google Scholar]
- (50).Park K; Li N; Kwak Y; Srnec M; Bell CB; Liu LV; Wong SD; Yoda Y; Kitao S; Seto M; Hu M; Zhao J; Krebs C; Bollinger JM; Solomon EI J. Am. Chem. Soc 2017, 139, 7062–7070. [DOI] [PMC free article] [PubMed] [Google Scholar]
- (51).Kroll T; Hadt RG; Wilson SA; Lundberg M; Yan JJ; Weng T-C; Sokaras D; Alonso-Mori R; Casa D; Upton MH; Hedman B; Hodgson KO; Solomon EI J. Am. Chem. Soc 2014, 136, 18087–18099. [DOI] [PMC free article] [PubMed] [Google Scholar]


