

Adaptive optics and structured illumination enables fast and accurate imaging of neuronal structure and function in vivo.
Abstract
Optical microscopy, owing to its noninvasiveness and subcellular resolution, enables in vivo visualization of neuronal structure and function in the physiological context. Optical-sectioning structured illumination microscopy (OS-SIM) is a widefield fluorescence imaging technique that uses structured illumination patterns to encode in-focus structures and optically sections 3D samples. However, its application to in vivo imaging has been limited. In this study, we optimized OS-SIM for in vivo neural imaging. We modified OS-SIM reconstruction algorithms to improve signal-to-noise ratio and correct motion-induced artifacts in live samples. Incorporating an adaptive optics (AO) module to OS-SIM, we found that correcting sample-induced optical aberrations was essential for achieving accurate structural and functional characterizations in vivo. With AO OS-SIM, we demonstrated fast, high-resolution in vivo imaging with optical sectioning for structural imaging of mouse cortical neurons and zebrafish larval motor neurons, and functional imaging of quantal synaptic transmission at Drosophila larval neuromuscular junctions.
INTRODUCTION
The nervous system is composed of a complex collection of cells that communicate via electrical and chemical signals and function as networks to process information (1). To understand their structure and function physiologically, it is essential to study them in living animals. Noninvasive and capable of resolving subcellular structures, optical microscopy has been extensively applied in the field of neuroscience. For in vivo imaging, the most popular methods are confocal fluorescence microscopy and multiphoton fluorescence microscopy, both of which are capable of optically sectioning three-dimensional (3D) samples and extracting information from the focal plane of the microscope objective (2–5). In contrast, the application of standard widefield fluorescence microscopy, in which the entire sample is illuminated and the emitted fluorescence is collected by an objective lens and imaged with a camera, is usually confined to in vitro samples such as cultured cells or thin tissue sections. This is because when a widefield microscope is used to image thick samples, emitted fluorescence photons from both in-focus and out-of-focus structures arrive at the imaging camera. Obscuring the in-focus information, the out-of-focus background makes it difficult to visualize subcellular structures such as synapses. In other words, despite its simplicity in hardware implementation and fast imaging speed, the lack of optical sectioning of standard widefield fluorescence microscopy limits its application in complex 3D samples such as the brain in vivo.
One approach that imparts optical sectioning capability to widefield fluorescence microscopy uses structured illumination (SI). When a sample is illuminated with a structured pattern through the microscope objective, the high-spatial frequency illumination contrast is only preserved at the focal plane and, thus, modulates the in-focus signal, while the out-of-focus signal remains unmodified. Reconstruction algorithms take advantage of this difference in signal modulation to reject out-of-focus signal and retrieve in-focus information, thus enabling optical sectioning of 3D samples. One popular implementation of this optical-sectioning SI microscopy (OS-SIM) was proposed by Neil et al. (6), where three images with phase-shifted sinusoidal illumination patterns are used to computationally reconstruct an optically sectioned image. Powerful in practice, relatively low cost when compared with confocal and multiphoton fluorescence microscopy, and commercially available (e.g., ApoTome, Zeiss), OS-SIM is nevertheless rarely used for in vivo imaging because of several factors: the often low signal-to-noise ratio (SNR) of in vivo samples, the motion-induced artifacts, and the sample-induced wavefront distortion of the image-forming light. Without addressing these issues, the reconstructed images are prone to low contrast, reduced resolution, and severe artifacts.
Here, we describe an optimized OS-SIM method for in vivo imaging. We developed a new reconstruction algorithm that suppresses noise and corrects for sample motion. We further combined adaptive optics (AO) (7) with OS-SIM to measure and correct sample-induced aberrations. Applying our refined OS-SIM method to live mouse, zebrafish, and Drosophila larvae, we demonstrated high-speed, synapse-resolving imaging of neuronal structure and function in vivo.
RESULTS
A refined OS-SIM method incorporating AO
The original OS-SIM method (6), hereby referred to as “basic OS-SIM” takes three images I0, I1, and I2 with sinusoidal illumination patterns (Fig. 1, inset 1; see fig. S1 for detailed optical layout) of the same orientation but equally spaced phases 0°, 120°, and 240°. It reconstructs an OS-SIM image using Eq. (1)
| (1) |
Fig. 1. Simplified AO OS-SIM schematic diagram.
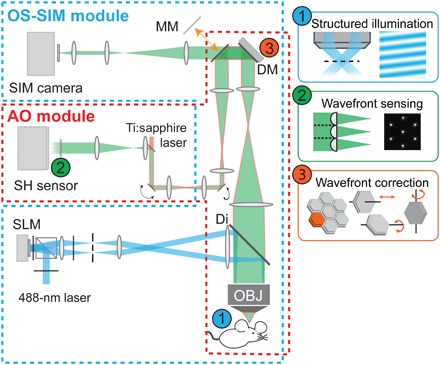
Blue dashed polygon, OS-SIM module; red dashed polygon, AO module. Inset 1: Two-beam interference generates patterned illumination. Inset 2: Direct wavefront measurement with a Shack-Hartmann (SH) sensor composed of a lenslet array and a camera. Inset 3: A segmented deformable mirror corrects aberration by controlling the piston, tip, and tilt positions of each segment. SLM, spatial light modulator; Di, dichroic mirror; OBJ, objective; DM, deformable mirror; MM, movable mirror. See fig. S1 for detailed optical paths.
In this “square law detection” method, out-of-focus (unmodulated) signal is discarded by the pairwise subtractions, and the effects of the nonuniform illumination patterns are removed by summing the in-focus signals.
Straightforward to implement, this method nevertheless has several limitations, as shown in an example dataset on a fixed cortical tissue section from the brain of a Thy1–GFP (green fluorescent protein) line M mouse (8) (raw and reconstructed images using basic SIM; Fig. 2, A and B). First, the squared subtractions in Eq. (1) make fluctuating noise all positive (“positive bias”) and decrease SNR of the reconstructed images (9). This particularly affects images of fine structures, because the attenuation of optical transfer function (OTF) amplitude at high spatial frequency makes their signal more sensitive to the presence of noise.
Fig. 2. Refined OS-SIM algorithm.
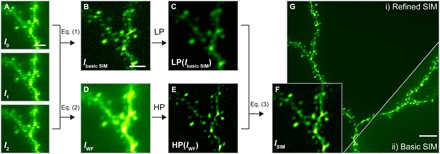
Example dataset from fixed mouse brain slice (Thy1-GFP line M). (A) Three raw images taken at a depth of 25 μm with spatially shifted illumination patterns. (B) Basic SIM image reconstructed with Eq. (1). (C) Low-pass (LP)–filtered basic SIM image. (D) Widefield image calculated with Eq. (2). (E) High-pass (HP)–filtered widefield image. (F) Refined SIM image from Eq. (3), calculated as a weighted summation of LP(Ibasic SIM) and HP(IWF). (G) Comparison of basic SIM and refined SIM reconstructions. (A to F) Images of a single optical section; (G) maximum intensity projection over 8 μm. Scale bars, 2 μm (A to F) and 5 μm (G).
Inspired by HiLo microscopy (10–12), in our refined OS-SIM method, to suppress high-frequency noise while maintaining optical sectioning, the basic OS-SIM image was low-pass filtered with LPσ = exp[−(kx2 + ky2)/2σ2], where kx and ky are spatial frequencies, and σ is the standard deviation (SD) of the Gaussian function, defined as the crossover frequency (Fig. 2C). To restore high-spatial frequency information to the image, we calculated the widefield image IWF as the average of the three raw images (Fig. 2D)
| (2) |
Because high-frequency information in a widefield image is essentially in-focus, we high-pass filtered IWF with a complementary Gaussian filter (i.e., HP = 1 − LPσ) (Fig. 2E). As IWF averages the noise, it does not introduce positive bias as Ibasic SIM does. The final refined OS-SIM image was calculated as a weighted summation of the two (Fig. 2F)
| (3) |
where HP and LP stand for high-pass and low-pass filtering, respectively. To ensure continuity at the crossover frequency in the Fourier domain, we applied a scaling factor α, which was related to the modulation contrast of the SI. Comparing reconstructed images of dendrites and dendritic spines with basic and refined OS-SIM methods (Fig. 2, B and F), we observed that the refined OS-SIM reconstruction had substantially higher SNR and better revealed finer neuronal structures.
To apply OS-SIM to in vivo imaging, we also need to address sample motion. Often unavoidable in vivo, sample motion in SIM not only shifts images on the camera but also changes the relative phase of the illumination pattern on the sample. Because Eq. (1) assumes static samples and equally spaced pattern phases, even submicrometer movements cause severe artifacts in the reconstructed images (fig. S2). Image registration aligns the three images but by itself cannot remove all artifacts (fig. S2B), because deviations from the equally spaced 0°, 120°, and 240° illumination phase are not accounted for by Eq. (1). Additional phase correction of each illumination pattern is therefore necessary for artifact-free OS-SIM reconstruction. To address this issue and remove artifacts caused by rigid lateral translations, we first estimated the phase of the illumination pattern for each raw SI image (ϕ0, ϕ1, and ϕ2) with Wicker’s noniterative method (13, 14). We then used these estimated phases to calculate the optically sectioned image with (15)
| (4) |
After both the structural and phase shifts were corrected, we observed artifact-free reconstructed basic SIM images (fig. S2D). Motion artifacts showed up as fringes in the widefield image IWF calculated by Eq. (2). To remove them, we applied Gaussian-shaped filters to attenuate ±kp and ± 2kp components of IWF, with kp being the spatial frequency of the SI.
Last, as in all optical microscopy techniques, image quality of OS-SIM is affected by optical aberrations (16). Specifically, the wavefront of emitted fluorescence accumulates distortion on its way out of the sample, leading to degradation in image contrast and resolution. To tackle this problem, we applied direct wavefront sensing-based AO (17, 18). We generated a 3D-localized “guide star” in the sample using two-photon excitation (TPE) (19). Its emitted fluorescence was then descanned (20) and directed to a Shack-Hartmann (SH) sensor. The hexagonal lenslet array in the SH sensor divided the wavefront of the guide star fluorescence and focused its segments onto a camera (Fig. 1, inset 2). Displacements of the foci from those taken under aberration-free condition were used to calculate the phase slopes of each wavefront segment. Wavefront was then computationally reconstructed assuming spatially continuous aberrations. We then applied a corrective wavefront that was opposite to the measured aberration to a deformable mirror (DM) with hexagonal segments (Fig. 1, inset 3), which removed the sample-induced aberrations from the OS-SIM fluorescence before it reached the imaging camera to ensure diffraction-limited imaging performance. In this report, we corrected the residual aberrations in the imaging system before all experiments; thus, all improvements in imaging quality arose from the correction of sample-induced aberrations.
High-resolution imaging of 3D tissue phantom and brain slices with AO OS-SIM
We first tested the performance of our system using 3D tissue phantom. As a reference, diffraction-limited axial resolution of the system was measured to be 855 ± 24 nm [axial full width at half maximum (FWHM), averaged over five beads] using a 2D sample of 0.1-μm-diameter green fluorescent beads. We then created a 3D tissue phantom by mixing 0.1-μm-diameter green fluorescent beads with 1% agarose. Aberrations were introduced by placing a No. 1.5 cover glass on top of the sample with a 2° tilt (to simulate a cranial window used in typical in vivo mouse brain imaging experiments). Before wavefront measurement, the correction collar of the microscope objective [Nikon, CFI Apo LWD 25×, 1.1 numerical aperture (NA) and 2-mm working distance] was adjusted to minimize spherical aberrations introduced by the cover glass (to <0.01-μm root mean square for both primary and secondary spherical aberrations). Wavefront distortion that could not be removed by the correction collar was measured by the SH sensor and corrected with the DM. We took five 4-μm-thick image stacks (at 0.1-μm Z step size) of beads at 0, 50, 100, 150, and 200 μm below the top surface of the tissue phantom, respectively, and compared their maximal intensity–projected widefield and OS-SIM images measured with and without AO correction (Fig. 3, A to E).
Fig. 3. System performance assessment of AO OS-SIM using a 3D phantom.
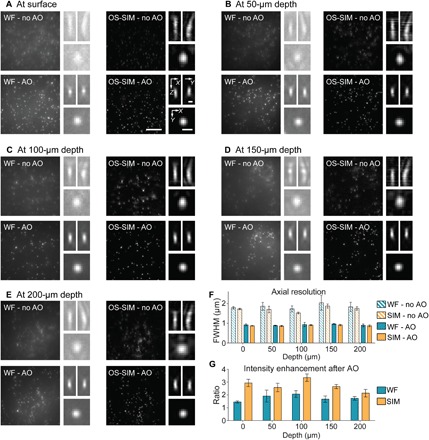
The sample was made by mixing 0.1-μm-diameter green fluorescent beads in 1% agarose, and aberration was introduced by a cover glass tilted at 2°. (A to E) (left panels) Maximum intensity projections of 4-μm-thick widefield (WF) and OS-SIM image stacks (0.1-μm Z step, 222 × 222 pixels at 86-nm pixel size), measured without and with AO taken at the surface and depths of 50, 100, 150, and 200 μm, respectively. Images acquired by the same method (WF or OS-SIM) were normalized to the AO condition (0 to maximum intensity of the image with AO). Scale bar, 5 μm. (Right panels) Representative axial and lateral images of 0.1-μm-diameter beads. Images were normalized individually (0 to maximum intensity) to improve visibility. Scale bars, 500 nm. (F) Averaged axial FWHM and (G) fluorescence signal enhancement (over five randomly chosen beads) with AO at different depths, respectively. Error bars: SD.
Consistent with earlier results (21), without AO correction, the axial point spread functions were elongated and curved, indicating coma as the dominant aberration modes. At all depths, AO correction improved resolution and enhanced fluorescence signal for both widefield and OS-SIM images (Fig. 3, F and G). At each depth, we measured the axial resolution by averaging the axial FWHMs of five randomly chosen beads. We found that AO fully recovered diffraction-limited resolution at all depths (without AO, 1.8 to 2.2 μm; with AO, 770 to 910 nm) (Fig. 3F). Signal enhancement by AO was 1.5 to 2× for widefield images and 2 to 3.4× for OS-SIM images (Fig. 3G), indicating that compared with conventional widefield imaging, imaging performance of OS-SIM is more degraded by aberrations. This can be explained by the fact that widefield images contain both in-focus and out-of-focus information, whereas OS-SIM images contain mostly in-focus information, which is more sensitive to aberration. Comparing 3D rendered image stacks of 50-μm-thick tissue phantom taken with widefield and OS-SIM without and with AO (movie S1), we observed a substantial enhancement in image contrast of the OS-SIM images measured with AO, suggesting that aberration correction is essential for OS-SIM in complex samples. Furthermore, our tissue phantom results indicated that OS-SIM, when combined with AO, can provide diffraction-limited optically sectioned images hundreds of micrometers into 3D samples.
Having confirmed the effectiveness of AO OS-SIM in improving image quality and rejecting out-of-focus fluorescence in the 3D phantom, we imaged dendritic structures in fixed mouse brain slices (Thy1-GFP line M, Fig. 4), following the same procedure as above but with aberrations introduced by a cover glass tilted at 4°. Here, in addition to widefield and OS-SIM, the same dendritic structures were also imaged using a two-photon fluorescence microscope incorporated within the AO OS-SIM system (fig. S1B), the most commonly used optical sectioning microscopy method for brain tissue. AO improved resolution, signal, and contrast of images from all three modalities and allowed fine structures such as dendritic spines to be resolved [maximum intensity projection (MIP) images spanning 8 μm in depth, Fig. 4, A to F; insets showing single optical sections; corrective wavefront, Fig. 4G]. Comparing the line intensity profiles along the neck of the same dendritic spines, we observed subtle but important differences among these imaging modalities (Fig. 4, H to J). Because widefield images lacked optical sectioning, AO improved both in- and out-of-focus fluorescence signals without providing much gain in rejecting out-of-focus fluorescence (Fig. 4, A, D, and H). For two-photon fluorescence images, AO improved resolution and signal (Fig. 4, B, E, and I); because the nonlinearity of TPE confined fluorescence generation to within the focal volume and prevented out-of-focus signal from being generated, fluorescence background signal was not changed substantially by aberration correction. Similar to the data from beads, OS-SIM images showed the most extensive improvement in image quality. Correcting the sample-induced aberration not only increased the signal and resolution of the OS-SIM images but also resulted in much higher image contrast and eliminated reconstruction artifacts (Fig. 4, C, F, and J, and see movie S2 for another example dataset). Comparing two-photon with OS-SIM, we found that they provided similar optical sectioning capacity, whereas OS-SIM had higher lateral resolution, resulting in sharper images of dendritic spines due to its one-photon fluorescence excitation (Fig. 4, E and F).
Fig. 4. Widefield, OS-SIM, and two-photon imaging of Thy1-GFP line M brain slices.
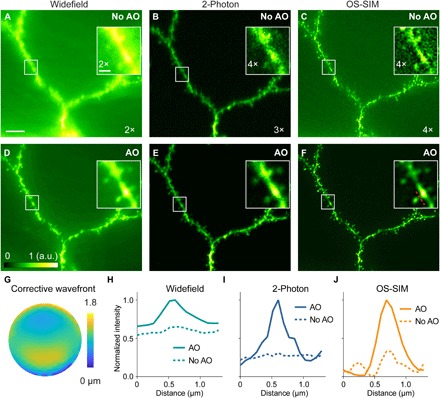
(A to F) Maximum intensity projections of 8-μm-thick widefield, two-photon, and OS-SIM image stacks (0.1-μm Z step, 21- to 29-μm depth, 440 × 396 pixels at 86-nm pixel size), taken (A to C) without and (D to F) with AO, respectively. For each pair of images, signal was normalized to the AO condition (0 to maximum intensity of the image with AO). Signal from images without AO was artificially increased for better visualization (ratios shown in each image). Insets are single optical sections. Scale bar, 5 μm; insets, 1 μm. (G) Corrective wavefront. (H to J) Line profiles across a dendritic spine neck [red dashed line in (F)]. a.u., arbitrary units.
High-resolution in vivo structural imaging of the mouse brain with AO OS-SIM
Having validated our AO OS-SIM system in fixed brain slices, we then applied it to high-resolution in vivo structural imaging of the mouse brain, where correction for motion artifacts became essential. Following standard procedures (22), we carried out a craniotomy on the mouse skull and installed a glass window to provide access for optical imaging. We visually positioned the mouse under the microscope objective, so that the cranial window was close to being perpendicular to the objective’s optical axis. We then adjusted the correction collar of the objective to minimize spherical aberrations. Direct wavefront sensing and full AO correction followed to completely remove sample-induced aberrations. Similar to the brain slice data, without AO, both widefield and OS-SIM images showed distorted synapses and neurites (insets 1 to 3, Fig. 5, A and B). We observed a marked improvement in resolution, signal, and contrast for both widefield and OS-SIM (Fig. 5, C and D) after AO correction (Fig. 5E). Comparing the line intensity profiles along a spine neck (arrow I in Fig. 5D, Fig. 5F), we observed 2.7× increase in signal of the OS-SIM image after aberration correction. Comparing the AO-corrected images, we saw a narrower spine neck profile for OS-SIM image than widefield images, because OS-SIM effectively suppressed out-of-focus background, which in the widefield image artifactually increased the apparent width of the spine neck. We also compared the axial profiles of a spine head (arrow II in Fig. 5D, Fig. 5G) and observed narrowing of its axial profile with OS-SIM. Our results indicated that, to apply the OS-SIM method in the mouse brain in vivo, aberration correction was essential.
Fig. 5. In vivo widefield imaging of a Thy1-GFP line M mouse brain with AO OS-SIM.
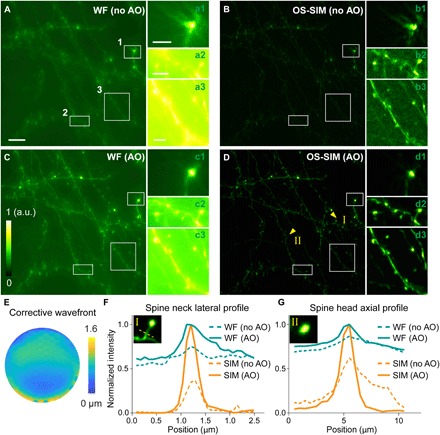
(A to D) Maximum intensity projections (MIPs) of 10-μm-thick widefield (WF) and OS-SIM image stacks (0.5-μm Z step, 20- to 30-μm depth, 1024 × 1024 pixels at 86-nm pixel size), measured (A and B) without and (C and D) with AO, respectively. For each pair of images, signal was normalized to the AO condition (0 to maximum intensity of the image with AO). Insets (MIPs) show the zoomed-in views of structures in the white boxes, with all insets normalized individually (0 to maximum intensity) to improve visibility. Scale bar, 10 μm; insets, 3 μm. (E) Corrective wavefront. (F and G) Lateral line profiles across a dendritic spine neck and axial profiles of a dendritic spine head [yellow arrowheads I and II in (D)], respectively. Insets are single optical sections obtained with AO OS-SIM.
High-resolution in vivo structural imaging of densely labeled zebrafish motor neurons
We next tested whether AO OS-SIM can optically section densely labeled samples in vivo, using the model system zebrafish larvae. In Isl1:GFP zebrafish larvae, Islet-1 promoter enabled the expression of GFP in all postmitotic motor neurons (23, 24). We imaged the motor neurons between the spinal cord and the hindbrain of a 4-day-old Isl1:GFP zebrafish larva, where the fluorescence labeling was denser than the mouse brain structures studied in the previous section.
We took 100-μm-thick widefield and OS-SIM image stacks of motor neurons from 10- to 110-μm depth before and after AO. MIPs are shown in Fig. 6 (3D renderings after AO in movie S3). Despite the dense labeling, OS-SIM successfully suppressed out-of-focus background and gave rise to images of cell bodies and neurites with high contrast and SNR. The corrective wavefront had a strong astigmatic component (Fig. 6E), originating from the elongated and curved shape of the larval body. Whereas AO correction improved the widefield image quality only moderately, its impact on OS-SIM images was more substantial, especially for fine neural projections from motor neuron somata to the spinal cord (insets, Fig. 6, A to D). Comparing the axial profiles of a neural projection (Fig. 6, F and G), we observed that OS-SIM provided excellent optical sectioning, whereas AO improved the fluorescence signal of the structure by four fold.
Fig. 6. In vivo widefield imaging of dense Isl1:GFP zebrafish motor neurons with AO OS-SIM.
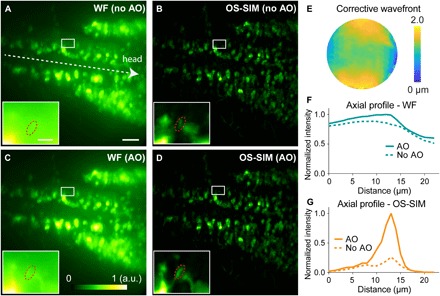
(A to D) MIPs of 100-μm-thick widefield (WF) and OS-SIM image stacks (1-μm Z step, 10- to 110-μm depth, 2048 × 2048 pixels at 86-nm pixel size), measured (A and B) without and (C and D) with AO, respectively. For each pair of images, signal was normalized to the AO condition (0 to maximum intensity of the image with AO). Insets (MIPs) show the zoomed-in views of structures in the white box, with all insets normalized individually (0 to maximum intensity) to improve visibility. Scale bar, 20 μm; insets, 3 μm. (E) Corrective wavefront. (F and G) Axial profiles of the structure in red dashed ovals in (A) to (D).
High-resolution high-speed in vivo functional imaging at Drosophila larval neuromuscular junction
For half a century, Drosophila larval neuromuscular junction (NMJ) has been a model system to study many aspects of synaptic transmission and development (25). Recently, Newman et al. (26) used a genetically encoded calcium indicator (GECI) GCaMP6 (27) and demonstrated robust quantal (i.e., single synaptic vesicle) synaptic imaging in vivo using the Drosophila larval NMJ. To demonstrate OS-SIM’s capability of capturing in vivo dynamic signals at high frame rate, we carried out functional imaging experiments at Drosophila larval NMJs using our refined OS-SIM method. We used a preparation identical to that described in Newman et al. (26), where Drosophila larval muscle was labeled with postsynaptically targeted GCaMP6f-based GECI. We were able to restrict our imaging to the superficial muscles in the semi-intact dissected larva, while other muscle layers (especially those above the focal plane) provided out-of-focus fluorescence and optical aberrations. Additional aberrations came from the high-sucrose concentration saline used to immerse and maintain viability of the larval preparation. Together, they made Drosophila larval NMJ a challenging sample for high-contrast and high-resolution in vivo imaging. We imaged a single focal plane in a Drosophila larva, which contain NMJs receiving inputs from the type Ib (larger) and type Is (smaller) motor neuron axons (indicated in Fig. 7B) and compared the widefield and OS-SIM images measured without and with AO (Fig. 7, A to D), with the main aberrations being spherical aberration (Fig. 7E). AO improved both the signal and contrast of the widefield as well as OS-SIM morphological images (Fig. 7F). Compared with widefield, OS-SIM successfully suppressed the out-of-focus fluorescence background, allowing us to visualize the subcellular structures of NMJs (insets, Fig. 7, A to D).
Fig. 7. In vivo functional imaging of quantal releases at the NMJs of a Drosophila larva with AO OS-SIM.
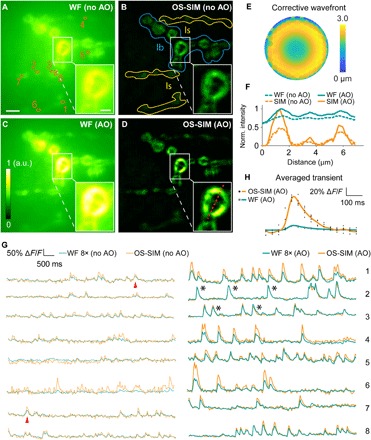
(A to D) Averages of widefield (WF) and OS-SIM image sequences (frames without calcium activity) of Ib and Is NMJs expressing GCaMP6f (8 s of recording, at a depth of 20 μm, 492 × 492 pixels at 86-nm pixel size), measured (A and B) without and (C and D) with AO, respectively. For each pair of images (including insets), signal was normalized to the AO condition (0 to maximum intensity of the image with AO). Insets show the zoomed-in views of structures in the white box. Scale bar, 5 μm; insets, 2 μm. (E) Corrective wavefront. (F) Lateral line profiles across the structure in the insets (D, along the red dashed line). (G) Calcium transients from eight regions of interest [orange regions of interest in (A)]. Calcium transients obtained from widefield images were artificially increased by eight times for better visualization. (H) Averaged calcium transients over five events [black asterisks in (H)] measured with AO OS-SIM and widefield.
We further imaged the calcium activity of these terminals at 25-Hz OS-SIM frame rate (75 Hz for raw image frames; movie S4). Interleaving reconstruction (28) of the acquired images would allow 75-Hz OS-SIM frame rate in functional imaging; however, 25 Hz was sufficient in following calcium activity reported by GCaMP6f. We found larger quantal responses to occur at the Is NMJs, consistent with previous studies (26). We extracted and compared the postsynaptic calcium transients associated with spontaneous quantal release events (Fig. 7G). Without AO (left panel, Fig. 7G), the deteriorated signal and contrast of the widefield images, coupled with the presence of strong out-of-focus background, made it difficult to detect spontaneous events (see red arrowhead, Fig. 7G, for a spontaneous event that remained detectable). In OS-SIM images without AO, because of reconstruction artifacts of aberrated images, we observed large fluctuations in ΔF/F that did not have normal calcium dynamic (see Fig. 7H for normal dynamics: faster onset, slower exponential offset). After aberration correction, by suppressing the out-of-focus background, diffraction-limited OS-SIM facilitated the detection of in-focus fluorescence signal changes associated with activity and gave rise to a ~8× larger calcium transient ΔF/F than widefield imaging (right panel, Fig. 7G; Fig. 7H, average of five spontaneous events marked by black asterisks in Fig. 7G). Furthermore, by removing the often unevenly distributed out-of-focus fluorescence background and thus preventing it from contributing to calcium transient calculation, OS-SIM allowed us to accurately measure the amplitudes of calcium transients. Since calcium transient amplitudes are proportional to neural activity level [e.g., action potential firing rate (27)], with AO OS-SIM, it is now possible to compare the in vivo activity in different structures quantitatively.
DISCUSSION AND CONCLUSION
With SI, widefield microscopy is capable of optically sectioning 3D samples and providing high-resolution high-contrast images. The applications of OS-SIM using the standard image reconstruction method (6), however, have been mostly limited to ultrathin samples. To apply OS-SIM in vivo, we developed new reconstruction algorithms to improve SNR and correct motion-induced artifacts. Figure S3 (A and B) compares images reconstructed with basic and refined SIM methods, respectively, from the same sets of raw images (after motion and AO correction) as in Figs. 4 to 7. For all samples tested, refined SIM gave rise to superior contrast, resolution, and SNR, with the largest improvements observed for in vivo preparations, where their denser fluorescence labeling led to substantial out-of-focus fluorescence. Whereas basic SIM reconstruction produced noisy images, making it difficult to visualize neurons or resolve synapses (fig. S3A), our refined SIM reconstruction gave rise to crisp images with much improved SNR (fig. S3B).
To apply high-resolution microscopy to in vivo samples, we need to correct sample-induced optical aberrations. Using two-photon–excited guide star and direct wavefront sensing to measure sample-induced aberrations and correcting them with a DM in the fluorescence emission path, we found that, compared to widefield fluorescence images, OS-SIM images are more sensitive to the existence of aberrations. Signal, contrast, and optical sectioning increase markedly after AO correction, even for superficial structures of in vivo samples. For in vivo calcium imaging at Drosophila larval NMJ (Fig. 7), the presence of aberrations introduced severe artifacts, indicating that AO correction can be essential for quantitative microscopy measurements of physiological events. For the samples we tested, aberrations were time invariant during the course of imaging; as a result, a one-time wavefront distortion measurement and correction, which took typically 2 to 3 min including time spent on switching the optics between the AO and SIM paths, ensured accurate and high-quality hours-long structural or functional recordings. In addition, AO correction at a single plane was able to provide signal improvement throughout the whole volume for our acquired image stacks (fig. S5).
Light sheet microscopy is another widefield approach that achieves fast fluorescence imaging with optical sectioning (29). Its standard dual-objective design has the excitation light coming from the side of the sample and the detection objective orthogonal to the illumination plane, which poses constraints on sample mounting and is not compatible with in vivo imaging of large samples such as the mouse brain. The oblique plane illumination geometry uses a single objective for both plane illumination and fluorescence collection (30, 31), which facilitates its application to a wider range of samples. However, it requires two additional objectives to reimage the illuminated plane onto a camera and compromises on achievable spatial resolution. Compared with OS-SIM, light sheet microscopy is therefore more complex in implementation. But because its optical sectioning ability originates from physically restricting the excitation volume rather than computationally extracting photons emitted from the objective focal plane, light sheet microscopy would perform better in densely labeled samples. Same as in OS-SIM, light sheet microscopy of either geometry suffers from sample-induced aberrations when applied in vivo. Direct wavefront sensing AO with two-photon–excited guide star, an aberration-correction strategy identical to the one implemented here, was applied to lattice light sheet microscopy for imaging subcellular dynamics in multicellular organisms (32). Applying aberration correction to the oblique plane illumination geometry has yet to be demonstrated. However, optimal correction over the entire FOV is more challenging in this geometry, because fluorescence emission from the oblique image plane experiences more field position–dependent aberrations.
Applying OS-SIM to optically opaque samples at depth remains challenging due to tissue scattering, which deteriorates both the contrast of the SIs and the emitted fluorescence images. Longer excitation and emission wavelengths reduce scattering and therefore can extend the imaging depth of widefield fluorescence microscopy methods including OS-SIM in vivo (33). The development of near-infrared proteins (34–36) would not only benefit OS-SIM imaging depth but also provide guide stars for accurate AO measurement at depth (17), where aberration correction is even more critical. When such probes mature into routine usage, we expect that our refined OS-SIM method would play a major role in interrogating the structure and function of biological systems in vivo.
MATERIALS AND METHODS
AO OS-SIM optical implementation and data analysis
The AO OS-SIM system had two working modes (fig. S1): OS-SIM mode and TPE for AO (TPE-AO) mode. A movable mirror (MM) in the light path was used to switch between the two modes. In the OS-SIM pathway (fig. S1A), SI was created at the sample plane and widefield fluorescence was recorded at the SIM camera. The output beam from a 488-nm continuous laser (Coherent, Sapphire LPX 488, 400 mW) was expanded 12 times by three beam expanders (one 3×, Thorlabs, GBE03-A; two 2×, Thorlabs GBE02-A) after being modulated by an acousto-optic tunable filter (AOTF; AA Opto-Electronic, AOTFnC-400.650-TN). Beam polarization was rotated to vertical by an achromatic half-wave plate (HWP; Bolder Vision Optik, BVO AHWP3) before a polarizing beam splitter (Thorlabs, PBS251), maximizing beam power reflected to the spatial light modulator (SLM), and a second HWP was placed between the polarizing beam splitter and the SLM (Forth Dimension Displays Ltd., QXGA-3DM), maximizing diffraction efficiency of the SLM. The SLM was positioned in conjugation to the sample plane. The polarization of diffracted light was further controlled by an HWP mounted in a fast rotator (FR, Finger Lakes Instrumentation, A24021) to ensure maximum interference and, thus, illumination contrast at the sample plane. A physical mask was placed at the focal plane of the first lens (L1, FL = 150 mm) after the SLM, exclusively selecting the two first-order diffraction beams. The mask was then imaged onto the objective (Nikon, CFI Apo LWD 25×, 1.1 NA and 2-mm WD) back focal plane with a pair of lenses (L2-L3, FL = 125 and 400 mm), allowing the two beams to interfere at the sample plane, generating a harmonic patterned illumination. A dichroic mirror (D2, Semrock, Di-R405/488/561/635-t3–25 × 36) was placed between L3 and the objective, reflecting illumination and transmitting emitted fluorescence. Emitted fluorescence was collected with the same objective, whose back focal plane was relayed to the DM (Iris AO, PTT489) by a pair of lenses (L4-L5, FL = 400 and 175 mm). The DM-reflected fluorescence was then focused and imaged on the SIM camera (Hamamatsu, Orca Flash 4.0) by 3 lenses (L6-L7-L8, FL = 300, 85, and 75 mm).
For the TPE-AO pathway (fig. S1B), a guide star in the sample was two-photon excited, and its emitted fluorescence wavefront was measured to obtain sample-induced optical aberration. The output beam from a Ti:sapphire laser (Coherent, Chameleon Ultra II) was expanded by a beam expander (2×, Thorlabs, GBE02-B) after a Pockels Cell (ConOptics, 302 RM). The TPE beam was scanned with a pair of galvanometer mirrors (Cambridge, H2105) optically conjugated with a pair of lenses (L12-L11, FL = 85 mm). A pair of achromatic lenses (L10-L9, FL = 85 and 300 mm) conjugated the galvos with the DM. Emitted TPE fluorescence first followed the same path as in the OS-SIM mode and was reflected by the same DM. The MM controlled by an electric nanopositioning stage (SmarAct, modular control system) was placed to reflect the fluorescence after the DM. After being descanned by the galvanometer pair, the fluorescence was reflected by a dichroic mirror (D3, Semrock, Di03-R785-t3-25×36) and relayed to an SH sensor by a pair of lenses (L13-L14, FL = 60 and 175 mm). The SH sensor was composed of a lenslet array (Advanced Microoptic Systems GmbH) and a camera (Hamamatsu, Orca Flash 4.0) placed at the focal plane of the lenslet array. Shifts of SH pattern spots were used to calculate wavefront distortion. This information was then used to control the DM and correct the measured aberrations. The TPE-AO pathway also allowed two-photon imaging (Fig. 4, B and E) when a dichroic mirror (D1, Semrock, Di02-R785-25×36) was placed into the light path. Emitted fluorescence was reflected by D2 and focused on the photomultiplier tube (PMT, Hamamatsu, H7422-40).
In all experiments, before measuring and correcting sample-induced aberrations, we performed system correction for the microscope’s own aberrations coming from imperfect and/or misaligned optical components. System aberrations were measured in the OS-SIM pathway using the phase retrieval approach based on the Gerchberg-Saxton algorithm (37), and system aberrations were then corrected by the DM. After system correction, we switched to the TPE-AO pathway and scanned the TPE over an aberration-free guide star (10 μm by 10 μm area), a single 2-μm bead on a glass slide (see the “Beads sample on glass slide” section). The SH camera recorded an array of images (SH pattern) of this aberration-free guide star, and this pattern served as the SH “reference pattern.” When measuring sample-induced aberrations, we scanned the TPE laser (typically over 10 μm by 10 μm to 20 μm by 20 μm area) in the sample plane of interest over fluorescent structures (e.g., a soma in the mouse brain) and recorded another SH pattern. We then calculated spot shifts from the SH reference pattern and derived local wavefront slopes. Wavefront was then computationally reconstructed assuming spatially continuous aberrations. Then, an opposite corrective wavefront pattern was applied to the deformable to cancel the sample-induced aberrations before image formation on the SIM camera.
In our optimized OS-SIM technique, we captured three images with spatially shifted sinusoidal interference illumination patterns to reconstruct one SIM frame. The spatial frequency of the stripes, kp, was most often chosen to be half of the cutoff frequency of the optical system, k0, to maximize its optical sectioning strength. When imaging the zebrafish larvae with strong background fluorescence, we reduced kp to 0.125 k0 to increase the depth of field of the modulation so that the modulated signal was more easily detected. All other experimental parameters were listed in table S1.
For data analysis, we followed the flowchart in fig. S4. When analyzing in vivo imaging data, we first performed two to three rounds of image registration by maximizing the cross-correlation of each frame with their averaged image in the Fourier domain. Then, for each spatially registered frame, we used noniterative Wicker phase estimation (13), and from the three raw frames, we calculated a motion-corrected SIM image Ibasic SIM using Eq. (4). We generated a widefield image IWF by averaging three raw SI images, and when imaging live animals, we corrected motion artifacts by applying Gaussian-shaped filters to attenuate ±kp and ±2kp components of IWF. The final refined OS-SIM image resulted from a weighted summation of the low-frequency component of Ibasic SIM (with a Gaussian low-pass filter with SD σ) and the high-frequency component of IWF (by a complementary Gaussian high-pass filter) scaled by a factor α. The value of σ, the crossover frequency, was chosen to balance artifact suppression and optical sectioning. Larger σ means that we take more information from the basic SIM image, while small σ means more information from the widefield image, which typically has higher SNR than the basic SIM image. When imaging samples with high SNR such as fixed brain slices and zebrafish motor neurons, we used larger σ (σ ≈ 0.5 kp) to better exploit the optical sectioning capability from the basic SIM image. When imaging noisy samples, we used smaller σ (0.15 to 0.3 kp) to sacrifice optical sectioning for better image quality. The scaling factor α weights IWF to ensure a smooth amplitude transition from a low-frequency component (from Ibasic SIM) to a high-frequency component (from IWF). The value of α was determined by the modulation depth (i.e., the contrast of the SI), which can be either precisely calculated using the correlation-based algorithm (38) or empirically estimated by final image quality. In our experiments, the scaling factor was set to be 1.0 for fluorescence beads, 0.8 for mouse brain and zebrafish, and 0.5 for fly larva. Computationally, on an Intel Xeon E3-1231 v3 CPU (central processing unit) (3.40 GHz) and 16-GB RAM (random access memory), computing one SIM image (512 × 512 pixels) took ~0.3 s for registration, ~0.2 s for parameter estimation, and ~50 ms for SIM reconstruction.
3D bead sample preparation and imaging
Five microliters of stock solution of 0.1-μm-diameter fluorescent beads (ThermoFisher Scientific FluoSpheres Carboxylate-Modified Microspheres, yellow-green fluorescent 505/515) was mixed with 4 ml of 1% aqueous agarose solution. This mixture was then poured onto a glass-bottomed petri dish (MatTek No. 1.5 coverslip, 0.16 to 0.19 mm thick) and was allowed to solidify at room temperature. Beads were imaged through the No. 1.5 coverslip. Tilting of the 3D beads sample was controlled by a 2D goniometer platform (Thorlabs, GNL 10).
Beads sample on glass slide
Fluorescent beads of 2 μm in diameter (ThermoFisher Scientific FluoSpheres Carboxylate-Modified Microspheres, yellow-green 505/515) were two-photon excited and imaged in an aberration-free system, and the resulting pattern on the SH sensor was used as a reference for aberration measurement. The stock solution was diluted to 1:500 in deionized water and then added on a microscope glass slide precoated with poly-l-lysine hydrobromide (10 mg/ml; Sigma-Aldrich, P7890). The same method was followed to prepare 0.1-μm fluorescent bead sample for diffraction-limited axial resolution measurement (1:10k dilution).
Animal experiments
All experiments involving animals were approved by the Animal Care and Use Committee at the University of California, Berkeley. Detailed materials and methods are available below.
Fixed mouse brain slices preparation
A Thy1-GFP line M transgenic mouse (the Jackson laboratory, stock 007788) was used for preparation of brain slices. After being deeply anesthetized with isoflurane (Piramal), a standard transcardial perfusion was performed first with phosphate-buffered saline (PBS; Invitrogen) followed by 4% paraformaldehyde (PFA; Electron Microscopy Sciences). The mouse brain was collected and immersed in 2% PFA and 15% sucrose in PBS solution overnight at 4°C. The immersion solution was then replaced with 30% sucrose in PBS, and the brain was stored at 4°C. After 24 hours, the whole mouse brain was cut to 100-μm-thick slices on a microtome (Thermo Scientific, Microm HM430). Brain slices were immersed in PBS and then placed on microscope glass slides, and allowed to dry for 45 min. Cover glass (Fisherbrand, No. 1.5, 0.16 to 0.19 mm thick) with mounting medium (Vectashield Hardset Antifade mounting medium, H-1400) was then placed on top of the glass slides with brain slices. Slices were ready for imaging after the mounting medium completely hardened. During imaging, brain slice samples were placed on a 2D goniometer platform (Thorlabs, GNL 10).
Cranial window implantation and in vivo mouse imaging
All mice (Thy1-GFP line M, the Jackson laboratory, stock 007788) were at least 9 weeks old at the time of cranial window installation. Mice were deeply anesthetized under isoflurane (2.0% by volume in O2) during the whole process of cranial window implantation. A 3.5-mm-diameter craniotomy was created over the left cortex with dura intact. A cranial window was made by gluing (Norland 68 Optical Adhesive) together a glass ring (with inner diameter of 3 mm and outer diameter of 4.5 mm) and a glass disk (with diameter of 3.5 mm), both laser cut from standard microscope cover glass (Fisherbrand, No. 1.5, 0.16 to 0.19 mm thick). The cranial window was embedded into the craniotomy and was glued onto the skull by Vetbond (3M Vetbond). Then, a titanium head-bar was fixed on the skull with Vetbond and fast curing orthodontic acrylic resin (Lang Dental Mfg). In vivo imaging was conducted in mice under isoflurane anesthesia (0.5 to 1.0% by volume in O2) immediately after surgery.
Zebrafish care and preparation
Transgenic zebrafish Tg(isl1:GFP) (24) was a gift from D. Schoppik. Larval zebrafish were treated with phenylthiourea (PTU) from date of birth to prevent growth of pigment. Four days after fertilization, zebrafish larvae were mounted dorsal side up with 1.4% agarose in a glass-bottom petri dish for imaging. Zebrafish was imaged from the top of the petri dish through regular E3 media (made with Instant Ocean) without any cover glass.
Drosophila larvae preparation
We used transgenic Drosophila third instar larvae expressing a postsynaptically targeted GECI based on GCaMP6f, which is expressed in Drosophila larval muscle throughout development [genotype: w1118;OK6-Gal4/UAS-CpxRNAi (BDSC line #42017);MHC-CD8-GCaMP6f-Sh/+]. Before imaging, larvae were dissected using a traditional semi-intact fillet preparation in HL3 solution (concentration: 70 mM NaCl, 5 mM KCl, 0.45 mM CaCl2·2H2O, 20 mM MgCl2·6H2O, 10 mM NaHCO3, 5 mM trehalose, 115 mM sucrose, and 5 mM HEPES, with pH adjusted to 7.2). During imaging, the larval fillet was maintained in HL3 containing 1.5 mM CaCl2·2H2O and 25 mM MgCl2·6H2O.
Supplementary Material
Acknowledgments
We thank M. Jacobs for assistance with the brain slices preparation and all members of the Ji lab for the helpful discussions and support. We thank E. Carroll for help with electronics. We thank J. Lv for help with the derivation of Eq. (4). Funding: This work was sponsored by the NIH (Q.Z., R.T., and N.J., U01 NS103573; S.-W.C., Z.N., and E.Y.I., U01 MH109069) and the Defense Advanced Research Project Agency (S.-W.C., Z.N., and E.Y.I., N66001-17-C-4015). Z.L. was supported by the China Scholarship Council (CSC) program. Author contributions: N.J. conceived of and supervised the project; Z.L. developed and implemented the OS-SIM theoretical formalism; Q.Z., Z.L., and R.T. designed the microscope system; Q.Z. and Z.L. built the system; Q.Z., Z.L., and N.J. designed the experiments; Z.L. and Q.Z. collected the data; Q.Z., S.-W.C., Z.N., and R.N. contributed to the animal preparations; Z.L. and Q.Z. analyzed the data; Q.D. and E.Y.I. provided mentoring support; and Q.Z., N.J., and Z.L. wrote the manuscript with input from all authors. Competing interests: The authors declare that they have no competing interests. Data and materials availability: All data needed to evaluate the conclusions in the paper are present in the paper and/or the Supplementary Materials. Additional data related to this paper may be requested from the authors.
SUPPLEMENTARY MATERIALS
Supplementary material for this article is available at http://advances.sciencemag.org/cgi/content/full/6/19/eaaz3870/DC1
REFERENCES AND NOTES
- 1.E. R. Kandel, J. H. Schwartz, T. M. Jessell, S. A. Siegelbaum, A. J. Hudspeth, Principles of Neural Science, Fifth Edition (McGraw-Hill Education, 2012). [Google Scholar]
- 2.J. B. Pawley, Handbook of Biological Confocal Microscopy (ed. 3, 2008).
- 3.Conchello J.-A., Lichtman J. W., Optical sectioning microscopy. Nat. Methods 2, 920–931 (2005). [DOI] [PubMed] [Google Scholar]
- 4.Helmchen F., Denk W., Deep tissue two-photon microscopy. Nat. Methods 2, 932–940 (2005). [DOI] [PubMed] [Google Scholar]
- 5.Centonze V. E., White J. G., Multiphoton excitation provides optical sections from deeper within scattering specimens than confocal imaging. Biophys. J. 75, 2015–2024 (1998). [DOI] [PMC free article] [PubMed] [Google Scholar]
- 6.Neil M. A. A., Juškaitis R., Wilson T., Method of obtaining optical sectioning by using structured light in a conventional microscope. Opt. Lett. 22, 1905 (1997). [DOI] [PubMed] [Google Scholar]
- 7.Ji N., Adaptive optical fluorescence microscopy. Nat. Methods 14, 374–380 (2017). [DOI] [PubMed] [Google Scholar]
- 8.Feng G., Mellor R. H., Bernstein M., Keller-Peck C., Nguyen Q. T., Wallace M., Nerbonne J. M., Lichtman J. W., Sanes J. R., Imaging neuronal subsets in transgenic mice expressing multiple spectral variants of GFP. Neuron 28, 41–51 (2000). [DOI] [PubMed] [Google Scholar]
- 9.Hagen N., Gao L., Tkaczyk T. S., Quantitative sectioning and noise analysis for structured illumination microscopy. Opt. Express 20, 403–413 (2012). [DOI] [PMC free article] [PubMed] [Google Scholar]
- 10.Lim D., Chu K. K., Mertz J., Wide-field fluorescence sectioning with hybrid speckle and uniform-illumination microscopy. Opt. Lett. 33, 1819–1821 (2008). [DOI] [PubMed] [Google Scholar]
- 11.Lim D., Ford T. N., Chu K. K., Mertz J., Optically sectioned in vivo imaging with speckle illumination HiLo microscopy. J. Biomed. Opt. 16, 016014 (2011). [DOI] [PMC free article] [PubMed] [Google Scholar]
- 12.Kim D. H., Kim J., Marques J. C., Grama A., Hildebrand D. G. C., Gu W., Li J. M., Robson D. N., Pan-neuronal calcium imaging with cellular resolution in freely swimming zebrafish. Nat. Methods 14, 1107–1114 (2017). [DOI] [PubMed] [Google Scholar]
- 13.Wicker K., Non-iterative determination of pattern phase in structured illumination microscopy using auto-correlations in Fourier space. Opt. Express 21, 24692–22701 (2013). [DOI] [PubMed] [Google Scholar]
- 14.Turcotte R., Liang Y., Tanimoto M., Zhang Q., Li Z., Koyama M., Betzig E., Ji N., Dynamic super-resolution structured illumination imaging in the living brain. Proc. Natl. Acad. Sci. 116, 9586–9591 (2019). [DOI] [PMC free article] [PubMed] [Google Scholar]
- 15.Cole M. J., Siegel J., Webb S. E. D., Jones R., Dowling K., Dayel M. J., Parsons-Karavassilis D., French P. M. W., Lever M. J., Sucharov L. O. D., Neil M. A. A., Juskaitis R., Wilson T., Time-domain whole-field fluorescence lifetime imaging with optical sectioning. J. Microsc. 203, 246–257 (2001). [DOI] [PubMed] [Google Scholar]
- 16.Débarre D., Botcherby E. J., Booth M. J., Wilson T., optics for structured illumination microscopy. Opt. Express 16, 9290–9305 (2008). [DOI] [PubMed] [Google Scholar]
- 17.Wang K., Sun W., Richie C. T., Harvey B. K., Betzig E., Ji N., Direct wavefront sensing for high-resolution in vivo imaging in scattering tissue. Nat. Commun. 6, 7276 (2015). [DOI] [PMC free article] [PubMed] [Google Scholar]
- 18.Wang K., Milkie D. E., Saxena A., Engerer P., Misgeld T., Bronner M. E., Mumm J., Betzig E., Rapid adaptive optical recovery of optimal resolution over large volumes. Nat. Methods 11, 625–628 (2014). [DOI] [PMC free article] [PubMed] [Google Scholar]
- 19.Aviles-Espinosa R., Andilla J., Porcar-Guezenec R., Olarte O. E., Nieto M., Levecq X., Artigas D., Loza-Alvarez P., Measurement and correction of in vivo sample aberrations employing a nonlinear guide-star in two-photon excited fluorescence microscopy. Biomed. Opt. Express 2, 3135–3149 (2011). [DOI] [PMC free article] [PubMed] [Google Scholar]
- 20.Hofer H., Artal P., Singer B., Aragón J. L., Williams D. R., Dynamics of the eye’s wave aberration. J. Opt. Soc. Am. A Opt. Image Sci. Vis. 18, 497–506 (2001). [DOI] [PubMed] [Google Scholar]
- 21.Turcotte R., Liang Y., Ji N., Adaptive optical versus spherical aberration corrections for in vivo brain imaging. Biomed. Opt. Express 8, 3891–3902 (2017). [DOI] [PMC free article] [PubMed] [Google Scholar]
- 22.Holtmaat A., Bonhoeffer T., Chow D. K., Chuckowree J., De Paola V., Hofer S. B., Hübener M., Keck T., Knott G., Lee W.-C. A., Mostany R., Mrsic-Flogel T. D., Nedivi E., Portera-Cailliau C., Svoboda K., Trachtenberg J. T., Wilbrecht L., Long-term, high-resolution imaging in the mouse neocortex through a chronic cranial window. Nat. Protoc. 4, 1128–1144 (2009). [DOI] [PMC free article] [PubMed] [Google Scholar]
- 23.Ericson J., Thor S., Edlund T., Jessell T. M., Yamada T., Early stages of motor neuron differentiation revealed by expression of homeobox gene Islet-1. Science 256, 1555–1560 (1992). [DOI] [PubMed] [Google Scholar]
- 24.Higashijima S., Hotta Y., Okamoto H., Visualization of cranial motor neurons in live transgenic zebrafish expressing green fluorescent protein under the control of the Islet-1 promoter/enhancer. J. Neurosci. 20, 206–218 (2000). [DOI] [PMC free article] [PubMed] [Google Scholar]
- 25.Ruiz-Cañada C., Budnik V., Introduction on the use of the Drosophila embryonic/larval neuromuscular junction as a model system to study synapse development and function, and a brief summary of pathfinding and target recognition. Int. Rev. Neurobiol. 75, 1–31 (2006). [DOI] [PubMed] [Google Scholar]
- 26.Louis Newman Z., Hoagland A., Aghi K., Worden K. L., Levy S. L., Son J. H., Lee L. P., Isacoff E. Y., Input-specific plasticity and homeostasis at the Drosophila larval neuromuscular junction. Neuron 93, 1388–1404.e1O (2017). [DOI] [PMC free article] [PubMed] [Google Scholar]
- 27.Chen T.-W., Wardill T. J., Sun Y., Pulver S. R., Renninger S. L., Baohan A., Schreiter E. R., Kerr R. A., Orger M. B., Jayaraman V., Looger L. L., Svoboda K., Kim D. S., Ultrasensitive fluorescent proteins for imaging neuronal activity. Nature 499, 295–300 (2013). [DOI] [PMC free article] [PubMed] [Google Scholar]
- 28.Ma Y., Li D., Smith Z. J., Li D., Chu K., Structured illumination microscopy with interleaved reconstruction (SIMILR). J. Biophotonics 11, e201700090 (2018). [DOI] [PubMed] [Google Scholar]
- 29.Power R. M., Huisken J., A guide to light-sheet fluorescence microscopy for multiscale imaging. Nat. Methods 14, 360–373 (2017). [DOI] [PubMed] [Google Scholar]
- 30.Dunsby C., Optically sectioned imaging by oblique plane microscopy. Opt. Express 16, 20306–20316 (2008). [DOI] [PubMed] [Google Scholar]
- 31.Bouchard M. B., Voleti V., Mendes C. S., Lacefield C., Grueber W. B., Mann R. S., Bruno R. M., Hillman E. M. C., Swept confocally-aligned planar excitation (SCAPE) microscopy for high-speed volumetric imaging of behaving organisms. Nat. Photonics 9, 113–119 (2015). [DOI] [PMC free article] [PubMed] [Google Scholar]
- 32.Liu T.-L., Upadhyayula S., Milkie D. E., Singh V., Wang K., Swinburne I. A., Mosaliganti K. R., Collins Z. M., Hiscock T. W., Shea J., Kohrman A. Q., Medwig T. N., Dambournet D., Forster R., Cunniff B., Ruan Y., Yashiro H., Scholpp S., Meyerowitz E. M., Hockemeyer D., Drubin D. G., Martin B. L., Matus D. Q., Koyama M., Megason S. G., Kirchhausen T., Betzig E., Observing the cell in its native state: Imaging subcellular dynamics in multicellular organisms. Science 360, eaaq1392 (2018). [DOI] [PMC free article] [PubMed] [Google Scholar]
- 33.Wang F., Wan H., Ma Z., Zhong Y., Sun Q., Tian Y., Qu L., Du H., Zhang M., Li L., Ma H., Luo J., Liang Y., Li W. J., Hong G., Liu L., Dai H., Light-sheet microscopy in the near-infrared II window. Nat. Methods 16, 545–552 (2019). [DOI] [PMC free article] [PubMed] [Google Scholar]
- 34.Richie C. T., Whitaker L. R., Whitaker K. W., Necarsulmer J., Baldwin H. A., Zhang Y., Fortuno L., Hinkle J. J., Koivula P., Henderson M. J., Sun W., Wang K., Smith J. C., Pickel J., Ji N., Hope B. T., Harvey B. K., Near-infrared fluorescent protein iRFP713 as a reporter protein for optogenetic vectors, a transgenic Cre-reporter rat, and other neuronal studies. J. Neurosci. Methods 284, 1–14 (2017). [DOI] [PMC free article] [PubMed] [Google Scholar]
- 35.Baloban M., Shcherbakova D. M., Pletnev S., Pletnev V. Z., Lagarias J. C., Verkhusha V. V., Designing brighter near-infrared fluorescent proteins: Insights from structural and biochemical studies. Chem. Sci. 8, 4546–4557 (2017). [DOI] [PMC free article] [PubMed] [Google Scholar]
- 36.Chernov K. G., Redchuk T. A., Omelina E. S., Verkhusha V. V., Near-infrared fluorescent proteins, biosensors, and optogenetic tools engineered from phytochromes. Chem. Rev. 117, 6423–6446 (2017). [DOI] [PubMed] [Google Scholar]
- 37.Gerchberg R. W., Saxton W. O., A practical algorithm for the determination of the phase from image and diffraction plane pictures. Optik 35, 237–246 (1972). [Google Scholar]
- 38.Müller M., Mönkemöller V., Hennig S., Hübner W., Huser T., Open-source image reconstruction of super-resolution structured illumination microscopy data in ImageJ. Nat. Commun. 7, 10980 (2016). [DOI] [PMC free article] [PubMed] [Google Scholar]
Associated Data
This section collects any data citations, data availability statements, or supplementary materials included in this article.
Supplementary Materials
Supplementary material for this article is available at http://advances.sciencemag.org/cgi/content/full/6/19/eaaz3870/DC1