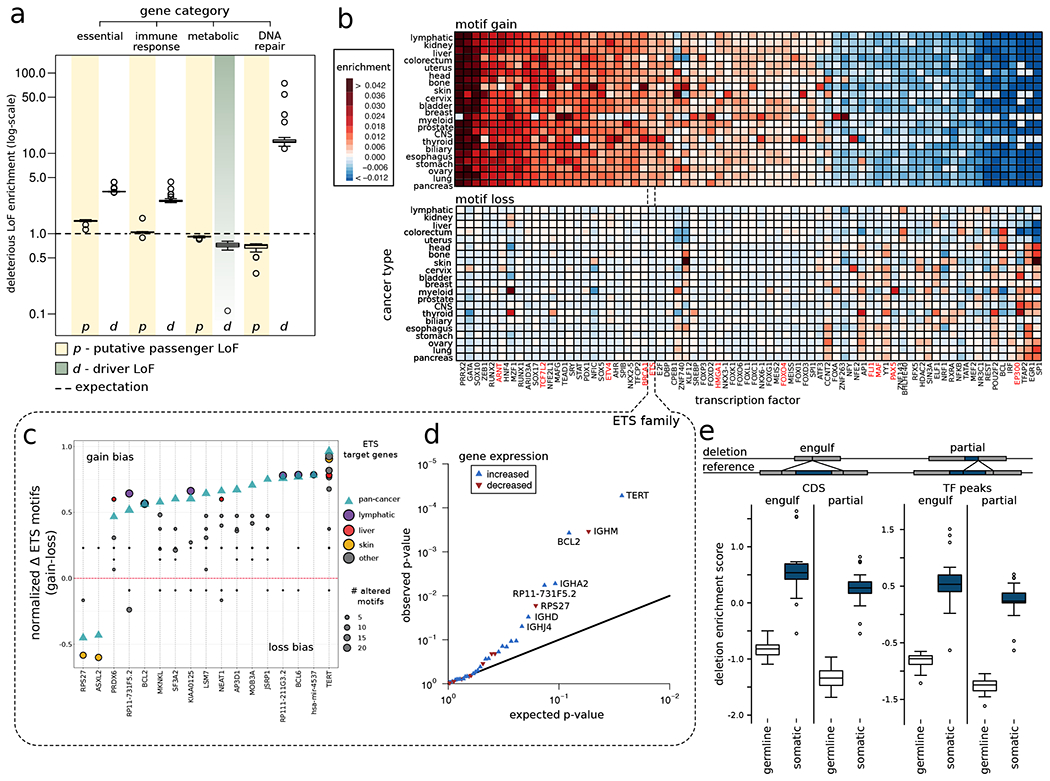
Figure 2: Overall functional burdening of different genomic elements:

a) Percentage of genes in different gene categories affected by driver (grey band) and putative passenger (faded yellow band) LoFs compared to uniform background expectation (dashed black line). Data points in boxplot correspond to different tumor types. b) Heatmap showing enrichment (red color) and depletion (blue color) of motif gain (upper panel) and loss (bottom panel) events induced by putative passenger mutations for various TFs compared to a uniform genomic background. TFs highlighted in red are well-known cancer genes. c) Gain (positive alteration bias) and loss (negative alteration bias) of motif events observed among target genes (on x-axis) regulated by the ETS TF family. The green triangle denotes alteration bias on the pan-cancer level, whereas colored circles correspond to alteration bias for different cancer cohorts. The size of the circles corresponds to the frequency of motif-altering events. d) Q-Q plot showing genes that are differentially expressed due to gain-of-motif events in TFs belonging to the ETS TF family. e) Enrichment of germline and somatic large deletions that can engulf or partially delete coding regions and TF binding peaks. See also supplement Fig. S2.
