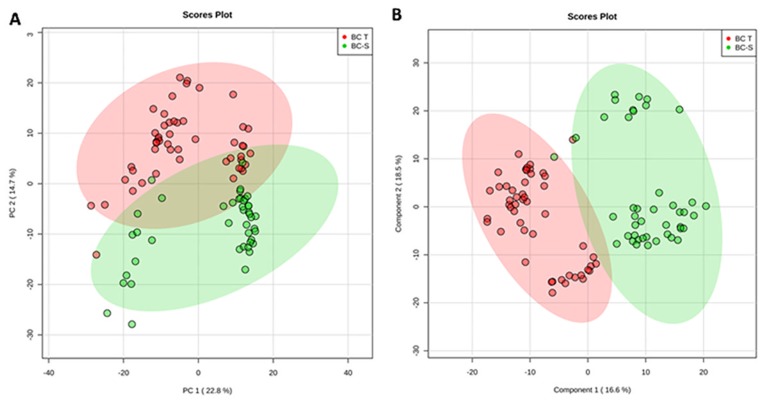
Figure 1. Tissue metabolomics multivariate analysis.
BC-T: IDC; BC-S: non-tumor adjacent breast tissue. (A) Principal component analysis (PCA) showing the natural separation between breast tumor and non-tumor adjacent breast tissues. (B) Partial least square discriminant analysis (PLS-DA) showing robust separation among the groups (BC-T vs BC-S). Each point in the plot corresponds to a tissue sample.

