

SUMMARY
Autism is characterized by repetitive behaviors, impaired social interactions, and communication deficits. It is a prevalent neurodevelopmental disorder, and available treatments offer little benefit. Here we show that genetically reducing the protein tau prevents behavioral signs of autism in two mouse models simulating distinct causes of this condition. Similar to a proportion of people with autism, both models have epilepsy, abnormally enlarged brains, and overactivation of the phosphatidylinositol 3-kinase (PI3K)/Akt (protein kinase B)/ mammalian target of rapamycin (mTOR) signaling pathway. All of these abnormalities were prevented or markedly diminished by partial or complete genetic removal of tau. We identify disinhibition of phosphatase and tensin homolog deleted chromosome 10 (PTEN), a negative PI3K regulator that tau controls, as a plausible mechanism and demonstrate that tau interacts with PTEN via tau’s proline-rich domain. Our findings suggest an enabling role of tau in the pathogenesis of autism and identify tau reduction as a potential therapeutic strategy for some of the disorders that cause this condition.
Keywords: Akt, autism spectrum disorders, Cntnap2, megalencephaly, mTOR, PI3 kinase, PTEN, Scn1a, Shank3, tau
eToc Blurb:
(No longer than 50 words. Please target it to non-specialists in plain language, without experimental detail. Must be written in the third person (i.e. First Author et al.) and in present tense.)
The prevalence of autism has risen sharply during the last few decades and better treatment strategies are urgently needed. Tai et al. demonstrate that the tau enables autism-like behaviors and that even partial reduction of this protein prevents such behaviors and related neural abnormalities in independent mouse models.
INTRODUCTION
Roughly 1% of the world’s population is thought to have an autism spectrum disorder (ASD) (Mullins et al., 2016; Won et al., 2013). Diagnosis of these conditions has increased sharply over the last few decades (Baio et al., 2018), and their economic cost in 2015 was estimated at $268 billion in the U.S. alone (Leigh and Du, 2015). The two drugs approved by the Food and Drug Administration to treat ASDs offer little or no benefit for the core symptoms, highlighting the need for additional therapeutic strategies. Despite their shared core symptoms, ASDs are diverse (Geschwind, 2009; Lord et al., 2000; Maski et al., 2011), distinguished by the variable presence of epilepsy, intellectual disability, hyperactivity, anxiety-related behaviors, delayed psychomotor development, attention deficits, gastrointestinal disturbances, and sleep disorders (Geschwind, 2009; Lord et al., 2000; Maski et al., 2011). Roughly one-third of ASD patients have a seizure disorder (Geschwind, 2009; Maski et al., 2011; Tuchman et al., 2010). Many suffer from epileptic seizures throughout life and derive little or no benefit from existing anti-epileptic drugs (Maski et al., 2011; Tuchman et al., 2010). We previously showed that genetic ablation or reduction of the microtubule-associated protein tau (MAPT) prevents or reduces epilepsy of diverse causes, including in a mouse model of Dravet syndrome (Gheyara et al., 2014), a severe, treatment-resistant seizure disorder of early childhood onset that is frequently associated with signs of autism (Berkvens et al., 2015; Li et al., 2011). Because tau reduction suppresses not only epilepsy and seizure-related sudden death in these mice, but also learning and memory deficits (Gheyara et al., 2014), we hypothesized that it would also mitigate their autism-like phenotype. In testing this hypothesis, we discovered a surprising role of tau in ASD pathogenesis that extends the impact of this intriguing protein from age-related neurodegenerative diseases to neurodevelopmental disorders.
RESULTS
Tau Reduction Prevents Autism-like Behaviors in Scn1aRX/+ and Cntnap2−/− Mice
We genetically reduced tau levels in hemizygous knock-in mice carrying a Dravet syndrome-causing truncation mutation (R1407X) in one Scn1a allele (Ogiwara et al., 2007). Mutations in SCN1A, which encodes the pore-forming α-subunit of the voltage-gated sodium channel type 1 (NaV1.1) (Catterall, 2017), are a frequent cause of Dravet syndrome in humans (Claes et al., 2001). Mouse models with Nav1.1 hypofunction, including Scn1aRX/+ mice, show striking similarities to Dravet patients, including severe early-onset seizures, premature mortality, as well as cognitive abnormalities and autism-like behaviors in those that survive beyond infancy (Han et al., 2012; Ito et al., 2013; Ogiwara et al., 2007).
To assess the role of tau in these abnormalities, we crossed Scn1aRX/+ mice and Scn1a+/+ controls onto the Mapt+/+, Mapt+/−, and Mapt−/− genetic backgrounds as described (Gheyara et al., 2014), which impart brain tau levels that are 100%, ~50%, and 0% of wild-type (WT) control levels, respectively (Dawson et al., 2001). Mice of the six genotypes that resulted from these crosses were tested for autism-like behaviors at 4–7 months of age. Note that the statistical analysis of data obtained in this study is described in the figure legends and justified in detail in STAR Methods.
We first studied repetitive stereotyped movements, which are observed in diverse ASDs and can be readily identified and quantified in mouse models (Kalueff et al., 2016; Silverman et al., 2010). On the Mapt+/+ background, Scn1aRX/+ mice showed the expected increase in repetitive self-grooming behaviors, as compared to Scn1a+/+ controls (Figure 1A). Partial reduction or complete ablation of tau prevented this behavioral abnormality in Scn1aRX/+ mice, but did not affect repetitive self-grooming in Scn1a+/+ mice (Figure 1A), suggesting that the development of this autism-like behavior requires >50% of physiological tau levels, at least in this particular model.
Figure 1 |. Tau Reduction Prevents Autism-like Behaviors in Scn1aRX/+ and Cntnap2−/− Mice.

(A–E) Male Scn1a+/+ and Scn1aRX/+ mice with 2, 1, or 0 Mapt alleles were assessed for autism-like behaviors at 4–7 months of age. In all figures, numbers inside or above bars indicate number of mice per group unless indicated otherwise. (A) Self-grooming behavior. The time mice spent grooming themselves was recorded for 10 minutes. (B) Relearning test. Mice were first trained to locate a submerged escape platform at the end of one arm of a water T-maze (Figure S1A). The platform was then moved to the end of the opposite arm and the number of training sessions mice required to learn the new platform location was counted. (C) Reciprocal social interaction test. Sniffing time in pairs of freely interacting mice of matched sex, age and genotype was measured for 10 minutes. (D–E) Olfactory habituation/dishabituation test. (D) Mice were consecutively presented with three olfactory stimuli (3 trials of 2 minutes per odor) and the amount of time they spent sniffing the stimulus was recorded. Male mouse bedding was used as the social odor. Habituation to each odor was measured as the slopes of linear regression lines through the three trials. All groups of mice displayed similar habituation to water and vanilla; for habituation to social odor, Scn1aRX/+Mapt+/+ mice differed from Scn1a+/+Mapt+/+ (P = 0.0015) and Scn1aRX/+Mapt−/− (P = 0.0019) mice, as determined by generalized estimating equation (GEE) framework analysis. Dishabituation was measured as the difference of sniffing time between Vanilla1 and Water3, and Social1 and Vanilla3. All groups of mice displayed similar dishabituation from water to vanilla; for dishabituation from vanilla to social odor, Scn1aRX/+Mapt+/+ mice differed from Scn1a+/+Mapt+/+ (P = 0.023) and Scn1aRX/+Mapt−/− (P = 0.026) mice. n = 10–13 mice/genotype. (E) Amount of time mice spent sniffing the social odor during the first trial for that odor. (F–J) Cntnap2+/+ and Cntnap2−/− mice with 2, 1, or 0 Mapt alleles were assessed for autism-like behaviors. (F) Number of ultrasonic (US) vocalizations made by male and female mouse pups (P5) after separation from their dam. (G) Self-grooming behavior of 3–4-month-old male mice measured as in (A). (H–I) Olfactory habituation/dishabituation test in 7–11-month-old male mice carried out as in (D–E). (H) All groups of mice displayed similar habituation to water and vanilla; for habituation to social odor, Cntnap2−/−Mapt+/+ mice differed from Cntnap2+/+Mapt+/+ (P < 0.0001) and Cntnap2−/−Mapt−/− (P = 0.0035) mice. All groups of mice displayed similar dishabituation from water to vanilla; for dishabituation from vanilla to social odor, Cntnap2−/−Mapt+/+ mice differed from Cntnap2+/+Mapt+/+ (P < 0.0001) and Cntnap2−/−Mapt−/− (P = 0.001) mice. n = 9–17 mice/genotype. (I) Amount of time mice spent sniffing the social odor during the first trial for that odor. (J) Nest building was scored 1, 2, 6, and 24 hours after 7–11-month-old male mice were given nesting material. Area under the curve was computed for each mouse as a measure of nest building performance. n = 12–24 mice/genotype. By two-way ANOVA with Holm-Sidak test, Cntnap2−/− Mapt+/+ mice differed from Cntnap2+/+Mapt+/+ (P = 0.042) and Cntnap2+/+Mapt−/− mice (P = 0.042) and showed a strong trend to also differ from Cntnap2−/−Mapt+/− mice (P = 0.059). Cntnap2+/+Mapt+/+ mice did not differ from Cntnap2+/+Mapt+/− (P = 0.77) or Cntnap2+/+Mapt−/− (P > 0.99) mice. *P < 0.05, **P < 0.01, ***P < 0.001, ****P < 0.0001 vs. Scn1a+/+Mapt+/+ (A–E) or Cntnap2+/+Mapt+/+ (F–J) mice, or as indicated by brackets, determined by two-way ANOVA with Holm-Sidak test (A, B, C, E, F, I, J), GEE framework with Holm-Sidak test (D, H), or multiple Welch’s t tests with Holm-Sidak correction (G). Interaction by two-way ANOVA between Scn1a and Mapt genotypes: (A) P < 0.0001, F2, 65 = 13.66; (B) P = 0.0032, F2, 50 = 6.44; (C) P = 0.0084, F1, 33 = 7.86; (E) P = 0.48, F1, 41 = 0.50; and between Cntnap2 and Mapt genotypes: (F) P = 0.0187, F2, 91 = 4.16; (I) P = 0.23, F1, 47 = 1.46; (J) P = 0.18, F2, 104 = 1.77. n.s., not significant. Values are mean ± SEM.
Another consistent feature of autism is mental inflexibility and insistence on routine or sameness (Silverman et al., 2010). To assess this type of behavioral dysfunction, we determined the number of training sessions mice required to reach criterion in a water T-maze task. On the Mapt+/+ background, Scn1aRX/+ mice had no difficulty learning the original platform location (Figure S1A), but were less able than Scn1a+/+ mice to locate the platform after it had been moved to the opposite arm (Figure 1B). Both complete and partial tau reduction prevented this deficit (Figure 1B), supporting the conclusion that the development of autism-like behaviors in Scn1aRX/+ mice depends on the presence of tau.
Another key feature of autism is abnormalities in social interactions and communication. When reciprocal social interactions were analyzed in freely moving mice, Scn1aRX/+Mapt+/+ mice showed a clear deficit that was prevented by tau ablation (Figure 1C). In a social preference test, Scn1a+/+ mice on the Mapt+/+, Mapt+/−, and Mapt−/− backgrounds displayed normal social preference, interacting more frequently (Figure S1B) and for longer periods (Figure S1C) with an enclosure that contained a live mouse on the “social” side than with an empty enclosure on the “nonsocial” side. As expected (Han et al., 2012; Ito et al., 2013), Scn1aRX/+Mapt+/+ mice showed no such preference (Figure S1, B and C). In contrast, Scn1aRX/+Mapt+/–, and Scn1aRX/+Mapt−/− mice showed a significant social preference (Figure S1, B and C), suggesting that even a 50% reduction of tau can prevent the abnormal social behavior of Scn1aRX/+ mice.
In an olfactory habituation/dishabituation test, Scn1aRX/+ mice and Scn1a+/+ controls on both Mapt+/+ and Mapt−/−− backgrounds displayed similar responsiveness to nonsocial odors and comparable degrees of habituation and dishabituation behavior after sequential exposure to these odors (Figures 1D and 1E), suggesting that neither Nav1.1 hypofunction nor tau ablation significantly impaired basic olfactory functions. However, Scn1aRX/+ mice showed much less responsiveness to a social odor (from mouse bedding) than Scn1a+/+ mice on the Mapt+/+ background (Figure 1D and 1E). Tau ablation prevented this deficit in Scn1aRX/+ mice, and did not affect the behavior in Scn1a+/+ mice (Figure 1D and 1E). Together, these results suggest that tau is required for the development of diverse autism-like behaviors in Scn1aRX/+ mice and that tau reduction is an effective strategy to prevent them.
To determine whether the beneficial effects of tau reduction were unique to autism caused by the SCN1A-R1407X mutation or to the Scn1aRX/+ mouse model, we investigated homozygous Cntnap2 knockout (Cntnap2−/−) mice. Loss-of-function mutations in CNTNAP2, which encodes the neurexin family member contactin-associated protein-like 2, cause cortical dysplasia–focal epilepsy syndrome in humans, a condition combining autism with focal seizures (Strauss et al., 2006). Like humans with such mutations, Cntnap2−/− mice have behavioral abnormalities reminiscent of the three core signs of autism (Penagarikano et al., 2011). However, as in humans with autism of distinct etiologies, the exact pattern of behavioral abnormalities and their time of onset differ in the Scn1aRX/+ and Cntnap2−/− models, and these differences were considered in the design of our experiments.
We crossed Cntnap2−/−mice and Cntnap2+/+ controls onto Mapt+/+, Mapt+/−, and Mapt−/− backgrounds and tested the offspring for autism-like behaviors. One of the earliest detectable behavioral abnormalities in Cntnap2−/− mice on the Mapt+/+ background is a reduction in ultrasonic vocalizations after mouse pups are isolated from their dam, a putative communication deficit with potential relevance to autism (Penagarikano et al., 2011; Silverman et al., 2010). After isolation from their dam, Cntnap2+/+ pups on the Mapt+/+, Mapt+/−, and Mapt−/−backgrounds made similar numbers of distress calls. However, Cntnap2−/−Mapt+/+ pups made fewer calls than Cntnap2+/+Mapt+/+ controls, and complete or partial tau reduction prevented this deficit (Figure 1F).
At 3–4 months of age, Cntnap2−/−Mapt+/+ mice showed an abnormal increase in repetitive self-grooming behaviors as compared with Cntnap2+/+ controls on all three Mapt backgrounds (Figure 1G). This alteration was prevented by complete or partial tau reduction (Figure 1G).
At 7–11 months of age, Cntnap2−/− and Cntnap2+/+ mice on the Mapt+/+ or Mapt−/− background had no difficulty detecting nonsocial odors (Figure 1H). In contrast, Cntnap2−/− Mapt+/+ mice showed much less responsiveness to a social odor than Cntnap2+/+Mapt+/+ mice (Figure 1H and 1I). Tau ablation also prevented this deficit (Figure 1H and 1I).
At 7–11 months of age, Cntnap2−/−Mapt+/+ mice had deficits in nest building (Figure 1J), an innate behavior that may relate to activities of daily living in humans and is partly dependent on the hippocampus (Jirkof, 2014; Silverman et al., 2010). Deficits in nest building have been found in several mouse models of autism (Gheyara et al., 2014; Silverman et al., 2010). Complete or partial tau reduction prevented this deficit (Figure 1J). Tau reduction also diminished epileptic activity in Cntnap2–/– mice (Figure S2), which on the Mapt+/+ background developed later in Cntnap2−/− than in Scn1aRX/+ mice (data not shown). The cohorts of Cntnap2−/−Mapt+/+ mice analyzed in this study had no deficits in the water T-maze paradigm, reciprocal social test, or social preference test (Table S1).
Thus, the tau dependence of ASD-related abnormalities and the ability of tau reduction to prevent them are not unique to the Scn1aRX/+ model. They are also evident in an independent ASD model, whose phenotype is caused by the loss of a very different type of protein.
Megalencephaly and Overactivation of the PI3 Kinase Pathway in Scn1aRX/+ Mice
To unravel the mechanism by which tau reduction counteracts the development of autism-like behaviors, it would be helpful to know their anatomical, biochemical, and neurophysiological substrates. Despite much research, these substrates remain uncertain and may well differ among ASDs and among related animal models. Nevertheless, some neural alterations are associated with ASDs consistently enough to suggest a close and possibly causal relation to the core symptoms of autism. These alterations include developmental brain enlargement (megalencephaly) (Klein et al., 2013; Sacco et al., 2015) and overactivation of the phosphatidylinositol 3-kinase (PI3K)/Akt (protein kinase B)/mammalian target of rapamycin (mTOR) pathway (Ebert and Greenberg, 2013; Enriquez-Barreto and Morales, 2016; Yeung et al., 2017).
Megalencephaly, the most common anatomical characteristic of ASDs, occurs in 14–34% of people with autism (Sacco et al., 2015). The brain weight of male (Figure 2A) and female (Figure S3A) Scn1aRX/+ mice on the Mapt+/+ background began to exceed that of WT controls by roughly 10 weeks of age, whereas the body weights of WT and Scn1aRX/+ mice remained similar (Figure S3, B and C). In a subset of mice, we determined that this excessive brain growth was associated with a commensurate increase in brain volume (Figure S3D), but not with changes in brain density (Figure S3E). Notably, the megalencephaly preceded or coincided with the emergence of locomotor hyperactivity, excessive repetitive movements, and social deficits in Scn1aRX/+ mice (Figure 2, B to D), raising the possibility that it causally contributes to the development of behavioral abnormalities in this model. The hippocampus and particularly the dentate gyrus were clearly larger in Scn1aRX/+ than Scn1a+/+ mice, in line with their megalencephaly (Figure 2, E to G).
Figure 2 |. Development of Autism-like Behaviors is Associated with Megalencephaly and Overactivation of the PI3K/Akt/mTOR Pathway in Scn1aRX/+ Mice.

Scn1a+/+ (WT) and Scn1aRX/+ mice on the Mapt+/+ background were compared at different ages. (A) Brain weights of male mice. Representative brain images are shown above. Interaction between age and brain weight by two-way ANOVA: P = 0.006, F6, 135 = 3.179. Brain weights of female mice and body weights of the same female and male mice are shown in Figure S3A–C. (B–D) Different groups of mice were tested at different ages in three behavioral paradigms. (B) Number of total movements in the open field recorded for 10 minutes. Interaction between age and movements by two-way ANOVA: P < 0.0001, F5, 134 = 24.96. (C) Time spent self-grooming. (D) Social interactions measured as in Figure S1C. (E–G) Volumes of the hippocampus (F) and dentate gyrus (G) measured at 9 months of age. The photomicrographs in (E) are representative images of Nissl-stained coronal hippocampal sections. Scale bars: 0.5 mm. (H–J) Hippocampal levels of pAkt, total Akt, pS6 (Ser235/236), and total S6 were determined by western blot analysis at the indicated postnatal (P) ages. (H) Representative western blots. (I–J) Relative hippocampal signal ratios for pAkt/total Akt (I) and pS6 (Ser235/236)/total S6 (J). For each age, measurements were normalized to the average of WT samples on the same gel (defined as 1.0). By two-way ANOVA, interaction between age and pAkt (I): P = 0.0004, F3, 35 = 7.77; and between age and pS6 (Ser235/236) (J): P = 0.0049, F3, 35 = 5.11. Similar results were obtained for pS6 (Ser240/244), as shown in Figure S4D. (K and L) Images of coronal hippocampal sections depicting typical levels of pAkt (K) and pS6 (L) immunoreactivities at P30. Scale bars: 0.5 mm. *P < 0.05, **P < 0.01, ***P < 0.001, ****P < 0.0001 vs. age-matched WT or as indicated by brackets, determined by two-way ANOVA with Holm-Sidak test (A, B, I, J), Kruskal-Wallis and Dunn tests (C), two-tailed paired t tests with Holm-Sidak correction (D), or unpaired, two-tailed Student’s t test (F, G). n.s., not significant. Values are mean ± SEM.
A signaling cascade involving PI3K, Akt, and mTOR (Figure 3) regulates neuronal size, dendritic arborization, axonal growth, and synapse formation and plasticity, and can promote the development of megalencephaly (Ebert and Greenberg, 2013; Enriquez-Barreto and Morales, 2016). Evidence for aberrant activity of this pathway has been identified in multiple ASDs, including Rett syndrome, fragile X syndrome, Cowden syndrome, neurofibromatosis type 1, and tuberous sclerosis (Enriquez-Barreto and Morales, 2016). Single-gene mutations with a high prevalence in ASDs further implicate this pathway in the pathogenesis of these disorders (Enriquez-Barreto and Morales, 2016; Yeung et al., 2017).
Figure 3 |. Working Model.

By causing network dysfunction or through more direct mechanisms, different triggers of ASD pathogenesis overactivate the PI3K/Akt/mTOR pathway, which in turn contributes to the development of core autism symptoms through diverse anatomical (e.g., megalencephaly, neuronal hypertrophy, and hyperconnectivity) and functional (e.g., hypersynchrony, E/I imbalance, and alterations in synaptic transmission, plasticity or scaling) mechanisms. Tau reduction counteracts this process by reducing network dysfunction and releasing the activity of PTEN, which is inhibited by tau and suppresses the activity of the PI3K/Akt/mTOR pathway.
The pathway is triggered when PI3K phosphorylates phosphatidylinositol-4,5-biphosphate (PIP2), converting it to phosphatidylinositol (3,4,5)-triphosphate (PIP3) (Whitman et al., 1985). PIP3 helps activate Akt, which activates mTOR and leads to phosphorylation of the S6 ribosomal protein (Figure 3). On the Mapt+/+ background, hippocampal levels of phosphorylated (p) Akt and S6 were higher in Scn1aRX/+ mice than in Scn1a+/+ controls at postnatal day (P) 22, P45, and P90, but not at P10, as shown by western blot analysis (Figure 2, H to J). Overactivation of pAkt and pS6 was still evident in Scn1aRX/+ mice at 9–10 months of age (Figure S4, A and B). The increased phosphorylation of S6 in Scn1aRX/+ mice was evident at both Ser235/236 (Figure 2H, 2J and Figure S4C) and Ser240/244 (Figure S4D), indicating increased mTOR activity. Compared with age-matched Scn1a+/+ controls, young Scn1aRX/+ mice also had higher levels of pAkt and pS6 in the hippocampus and dentate gyrus by immunostaining (Figure 2, K and L). The early increase in pAkt and pS6 suggests that overactivation of the PI3K/Akt/mTOR pathway may be a causal driver of the behavioral and anatomical abnormalities that subsequently develop in this model (Figure 2, A to G).
Tau Reduction Prevents ASD-related Neural Changes in Scn1aRX/+ and Cntnap2−/− Mice
Next, we examined whether tau reduction counteracts the ASD-related neural alterations described above. Both complete and partial tau reduction prevented megalencephaly (Figure 4A) and enlargement of the hippocampus and dentate gyrus in Scn1aRX/+ mice (Figure 4, B and C). Tau ablation also prevented megalencephaly in Kcna1−/− mice, a model of epilepsy without autism (Holth et al., 2013). Notably, complete and partial tau reduction prevented overactivation of Akt and S6 in Scn1aRX/+ mice but did not affect the extent of hippocampal Akt and S6 activation in Scn1a+/+ controls (Figure 4, D and E, Figure S4E).
Figure 4 |. Tau Reduction Prevents Megalencephaly and Overactivation of the PI3K/Akt/mTOR Pathway in ASD Model.

Some of the measures described in Figure 2 were compared in male and female Scn1a+/+ and Scn1aRX/+ mice (A–E) and in Cntnap2+/+ and Cntnap2−/− mice (F–H) that had 2, 1, or 0 Mapt alleles. (A) Brain weights of Scn1a+/+ and Scn1aRX/+ mice at 9–10 months of age. (B–C) Volumes of the hippocampus (B) and dentate gyrus (C) of Scn1a+/+ and Scn1aRX/+ mice at 9–10 months. (D–E) Hippocampal pAkt/total Akt (D) and pS6 (Ser235/236)/total S6 (E) ratios of Scn1a+/+ and Scn1aRX/+ mice at P45. Similar results were obtained for pS6 (Ser240/244), as shown in Figure S4E. (F) Brain weights of Cntnap2+/+ and Cntnap2−/− mice at 9–10 months. (G–H) Hippocampal pAkt/total Akt (G) and pS6 (Ser235/236)/total S6 (H) ratios of Cntnap2+/+ and Cntnap2−/− mice at 6–7 months. To combine data from independent experiments, measurements in (D, E, G, H) were normalized to the mean ratios in Scn1a+/+Mapt+/+ (D, E) or Cntnap2+/+Mapt+/+ (F–H) mice (defined as 1.0). #P = 0.062, *P < 0.05, **P < 0.01, ***P < 0.001, ****P < 0.0001 vs. Scn1a+/+Mapt+/+ mice (A–E) or Cntnap2+/+Mapt+/+ mice (F–H), or as indicated by brackets, determined by two-way ANOVA (A–F) or one-way ANOVA (G and H) followed by Holm-Sidak test. Interaction between Scn1a and Mapt genotypes by two-way ANOVA: (A) P = 0.0018, F2, 97 = 6.73; (B) P = 0.16, F2, 27 = 1.95; (C) P = 0.032, F2, 27 = 3.92; (D) P = 0.0011, F2, 30 = 8.59; (E) P = 0.0003, F2, 30 = 10.88; or between Cntnap2 and Mapt genotypes: (F) P = 0.090, F2, 61 = 2.50. n.s., not significant. NT: Cntnap2+/+Mapt+/– mice were not tested in the experiments shown in (G, H). Values are mean ± SEM.
Megalencephaly also developed in Cntnap2−/−Mapt+/+ mice, albeit to a milder degree, and was prevented by complete or partial tau reduction in this model as well (Figure 4F). Cntnap2−/− Mapt+/+ mice also had higher hippocampal levels of pAkt and pS6 than Cntnap2+/+Mapt+/+ controls, an abnormality that was also prevented by complete or partial tau reduction (Figure 4, G and H). Thus, in independent models of ASD, tau is required not only for the development of autism-like behaviors, but also for the development of neural alterations that may cause or contribute to these behaviors. Tau reduction counteracts all of these abnormalities.
PTEN May Mediate Beneficial Tau Reduction Effects
Recent evidence suggests that tau can suppress the activation of phosphatase and tensin homolog deleted on chromosome 10 (PTEN) (Marciniak et al., 2017), a phosphatase that curtails activation of the PI3K/Akt/mTOR pathway by dephosphorylating PIP3 and converting it back to PIP2 (Figure 3 and ref. (Maehama and Dixon, 1998)). PTEN mutations are found in more than 10% of people with ASD and megalencephaly (Butler et al., 2005; Klein et al., 2013; Tilot et al., 2015). In mice, loss-of-function mutations of PTEN cause markedly increased dendritic size, megalencephaly, social and communication deficits, repetitive behaviors, and learning and memory deficits (Kwon et al., 2006; Tilot et al., 2015).
In light of these findings and the results of the current study, we hypothesized that tau affects ASD pathogenesis through its regulatory control of PTEN (Figure 3). In this model, tau constrains a critical negative feedback mechanism that might counteract the aberrant overactivation of the PI3K/Akt/mTOR pathway by diverse ASD-promoting causes. Tau reduction would be expected to strengthen this mechanism by allowing for increased PTEN activity and suppression of the PI3K/Akt/mTOR pathway. To test this model, we looked for evidence of direct interactions between tau and PTEN in cultures of primary neurons. Proximity ligation assays (PLAs) can detect proteins in situ that are ≤40 nm apart and thus likely to interact with each other, either directly or by forming a complex with other proteins. Using a PLA designed to detect interactions between tau and PTEN, we saw a strong signal in primary cortical rat neurons (Figure 5A). Similar results were obtained with primary cortical neurons from Mapt−/− mice after the cell cultures were transduced with a lentiviral vector expressing GFP and WT 0N4R mouse tau (Figure 5B), the most abundant tau isoform in mature neurons of WT mouse brains (Liu and Götz, 2013). No signal was seen in Mapt−/− neurons transduced with a control vector expressing GFP alone (Figure 5B). These results suggest that tau interacts with PTEN in primary neurons and are consistent with a previous study in which PTEN and tau were co-immunoprecipitated from mouse brain tissue (Marciniak et al., 2017). In contrast, tau does not appear to interact with PI3K or Akt (Liu and Götz, 2013; Marciniak et al., 2017).
Figure 5 |. Tau Interacts with PTEN through Tau’s PRD and Restrains PTEN’s Lipid Phosphatase Activity.

(A–B) Colocalization of tau and PTEN in primary cortical neurons analyzed by PLA. (A) WT rat neurons (DIV 10) were labeled with the tau antibody Tau5 (top), a PTEN antibody (middle), or both (bottom). The PLA signal (red) indicates close proximity of the antigens. Neurons were counterstained with DAPI (blue) and an antibody to MAP2 (green). Scale bar: 30 μm. (B) Mapt−/− mouse neurons were transduced on DIV 7 with lentiviral vectors encoding GFP alone (top) or GFP and 0N4R mouse tau (bottom), labeled with antibodies against tau (Tau5) and PTEN, and subjected to PLA on DIV 10. Scale bar: 50 μm. Some of the PLA signals in (A) and (B) appear to reside outside of cells because of weak MAP2 or GFP staining of the fine neuritic processes with which they are associated. (C) Lipid phosphatase activity of PTEN measured under cell-free conditions in the presence of different recombinant human tau species. Albumin was used as the negative control (Control). n = 3 independent experiments, each including two to three replicates per condition. To combine data from independent experiments, measurements in (C) were normalized to the mean PIP2 concentration at 1 ng/μl PTEN with albumin (defined as 1.0). (D–H) Analysis of interactions between hTau and hPTEN in transiently transfected HEK-293 cells. (D) Schematic of WT 1N4R hTau and deletion mutants lacking the indicated domains. Numbers indicate amino acid positions in 1N4R hTau and those in parentheses in 2N4R hTau. (E) Western blot analysis of immunoprecipitates (left) and column flow through (right) from cells expressing GFP-P2A alone (Ctr) or the constructs in (D), after immunoprecipitation of cell lysates with an antibody against PTEN. Blots were probed with antibodies to tau (Tau46 plus Tau5) and PTEN. Similar results were obtained in two additional experiments (not shown). (F and G) BiFC assay of HEK-293 cells expressing the constructs indicated at the top in (F) and shown in (G). WT human PTEN (hPTEN: PBD, PIP2 binding domain; PTP, protein tyrosine phosphatase domain; CT, C-tail domain) was tagged with VN, and WT 2N4R hTau and its mutants were tagged with VC. Numbers indicate amino acid positions in hPTEN and 2N4R hTau. hPTEN and VC were detected by immunocytochemistry (ICC). Interactions between VN-hPTEN and hTau-VC were detected by Venus fluorescence resulting from close proximity between VN and VC. Scale bar: 40 μm. (H) Quantitation of BiFC-Venus signals normalized to VC immunoreactivity. n = 3 independent experiments, each including two to three coverslips/condition. *P < 0.05, **P < 0.01, ***P < 0.001, ****P < 0.0001 vs. PTEN concentration-matched control (C) or VC alone (H), determined by multiple Welch’s t tests (C) or one-way ANOVA with Holm-Sidak test (H). n.s., not significant. Values are means ± SEM.
To assess how tau affects PTEN activity, we measured PTEN phosphatase activity in cell- free conditions using a PIP2 ELISA in the presence or absence of distinct tau species. Different isoforms of soluble recombinant WT human tau (0N3R, 0N4R, 1N4R, and 2N4R) each suppressed the lipid phosphatase activity of recombinant PTEN, reducing the dephosphorylation-mediated conversion of PIP3 to PIP2 (Figure 5C). Different isoforms of tau inhibited PTEN activity to a similar extent (Figure 5C). In a cell-free PIP3 ELISA, tau did not affect the activity of PI3K itself (Figure S5A), consistent with the lack of direct interactions between tau and PI3K reported previously (Marciniak et al., 2017). In the same assay, LY294002, a specific PI3K antagonist, inhibited PI3K kinase activity in a dose-dependent manner (Figure S5B). These data suggest that tau and tau reduction regulate the PI3K signaling pathway indirectly by modulating the activity of PTEN.
Next, we determined which of the four major tau domains—N-terminus (NT), proline-rich domain (PRD), microtubule-binding domain (MTB), and C-terminus (CT)—mediates the interaction with PTEN. We constructed deletion mutants of 1N4R human tau lacking any one of these domains (Figure 5D), transfected each into HEK-293 cells, which endogenously express PTEN but not tau (Figure 5E and refs. (Davidson et al., 2010) and (Ren et al., 2007)), and compared the amount of tau that co-immunoprecipitated with PTEN from cell lysates (Figure 5E). Only deletion of the PRD markedly reduced binding of tau to PTEN (Figure 5E), suggesting that this domain is necessary for the tau–PTEN interaction.
To further test this hypothesis, we analyzed tau-PTEN interactions in a bimolecular fluorescence complementation (BiFC) assay (Marciniak et al., 2017). For this assay, we tagged WT human PTEN N-terminally with an N-terminal fragment of Venus (VN-hPTEN) and WT 2N4R human tau C-terminally with a smaller, complementary C-terminal fragment of Venus (hTau-VC). A much stronger cytoplasmic BiFC-Venus signal was detected in VN-hPTEN- expressing HEK-293 cells that were co-transfected with WT hTau-VC than with VC alone (Figure 5, F to H), presumably because the interaction between PTEN and tau enhanced the interaction between VN and VC. We then generated VC-tagged deletion mutants of 2N4R human tau (Figure 5G) and evaluated their ability to interact with VN-hPTEN in the BiFC assay. Tau constructs containing the PRD, either by itself (hTau-PRD-VC) or in combination with another domain (hTau-NT/PRD-VC) interacted strongly with PTEN, whereas tau constructs lacking the PRD (hTau-MTB/CT-VC and hTau-NT-VC) did not (Figure 5, F and H). Thus, the PRD of tau is both necessary and sufficient for tau to interact with PTEN.
If PTEN is a critical mediator of the tau reduction effects on the PI3K/Akt/mTOR pathway, tau reduction should no longer be able to counteract the overactivation of this pathway when PTEN expression is reduced. To test this hypothesis, we used anti-PTEN siRNAs to knock down PTEN in primary neuronal cultures from Mapt+/+ and Map−/− mice. Among four anti-PTEN small interfering RNAs (siRNAs) tested, siRNAs #1 and #2 effectively reduced PTEN protein levels in Mapt+/+ and Mapt−/− neurons (Figure 6A and Figure S6, A–C). Treatment of cultures with these siRNAs caused comparable increases in pAkt levels in Mapt+/+ and Mapt−/− neurons (Figure 6B and Figure S6D). To overactivate the PI3K/Akt/mTOR pathway, we treated cultures with brain-derived neurotrophic factor (BDNF) (Kowiański et al., 2018; Sutton and Chandler, 2002) or insulin (Marciniak et al., 2017; Zheng and Quirion, 2004). BDNF robustly increased pAkt levels in Mapt+/+ neurons (Figure 6C). Consistent with the effects of tau reduction in vivo, the BDNF-induced increase in pAkt levels was significantly lower in Mapt−/− neurons (Figure 6C). However, after PTEN knockdown with siRNA #1 or #2, BDNF triggered comparable increases in pAkt levels in Mapt+/+ and Mapt−/− neurons (Figure 6D). Tau ablation also reduced insulin-induced increases in pAkt in neurons with wildtype PTEN levels (Figure 6E), but not in neurons in which PTEN had been knocked down (Figure 6F). These results indicate that PTEN is required for tau reduction to prevent overactivation of PI3K signaling.
Figure 6 |. PTEN Is Required for Tau Reduction Effects on PI3K Signaling.
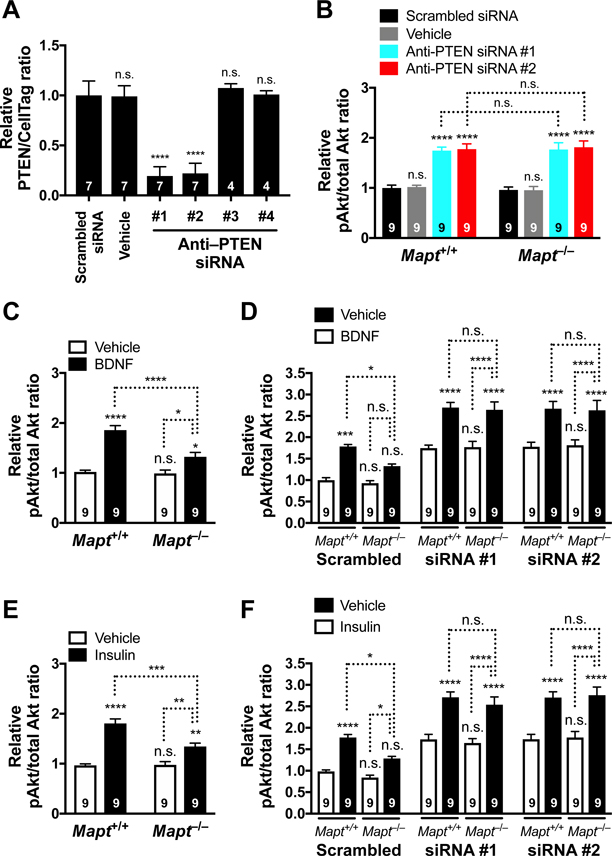
(A) Relative PTEN levels in cultures of primary Mapt+/+ mouse neurons treated on DIV 7 with scrambled siRNA, vehicle (1x siRNA buffer, 1:100), or anti-PTEN siRNAs #1 to #4. PTEN protein levels were determined on DIV 11 by In-Cell Western assay. Normalization to CellTag 700 was used to control for well-to-well variation in cell numbers. Representative PTEN and CellTag 700 signals are shown in Supplemental Figure 6A–B. (B) Relative pAkt levels in Mapt+/+ and Mapt−/− neurons treated on DIV 7 with scrambled siRNA, vehicle (1x siRNA buffer, 1:100), or anti-PTEN siRNAs #1 or #2. Relative pAkt/total Akt signal ratios were determined on DIV 11. Representative pAkt and total Akt signals are shown in Supplemental Figure 6D. (C) Relative pAkt levels in Mapt+/+ and Mapt−/− neurons that were treated with BDNF (100 ng/mL) or vehicle (water, 1:100) for 10 min on DIV 11. (D) Relative pAkt levels in Mapt+/+ and Mapt−/− neurons that were treated on DIV 7 with scrambled siRNA or with anti-PTEN siRNAs #1 or #2, and on DIV 11 with BDNF or vehicle (water, 1:100) as in (C). (E) Relative pAkt levels in Mapt+/+ and Mapt−/− neurons that were treated with insulin (5 μg/mL) or vehicle (water, 1:100) for 10 min on DIV 11. (F) Relative pAkt levels in Mapt+/+ and Mapt−/− neurons that were treated on DIV 7 with scrambled siRNA or with anti-PTEN siRNAs #1 or #2, and on DIV 11 with insulin or vehicle (water, 1:100) as in (E). In (A–F), measurements were normalized to the mean of Mapt+/+ samples treated with the scrambled siRNA on the same 96-well plate (defined as 1.0). Numbers in bars indicate biological replicates (independent cultures from individual mouse pups). *P < 0.05, **P < 0.01, ***P < 0.001, ****P < 0.0001 vs. the leftmost bar (A, C, E), genotype-matched neurons treated with scrambled siRNA (B), the leftmost bar in each siRNA block (D, F), or as indicated by brackets, determined by one-way ANOVA with Holm-Sidak test (A) or two-way ANOVA with Holm-Sidak test (B–F). By two- way ANOVA, interactions between genotype and siRNA (B): P = 0.94, F3, 64 = 0.14; genotype and treatment (C): P = 0.0019, F1, 32 = 11.44; siRNA and treatment (D): P = 0.29, F6, 96 = 1.24; genotype and treatment (E): P = 0.0013, F1, 32 = 12.52; and siRNA and treatment (F): P = 0.090, F6, 96 = 1.89. n.s., not significant. Values are means ± SEM.
Tau Reduction Is Not Beneficial in Shank3B−/− Mice
To begin to assess how critically the beneficial effects of tau reduction in ASD models depend on modulation of PTEN and the PI3K/Akt/mTOR pathway, we identified an ASD model in which this pathway does not appear to be altered, Shank3B−/− mice. SHANK3 is one of several genes deleted in Phelan-McDermid syndrome, which is associated with autism (Durand et al., 2007; Wilson et al., 2003), and numerous mutations in SHANK3 have been identified in ASD patients without this syndrome, including de novo frameshift, truncation, and missense mutations (Durand et al., 2007; Monteiro and Feng, 2017). We analyzed Shank3B−/− mice in which the PDZ domain (exons 13–16) of Shank3 was targeted, eliminating most Shank3 isoforms (Monteiro and Feng, 2017; Peça et al., 2011). Although Shank3B−/− mice develop prominent autism-like behaviors (Monteiro and Feng, 2017; Peça et al., 2011), we did not observe an overactiviation of Akt or S6 in their brains, as compared to WT controls (Figure 7, A and B). ShankΔC/ΔC mice also did not have overactivation of Akt and, in fact, were reported to show a trend toward reduced pAkt levels (Bidinosti et al., 2016). In further contrast to the Scn1aRX/+ and Cntnap2−/− models, Shank3B−/− mice had no epileptic activity (Figure 7C) and no megalencephaly (Figure 7D).
Figure 7 |. Tau Reduction Does Not Prevent Autism-like Behaviors in Shank3B−/− Mice that Lack Epileptic Activity, Megalencephaly, and Overactivation of Akt and S6.

(A–D) WT and Shank3B−/− mice on the Mapt+/+ background were compared at different ages. (A–B) Relative hippocampal pAkt/total Akt (A) and pS6 (Ser235/236)/total S6 (B) signal ratios determined by western blot analysis. Average measurements from WT samples on the same gel were defined as 1.0. (C) Epileptic spike numbers obtained by EEG recordings in resting mice. (D) Brain weights. (E–I) Male Shank3B+/+ and Shank3B−/− mice with 2, 1, or 0 Mapt alleles were assessed for autism- like behaviors at 8–11 months of age. (E) Self-grooming behavior measured as in Figure 1A. (F) Relearning test carried out as in Figure 1B. (G) Social interaction test. Time spent in the chamber with an enclosure containing a live mouse or the chamber with an empty enclosure was recorded for 10 minutes. Interaction between age and time by two-way ANOVA: P = 0.337, F5, 73 = 1.16. (H–I) Olfactory habituation/dishabituation test carried out as in Figure 1D–E. All groups of mice displayed similar habituation to water and vanilla; for habituation to social odor, Shank3B−/−Mapt+/+ mice differed from Shank3B+/+Mapt+/+ (P < 0.0001) and Shank3B+/+Mapt−/− (P < 0.0001) mice. All groups of mice displayed similar dishabituation from water to vanilla; for dishabituation from vanilla to social odor, Shank3B−/−Mapt+/+ mice differed from Shank3B+/+Mapt+/+ (P < 0.0001) and Shank3B+/+Mapt−/− (P < 0.0001) mice. Numbers in bars indicate numbers of mice per group. §P = 0.12, #P = 0.062, *P < 0.05, **P < 0.01, ***P < 0.001, ****P < 0.0001 vs. age-matched Shank3B+/+Mapt+/+ (WT) mice, or as indicated by brackets, determined by two-way ANOVA with Holm-Sidak test (A, B, D), Kruskal-Wallis test with Dunn test (C), multiple Welch’s t tests with Holm-Sidak test (E), one-way ANOVA with Holm-Sidak test (F, I), two-tailed paired t tests with Holm-Sidak correction (G), or GEE framework with Holm-Sidak test (H). By two- way ANOVA, interaction between age and pAkt (A): P = 0.60, F2, 26 = 0.51; between age and pS6 (B): P = 0.65, F2, 26 = 0.44; between age and brain weight (D): P = 0.55, F2, 95 = 0.61. n.s., not significant. NT: Shank3B+/+Mapt+/− mice were not tested in the experiments shown in (F, I). Values are means ± SEM.
Next, we crossed Shank3B−/− mice and Shank3B+/+ controls onto the Mapt+/+, Mapt+/−, and Mapt−/− backgrounds. The offspring did not differ in pAkt or pS6 activation, or in brain weight (Figure S7, A–C). However, at 8–11 months of age, Shank3B−/−Mapt+/+ mice displayed excessive, repetitive self-grooming (Figure 7E) and were impaired in relearning the water T-maze task (Figure 7F), although they had no difficulties learning the initial location of the target platform (Figure S7D). Neither abnormality was prevented by complete or partial tau reduction (Figure 7, E and F). Furthermore, Shank3B+/+ mice of all Mapt genotypes displayed normal social preference, whereas Shank3B−/−Mapt+/+ mice did not (Figure 7G). Partial or complete reduction of tau failed to prevent this deficit in Shank3B−/− mice, although there was a trend in that direction (Figure 7G). Using the more rigorous but less sensitive approach to the statistical analysis of the social preference test recommended by (Nygaard et al., 2019), Shank3B−/− mice of all Mapt genotypes did not differ significantly from WT controls in this test (data not shown).
Shank3B−/− and Shank3B+/+ mice on different Mapt backgrounds could detect nonsocial odors (Figure 7H). In contrast, Shank3B−/− mice showed much less responsiveness to a social odor than Shank3B+/+ mice on the Mapt+/+ background (Figures 7H and 7I). Partial or complete reduction of tau failed to prevent this deficit (Figures 7H and 7I). Tau reduction also failed to prevent the deficits of Shank3B−/− mice in the elevated plus maze and open-field tests (Figure S7, E and F).
The behavioral test results in the Scn1aRX/+, Cntnap2−/−, and Shank3−/− models are summarized in Table S1. Together, these results highlight the pathophysiological differences among different types of ASDs and suggest that tau reduction is beneficial primarily in ASDs whose pathogenesis involves overactivation of the PI3K/Akt/mTOR pathway.
DISCUSSION
This study shows that the development of ASD-relevant behavioral, anatomical and biochemical abnormalities in two mouse models that simulate distinct causes of ASD critically depends on tau levels, requiring >50% of physiological tau levels found in WT mice. Our study also shows that a 50% reduction in tau levels is sufficient to prevent diverse ASD-like abnormalities in these models. We are unaware of any evidence that partial reduction of tau negatively affects longevity or behavior. Indeed, even complete ablation of tau had no significant effects on most of the outcome measures assessed here in mice without ASD-causing mutations, consistent with previous reports of no or minimal functional deficits in Mapt−/− mice (Gheyara et al., 2014; Li et al., 2014; Morris et al., 2013; Morris et al., 2011; Roberson et al., 2011).
Advances in genetic screening during pregnancy may enable early interventions to prevent certain types of ASD in the future, and a clinical trial of a tau-lowering antisense oligonucleotide is under way in patients with early Alzheimer’s disease (NCT03186989). However, additional studies are needed to fully explore the therapeutic potential and safety of tau reduction in neurodevelopmental disorders.
The molecular changes that have been genetically linked to ASDs are remarkably diverse, ranging from voltage-gated ion channels (e.g., NaV1.1) to synaptic scaffolds (Cntnap2 and Shank3) and protein modifiers and regulators (Fmr1 and PTEN) (Geschwind and State, 2015; Mullins et al., 2016; Willsey and State, 2015; Won et al., 2013). How can such diverse triggers cause similar behavioral phenotypes? One possibility is that the molecular, cellular, or network cascades they activate converge on shared or overlapping mechanisms (Mullins et al., 2016). We hypothesize that tau and tau reduction affect such a critical pathogenic node. Although genetic alterations in MAPT have not yet been linked to ASDs (Rovelet-Lecrux and Campion, 2012), lack of such linkage does not exclude an important role for tau in the pathogenesis of some of these conditions.
Under physiological circumstances, tau expression begins during embryogenesis (e.g., approximately embryonic day 11.5 [E11.5] in mice and E13 in rats), increases until early postnatal stages and then remains rather stable throughout life (Allen Institute for Brain Science2019; Brion et al., 1993; Bullmann et al., 2009; Drubin et al., 1984; Kosik et al., 1989; Liu and Götz, 2013; McMillan et al., 2008). How might tau enable the development of ASD-like abnormalities and does it have to acquire an adverse gain of function to do so? So far, we have found no evidence of an abnormal tau species or assembly in the ASD models we analyzed (data not shown). However, the current study was not designed to rigorously exclude the existence of such a moiety, which may be of low overall abundance or sequestered into specific subcellular compartments and thus difficult to detect. Our findings support the hypothesis that tau enables the development of some ASDs by curtailing the activity of PTEN, a physiological function that—under pathological conditions— may allow ASD-promoting factors to overactivate the PI3K/Akt/mTOR pathway (Figure 3). Notably, this pathway has been implicated in diverse ASDs (Ebert and Greenberg, 2013; Enriquez-Barreto and Morales, 2016; Yeung et al., 2017), some or all of which may be counteracted by tau reduction. In a similar vein, pharmacological inhibitors of the PI3K/Akt/mTOR pathway may also be of benefit in the ASDs we analyzed. Indeed, Xing et al. recently reported that rapamycin and an Akt inhibitor reduced social deficits in Cntnap2−/− mice (Xing et al., 2019). However, unlike the tau reduction strategy used in the current study, rapamycin and the Akt inhibitor failed to reduce repetitive behaviors (Xing et al., 2019), possibly because the drug treatment was not initiated until 4–8 weeks after birth and the pathophysiological mechanisms underlying repetitive behaviors could no longer be blocked at this stage. Because the etiology of ASDs is so heterogeneous (Lord et al., 2000; Mullins et al., 2016; Willsey and State, 2015; Won et al., 2013), several of these conditions may not be mediated by PI3K overactivation and—if our mechanistic interpretation is correct—consequently could not be prevented or mitigated by modulation of the pathogenic cascade depicted in Figure 3. This working model also predicts that tau reduction would not be able to counteract ASD-like abnormalities caused by hypofunction or deletion of PTEN. This hypothesis is supported by our PTEN knockdown results and could be further tested in vivo through the analysis of conditional Pten knockout mice (Kwon et al., 2006; Zhou et al., 2009).
Because tau has been implicated in diverse processes (Morris et al., 2011; Sotiropoulos et al., 2017; Wang and Mandelkow, 2016), downregulation of the PI3K/Akt/mTOR pathway may not be the only mechanism by which tau reduction counteracts the development of ASDs. Indeed, complete ablation of tau tended to reduce deficits of Shank3B−/− mice in the social preference and olfactory exploration tests, although these effects did not reach statistical significance. It is tempting to speculate that downregulation of PI3K/Akt/mTOR signaling may contribute to some of the beneficial effects that tau reduction has in models of other neurological and psychiatric conditions, including epilepsy without autism, traumatic brain injury, stroke, depression, and neurodegenerative disorders (Bi et al., 2017; Cheng et al., 2014; Crino, 2016; Dioli et al., 2017; Morris et al., 2011; Roberson et al., 2011).
Like 30% of people with ASDs, Scn1aRX/+ and Cntnap2−/− mice combine autism-like behaviors with epilepsy (Ito et al., 2013; Ogiwara et al., 2007; Penagarikano et al., 2011). Furthermore, overactivation of the PI3K/Akt/mTOR pathway has been documented in multiple genetic (Meikle et al., 2008; Zeng et al., 2011; Zeng et al., 2008) and chemically-induced (Buckmaster et al., 2009; Huang et al., 2010; Zeng et al., 2009; Zhang and Wong, 2012) epilepsy models. Because tau reduction counteracts the development of epilepsy of diverse causes (Bi et al., 2017; Devos et al., 2013; Dioli et al., 2017; Gheyara et al., 2014; Holth et al., 2013; Li et al., 2014; Roberson et al., 2011), including the epilepsy in Scn1aRX/+ and Cntnap2−/− mice (this study and (Gheyara et al., 2014)), tau reduction might reduce PI3K activation in these models also by suppressing neural network dysfunction (Figure 3). To our knowledge, tau reduction is the first intervention that suppresses both autism-like behaviors and epileptic activity in ASD models. Our finding that tau reduction failed to prevent autism-like behaviors in Shank3B−/− mice, which do not have epilepsy, raises the possibility that the beneficial effects of tau reduction are restricted to ASD models with epilepsy. The extent to which the epileptic activity in these models, and in ASD patients with epilepsy, contributes to the development of autism-like behaviors and associated anatomical alterations such as megalencephaly is uncertain and merits further investigation.
Although therapeutic strategies for different types of ASDs will likely have to be tailored to address the predominant pathomechanism (Geschwind and State, 2015; Willsey and State, 2015), it is desirable to identify pathogenic convergence points whose therapeutic modulation could be of benefit in several of these conditions (Mullins et al., 2016). Overactivation of the PI3K/Akt/mTOR pathway and its suppression by release of PTEN activity through tau reduction may be promising examples.
STAR METHODS
LEAD CONTACT AND MATERIALS AVAILABILITY
Further information and requests for resources and reagents should be directed to and will be fulfilled by the Lead Contact, Lennart Mucke (lennart.mucke@gladstone.ucsf.edu). All unique/stable reagents generated in this study are available from the Lead Contact without restriction.
EXPERIMENTAL MODEL AND SUBJECT DETAILS
Mouse models
Scn1aRX/+ mice generated by Dr. K. Yamakawa (Laboratory for Neurogenetics, RIKEN Brain Science Institute) (Ogiwara et al., 2007) were from Dr. M. H. Meisler (Department of Human Genetics, University of Michigan) on a mixed C3HeB/FeJ × C57BL/6J background (N2 onto C3HeB/FeJ) and crossed onto the C57BL/6J background for 9–11 generations. Cntnap2−/− mice generated by Dr. E. Peles (The Weizmann Institute of Science) (Poliak et al., 2003) and crossed from the original ICR outbred strain onto the C57BL/6J background (Penagarikano et al., 2011) were from Dr. J. Rubenstein (Department of Psychiatry, University of California, San Francisco). Shank3B−/− mice generated by Dr. G. Feng (Massachusetts Institute of Technology) (Peça et al., 2011) were obtained from the Jackson Laboratory on the C57BL/6J background (Stock No: 017688). All three lines were crossed with Mapt−/− mice on a C57BL/6J background (Dawson et al., 2001) (Jackson Laboratory, Stock No: 007251) to generate the genotypes described in the text. Breeding strategies were adjusted to address differences in breeding efficiency across models. For the Scn1aRX/+ model, we first bred male Scn1aRX/+ and female Mapt−/− mice to generate Scn1aRX/+Mapt+/− and Scn1a+/+Mapt+/− mice. Experimental mice were generated by breeding male Scn1aRX/+Mapt+/– and female Scn1a+/+Mapt+/− mice. For the Cntnap2−/− model, we first bred male Cntnap2−/− and female Mapt−/− mice to generate Cntnap2+/–Mapt+/– mice. We then bred male and female Cntnap2+/−Mapt+/− mice to generate Cntnap2+/+Mapt+/− and Cntnap2−/− Mapt+/− mice, male and female Cntnap2+/+Mapt+/− mice to generate Cntnap2+/+Mapt+/+, Cntnap2+/+Mapt+/− and Cntnap2+/+Mapt−/− mice, and male and female Cntnap2−/−Mapt+/– mice to generate Cntnap2−/−Mapt+/+, Cntnap2−/−Mapt+/− and Cntnap2−/−Mapt−/− mice. For the Shank3B−/− model, we used a breeding strategy similar to that used for the Cntnap2−/− model. Across genotypes, not all mice that were compared in individual experiments had the same parents and were raised by the same dam at the same time (littermates). For most behavioral tests, we used only male mice to reduce variability in behavioral performance and because pilot tests revealed stronger phenotypes in male mice. Ultrasonic vocalization was assessed in male and female P5 pups. Sex-balanced groups of male and female mice were used for other experiments. Mice were housed two to five per cage in the Gladstone animal facility and treated in accordance with guidelines of the Institutional Animal Care and Use Committee of the University of California, San Francisco. For assessment in the water T-maze and nest building test, mice were singly housed throughout the experiment. All mice were maintained on a 12-hour light/12-hour dark cycle with free access to food and water. Experiments were done during the light cycle.
Primary cultures
The experiments were done as described (Miyamoto et al., 2017; Vossel et al., 2015) with minor modifications. For primary neuronal cultures, cortices and hippocampi of Sprague Dawley rats (Charles River) were dissected on embryonic day 18 (E18) in cold Dulbecco’s phosphate-buffered saline (DPBS, Gibco, 14190144) containing HEPES and 0.9% glucose. The tissues were digested with papain (Worthington, LK003178) for 15 minutes at 37° C. Low-ovomucoid solution containing 0.15% bovine serum albumin (Sigma-Aldrich, A8806), 0.15% trypsin inhibitor (Gibco, R007100) in DPBS, and deoxyribonuclease I (Sigma-Aldrich, D4513) was added to stop the digestion. After 5 minutes, the cells were suspended in fresh low-ovomucoid solution and triturated in a fire-polished Pasteur pipette. Debris was removed with a 70-μm nylon strainer, and the cells were spun at 1000 rpm for 5 minutes. Cell pellets were then resuspended in warm Neurobasal A medium (Gibco, 12349015) containing 2% B27 (Gibco, 17504044), 0.5 mM GlutaMAX (Gibco, 35050061), and penicillin/streptomycin (Gibco, 15140122). Mouse primary neuronal cultures were generated similarly, except that cortices and hippocampi were from newborn Mapt+/+ or Mapt−/− pups (P0–P1), dissected in ice-cold Earle’s balanced salt solution lacking CaCl2, MgSO4, and phenol red (Gibco, 14155–063), and digested with papain (Worthington, LK003178) in the same solution at 37° C for 15 minutes. Rat and mouse cells were plated on poly-D-lysine–coated coverslips (Corning, 354087) in 24-well plates at a density of 250,000 neurons/well and grown in 5% CO2 in a humidified incubator at 37° C. Half the medium was replaced weekly. Neuronal cultures from Mapt−/− mice were transduced with lentiviral vectors encoding GFP-P2A or GFP-P2A-mTau on day 7 in vitro (DIV 7) (Miyamoto et al., 2017). Rat and mouse neurons were used for PLA on DIV 10.
HEK-293 cell cultures
HEK-293 cells (HEK293T/17 cells, CRL-11268, ATCC) were grown in 100 × 20-mm Corning cell culture dishes in Dulbecco’s modified Eagle’s medium (DMEM, Gibco, 11960–069) supplemented with 10% fetal bovine serum (VWR, 97068–085), 0.5 mM GlutaMAX (Gibco, 35050061), and penicillin/streptomycin (Gibco, 15140122) in 5% CO2 in a humidified incubator at 37° C. At 70–90% confluence (2–3 times/week), ce lls were split at ratios of 1:3 to 1:5 onto new culture dishes.
METHOD DETAILS
General
Mice with obvious health problems such as skin lesions, eye injuries, tumors, slowed movements, or inability to swim were excluded from behavioral testing and analysis. No other data was excluded. Sample sizes were determined on the basis of preliminary data and previous studies (Gheyara et al., 2014). Experimenters were blinded to genotypes of mice for Nissl stain and immunohistochemistry experiments. Experimenters who obtained the microscopic images for immunochemistry, Nissl staining, proximity ligation assay (PLA), or bimolecular fluorescence complementation (BiFC) were blinded to genotype and transfection conditions. For all behavioral assays, experimenters were blinded to the genotype of mice, and the testing order of mice was randomized. For experiments involving singly housed mice (nesting and water T-maze assays), the testing order of cages was randomized. For experiments involving group-housed mice, mice in individual cages were randomly marked and the testing order of cages was randomized. For tests that required multiple days of testing (e.g., water T-maze test), the same randomized order was maintained over all days. All experiments were reliably reproduced: behavioral experiments were replicated in at least two independent cohorts of mice; co-immunoprecipitation, cell-free PTEN ELISA, PLA, and BiFC assays were replicated in at least three independent experiments; western blot, immunohistochemistry, Nissl stain, and brain weight measures were obtained from at least four mice in each group.
Behavioral experiments
General
Before behavioral testing, mice were transferred to the testing room and acclimated for at least 1 hour. All work surfaces were cleaned with Vimoba (100 ppm chlorine dioxide solution made from MB-10 Tablets, Quip Laboratories) before and after testing every day and with 70% alcohol between testing of different mice. Most Scn1a+/+ and Scn1aRX/+ mice of different Mapt genotypes were tested in the following sequence: social preference test, water T-maze test, repetitive self- grooming test, olfactory habituation/dishabituation test, reciprocal social interaction test, open field test, and nest building test. Because of how this project evolved and logistical constraints such as availability of testing equipment, some Scn1a+/+ and Scn1aRX/+ mice of different Mapt genotypes were not tested in the social preference test and the water T-maze test but in all other tests. Cntnap2+/+, Cntnap2−/−, Shank3B+/+ and Shank3B−/− mice of different Mapt genotypes were all tested in the following sequence: repetitive self-grooming test, elevated plus maze test, open-field test, social preference test, nest building test, water T-maze test, olfactory habituation/dishabituation test, and reciprocal social interaction test.
Repetitive self-grooming behavior
For habituation, mice were placed individually into a clean cage (25 cm × 18 cm × 16 cm) without bedding for 20 minutes. The entire session was videotaped and hand-scored for the total amount of time spent grooming during the last 10 minutes.
Water T-maze test
Th test was done as described (Guariglia and Chadman, 2013) with minor modifications. Each arm of the T-maze was 31 cm long, 10 cm wide, and 17 cm tall. The T-maze was placed in a circular base (diameter 77 cm) and filled with water (23 ± 1° C, made opaque with white Crayola Paint) to cover the hidden platform by 1 cm. Mice were singly housed and habituated to the testing room 2 days before the experiment. They remained singly housed on a Metro rack behind a curtain in the testing room throughout the experiment (14 days). Testing was done under red light to encourage egocentric over allocentric learning strategies. Room lights were turned back to daylight conditions between sessions. On days 1–4 (initial learning), mice were placed in the start arm of the T-maze and required to locate a hidden escape platform at the end of the right or left arm of the maze. Each day, mice were trained in one morning and one afternoon session, each with 2 trials. All trials were recorded/tracked with an EthoVision XT (Noldus). On days 5–8 (reversal learning), mice were placed in the start arm of the water T- maze and required to find a hidden escape platform placed at the end of the arm opposite to the one that contained the platform during their initial response training. Each day, mice were trained in one morning and one afternoon session, each with 3 trials. For both initial and reversal learning, the intertrial interval was 15 minutes and the intersession interval was 3 hours. The maximum length of each trial was 60 seconds. If a mouse found the platform within 60 seconds, it was allowed to remain there for 10 seconds. If it failed to find the platform within 60 seconds, it was guided to it and allowed to remain there for 10 seconds. In both the initial learning and the reversal learning, the criterion for learning was consistently reaching the platform within 60 seconds in all trials during three consecutive sessions.
Reciprocal social interaction test
The test was done as described (Han et al., 2012) with minor modifications. For habituation, mice were placed individually into clean cages (25 cm × 18 cm × 16 cm) without bedding for 10 minutes. Pairs of genotype-, age-, and sex-matched mice that had never interacted before were then placed together into a novel home cage without bedding for 10 minutes. Their behavior was videotaped from a top-down angle, and their interactions were analyzed offline with the TopScan tracking system (CleverSys).
Social preference test
The test was done as described (Maeda et al., 2016) with minor modifications. The apparatus consisted of a polycarbonate box (60 × 40 × 22 cm) partitioned into a 15 × 40-cm middle chamber and two 23 × 40-cm side chambers (for Figures 2D, S1B and S1C) or into two 30 × 40- cm side chambers (for Figure 7G). A transparent plastic enclosure (10.5 × 10.5 × 25.2 cm) with two rows of breathing holes was placed in each side chamber. WT mice matching experimental mice in sex, age, and genotype were used as stimulus mice. Each stimulus mouse was habituated to the “social” enclosure in one of the side chambers for three 10-minute sessions or two 15-minute sessions on the day before the test. For an initial habituation trial, each mouse to be tested was placed in the middle of the apparatus and allowed to explore all chambers for 10 minutes in the absence of a stimulus mouse. For the social preference trial, a stimulus mouse was placed in the social enclosure, and mice to be tested were placed individually into the middle of the apparatus and allowed to explore all chambers, including the social and nonsocial (empty) enclosures, for 10 minutes. The test was done under dim light. Movements were videotaped, and the social interactions were analyzed offline with the TopScan tracking system (CleverSys). The time mice spent in each side chamber and within 1.5 cm of the enclosure (interaction zone) were recorded.
Olfactory habituation/dishabituation test
The test was done as described (Han et al., 2012) with minor modifications. For habituation, mice were placed individually into clean cages (25 cm × 18 cm × 16 cm) without bedding for 30 minutes. They were then presented with cotton-tipped applicators that had been dipped or rubbed in water, vanilla (Spice Islands, 403911), or mouse bedding (social odor). Applicators were inserted individually through the middle of the flat wire cage top and secured with a piece of tape, so that their cotton tips were roughly 2 inches above the cage floor. Vanilla was diluted 1:100 in mineral oil and kept in separate glass vials in a separate room. Social odors were prepared by swiping cotton tip applicators across the cage bottom of an unfamiliar mouse of the same strain and sex in a zigzag fashion several times; bedding was removed from the cotton tip. All sessions were carried out inside a biosafety cabinet or laminar flow hood. Odors were presented in the following sequence: (1) water, (2) vanilla, and (3) social. Sessions were separated by 1-minute intervals. Each session consisted of three exposures to the same odor (2 min each) without intertrial intervals. Sniffing bouts were counted and the time mice spent sniffing the applicator was measured with a stopwatch. Sniffing was scored when the mouse was facing the cotton tip with its nose within 2 cm of it. Chewing or climbing on the applicator was not counted as sniffing. The whole procedure was videotaped for confirmatory analysis.
Isolation-induced ultrasonic vocalizations
The test was done as described (Sungur et al., 2016) with minor modifications. Pups at P5 were isolated from their dam and littermates and placed individually at 20–23° C into a clean cage (25 cm × 18 cm × 16 cm) with fresh bedding for 5 minutes. Ultrasonic vocalizations were monitored with an UltraSoundGate Condenser Microphone CM16 (Avisoft Bioacoustics), placed 4 inches above the cage floor and connected by an UltraSoundGate 416 USGH audio device (Avisoft Bioacoustics) to a personal computer. Acoustic data were recorded with an Avisoft-RECORDER and analyzed with Avisoft-SASLab Pro software (Avisoft Bioacoustics). The total number and durations of ultrasonic vocalizations were recorded for subsequent analysis.
Nest building behavior
For assessment of nest building behavior, group-housed mice were transferred individually to new cages. A 5 × 5-cm white compressed cotton pad (Nestlets, Ancare) was placed in the center of the cage, and nest building behavior was assessed 1, 2, 6, and 24 hours later. Composite nest building scores were assigned at each time point as follows: 0, nestlet untouched; 1, <10% of nestlet shredded; 2, 10–50% of nestlet shredded but nest was without shape; 3, 10–50% of nestlet shredded and nest had shape; 4, 50–90% of nestlet shredded but nest was without shape; 5, 50–90% of nestlet shredded and nest had shape; 6, > 90% of nestlet shredded but nest was flat; and 7, > 90% of nestlet as shredded and nest had walls that were at least as tall as the mouse on >50% of its sides.
Open-field test
Spontaneous activity in the open field was measured with an automated Flex Field Open Field Photobeam Activity System (San Diego Instruments). After acclimation to the testing room for 1 hour, mice were tested for 15 minutes in a clear plastic chamber (41 × 41 × 30 cm) equipped with two 16 × 16 photobeam arrays for the detection of horizontal and vertical movements. For context-dependent habituation in the open field, chambers were surrounded by distinct proximal cues. Total movements, rearing in the open field, and time spent in the center and periphery of the open field were recorded automatically for subsequent analysis.
Elevated plus maze test
The maze consisted of two open and two enclosed arms elevated 63 cm above the ground (Kinder Scientific). After acclimation to the testing room for 1 hour, mice were placed at the junction between the open and closed arms of the maze and allowed to explore freely for 10 minutes. Total distance traveled and time spent in the open and closed arms were calculated from breaks of infrared photobeams.
Electroencephalographic (EEG) recordings
Continuous video-EEG recordings were obtained from freely behaving mice for 24 hours as described (Das et al., 2018). Lightweight EEG plugs were constructed in-house by soldering four Teflon-coated silver wire electrodes (0.125 mm diameter) to a multichannel electrical connector. Mice were anesthetized with an intraperitoneal injection of Avertin (250 mg/kg body weight) or with isoflurane delivered with an inhalation anesthesia machine (V-1 Tabletop with Active Scavenging, VetEquip), and EEG electrodes were surgically implanted under the skull and over the left frontal cortex (reference electrode) and the left and right parietal cortices. Mice were allowed to recover from surgery for at least 2 weeks before EEG recordings began. Digital EEG activity and videos of their locomotor activity were recorded with a PowerLab data acquisition system and analyzed with LabChart 7 Pro software (ADInstruments). EEG traces and videos were evaluated by an investigator blinded to the genotype of the mice. Epileptic spikes were detected automatically with a macro written in LabChart 7. Deflections were identified as epileptic spikes if their amplitude was ≥4-fold greater than the average baseline of the trace and the absolute value of the second derivative of the slope (the rate of change of voltage over a period of 5 ms) was ≥104. An investigator verified each spike by inspection. Potentially spurious spikes associated with movements of the recording wire caused by grooming, eating, or digging were excluded from analysis. Spike frequency at rest was measured during the 12-hour light cycle and expressed as number of spikes per hour.
Total brain volume and density measurements
Mice were anesthetized with Avertin and transcardially perfused with saline solution (0.9% NaCl). Brains were removed and weighed on a scale. They were then fully immersed in saline solution (0.9% NaCl) and the displaced volume was measured. Brain volumes and densities were determined with the following formulas, which are based on Archimedes’s method:
where Vbrain is brain volume, Vdisp is the volume of displaced saline, mdisp is the mass of displaced saline, ρsaline is the density of saline, mbrain is brain mass, and ρbrain is brain density.
Nissl stain and volume estimation of hippocampus and dentate gyrus
Mice were anesthetized with Avertin and transcardially perfused with saline solution (0.9% NaCl). Hemibrains were drop-fixed in 4% paraformaldehyde overnight, washed in cold PBS, equilibrated in 30% sucrose for ≥48 hours, and stored at 4° C. Coronal brain section s (30 μm) were obtained at 300-μm intervals with a freezing microtome, stored at −20° C in cyroprotectant medium (30% glycerol and 30% ethylene-glycol in PBS), stained with cresyl violet (Nissl; cell nucleus stain), and used to estimate, as described (Luczynski et al., 2016), the volumes of the dentate gyrus and of the dorsal hippocampal formation, including the hippocampus proper (i.e., cornu ammonis), the dentate gyrus, and the subiculum. The first rostrocaudal appearance of CA3 was chosen as the sample starting point, and the first full ventral extension of CA3 as the end point. For each hemibrain, 5–6 sections 300 μm apart were analyzed. High-resolution (10X) bright field imaging was done with a Zeiss Axio Scan.Z1 slide scanner (Carl Zeiss Microscopy). The Allen Mouse Brain Atlas (Allen Institute) was used as a guide to identify brain structures and draw boundaries. Regions of interest were manually outlined in each section and converted into area values (mm2) with Zeiss ZEN imaging software. The volumes of the hippocampal formation and dentate gyrus were calculated from the area values and the thickness (30 μm) and intervals (300 μm) of sections.
Western blot analysis
Western blot analysis was done as described (Miyamoto et al., 2017) with minor modifications. Proteins were extracted from saline-perfused brain tissues in RIPA buffer (Thermo Fisher Scientific, 89901) containing protease inhibitors (Complete Mini, Roche, 05892791001) and phosphatase inhibitors (PhosSTOP, Roche, 04906837001; phosphatase inhibitor cocktails 2 and 3, Sigma-Aldrich, P5726 and P0044, respectively). Protein was measured by BCA assay (Thermo Fisher Scientific, 23225). Equal amounts of total protein in NuPAGE LDS sample buffer (Thermo Fisher Scientific, NP0007) containing Sample Reducing Agent (Thermo Fisher Scientific, NP009) were loaded into each gel lane. Protein samples were electrophoresed on NuPAGE Novex 4–12% Bis-Tris Midi protein gels (Thermo Fisher Scientific, WG1402BOX) in NuPAGE MOPS SDS running buffer (Thermo Fisher Scientific, NP0001–02) at 200 V for 1 hour at room temperature (RT, 20–23°C). Gels were trans ferred to nitrocellulose membranes with an iBlot 2 gel transfer device (Thermo Fisher Scientific, IB21001). Membranes were blocked with Odyssey blocking buffer (LI-COR Biosciences, 927–50000) for 1 hour at RT and incubated overnight at 4° C with the following primary antibo dies: mouse anti-pan-Akt (1:1000, Cell Signaling, 2920), rabbit anti-phospho-Akt (1:1000, Cell Signaling, 9271), mouse anti-S6 ribosomal protein (1:1000, Cell Signaling, 2317), rabbit anti-phospho-S6 ribosomal protein (1:1000, Cell Signaling, 4858). Membranes were then washed with TBS containing 0.1% Tween20 (TBST) three times for 10 minutes each at RT, incubated with matching secondary antibodies conjugated to IRDye (1:10,000, LI-COR) for 1 hour at RT, and washed in TBST three times for 10 minutes each at RT. Protein bands were visualized with an Odyssey CLx Infrared Imaging System (LI-COR) and quantified with Image Studio software (LI-COR).
Li-COR In-Cell Western blot
Primary neurons were cultured on poly-D-lysine–coated 96-well plates (Corning, 356640) at a density of 20,000 neurons/well and grown in 5% CO2 in a humidified incubator at 37° C. On DIV 7, half the medium was replaced, and anti-PTEN siRNAs (#1, A-040700–13; #2, A-040700-14; #3, A-040700-15 or #4, A-040700-16; Dharmacon; each at a concentration of 1 μM), vehicle (1x siRNA buffer, Dharmacon, B-002000-UB-100, 1:100) or scrambled siRNA (D-001910-04, Dharmacon, 1 μM) were added. On DIV 11, the cultures were washed twice with HEPES buffer (140 mM NaCl, 5.4 mM KCl, 1.8 mM CaCl2, 100 mM glycine, 15 mM glucose and 25 mM HEPES, pH 7.4). After a 10-min incubation in the HEPES buffer, cultures were exposed to BDNF (100 ng/mL), insulin (5 μg/mL), or vehicle (water, 1:100) for 10 minutes and then fixed with 4% paraformaldehyde in PBS for 20 minutes at RT, washed with PBS (3 × 5 minutes), permeabilized with 0.25% Triton ×−100 in PBS for 15 minutes, blocked with Odyssey blocking buffer (LI-COR Biosciences, 927-50000) for 1 hour at RT, and incubated overnight at 4° C with a rabbit anti-PTEN antibody (1:500, Cell Signaling, 9552) or with a combination of a rabbit anti- phospho-Akt antibody (1:500, Cell Signaling, 9271) and a mouse anti-pan-Akt antibody (1:500, Cell Signaling, 2920). On the next day, cultures were washed with PBS containing 0.1% Tween20 (PBST) three times for 5 minutes each at RT. Wells labeled with the anti-PTEN antibody were then incubated with donkey anti-rabbit IRDye 800CW (1:800, LI-COR) and CellTag 700 Stain (1:500, LI-COR) for 1 hour at RT, while wells labeled with anti-pAkt and anti- pan-Akt antibodies were incubated with donkey anti-rabbit IRDye 800CW (1:800, LI-COR) and donkey anti-mouse IRDye 680CW (1:800, LI-COR) for 1 hour at RT. Cultures were then washed in PBST three times for 5 minutes each at RT, dried, visualized with an Odyssey CLx Infrared Imaging System (LI-COR), and quantified with Image Studio software (LI-COR).
Immunohistochemistry
Brain sections were prepared and immunostained as described (Maeda et al., 2016; Stein and Imai, 2014). Briefly, saline-perfused hemibrains were drop-fixed in 4% paraformaldehyde overnight, rinsed, and stored at 4° C in cold PBS. Before sectioning, hemibrains were equilibrated in 30% sucrose for ≥48 hours at 4° C. Coronal brain sections (30 μm) were cut with a freezing microtome and stored at –20° C in cryopr otectant medium (30% glycerol and 30% ethylene-glycol in PBS). After rinses in PBS (3 × 10 minutes) and permeabilization with 0.25% Triton X-100 in PBS (PBS-Tx, 3 × 10 minutes), sections were incubated with 3% H2O2 and 10% methanol in PBS for 15 minutes to quench endogenous peroxidase, washed four times in PBS- Tx, incubated in blocking solution containing 10% normal donkey serum (Jackson ImmunoResearch, 017-000-121), 1% nonfat dry milk (Bio-Rad, 1706404xtu), and 0.2% gelatin in PBS-Tx for 60 minutes, and incubated overnight with the following primary antibodies: mouse anti-pan-Akt (1:1000, Cell Signaling, 2920), rabbit anti-phospho-Akt (1:1000, Cell Signaling, 4060), mouse anti-S6 ribosomal protein (1:1000, Cell Signaling, 2317), rabbit anti-phospho-S6 ribosomal protein (1:1000, Cell Signaling, 4858) in 3% normal donkey serum and 0.2% gelatin (Sigma-Aldrich) in PBS-Tx at RT. After three washes in PBS-Tx, sections were incubated with secondary antibodies (1:500, Invitrogen) in 3% normal donkey serum and 0.2% gelatin in PBS- Tx for 2 hours at RT. Sections were then washed in PBS (3 × 10 minutes), stained with Hoechst 33342 (1:10,000, Thermo Fisher Scientific, H3570) in PBS for 20 minutes at RT to visualize cell nuclei, and mounted in ProLong Diamond Antifade Mountant (Molecular Probes, P36970). Negative controls included the omission of primary or secondary antibodies. Microscopic imaging (10X) was done with a BZ-9000 inverted epifluorescence automated microscope system (Keyence) equipped with a 12-bit monochrome camera with red, green, and blue capability.
Proximity ligation assay (PLA)
Cultured primary neurons were assessed by PLA according to the Duolink PLA Fluorescence Protocol (Sigma-Aldrich). Neurons grown on coverslips (Corning, 354087) were quickly washed in DPBS and fixed with 4% paraformaldehyde in PBS for 20 minutes at RT, washed with PBS (3× 5 minutes), permeabilized with 0.2% Triton X-100 in PBS for 15 minutes, and blocked with 10% normal goat serum (Jackson ImmunoResearch, 005-000-121) in PBS with 0.1% Tween-20 (PBST) for 60 minutes at RT. The cells were then incubated at 4° C overnight in PBST containing 3% normal goat serum and the following primary antibodies: rabbit anti-PTEN (1:4000, Cell Signaling, 9552) and mouse anti-Tau5 (1:4000, Thermo Fisher Scientific, AHB0042). After washes in PBST (2 × 5 minutes) and PBS (1 × 5 minutes), neurons were incubated with two PLA probes (Duolink In Situ PLA Probe Anti-Rabbit PLUS DUO92002 and Anti-Mouse MINUS DUO92004, Sigma-Aldrich) in PBST with 3% normal goat serum for 1 hour at 37° C, followed by washes with PBST (2 × 5 minut es) and Wash Buffer A (2 × 5 minutes) (Sigma-Aldrich, DUO82049) and incubation in ligation solution (Duolink In Situ Detection Reagents Red, Sigma-Aldrich) for 30 minutes at 37° C. After ligation of complementary PLA probes that were in close proximity (≤40 nm), neurons were washed with Wash Buffer A (2 × 2 minutes) and incubated in the amplification solution (Sigma-Aldrich) for 100 minutes at 37° C to fluorescently label the ligated PLA probes. After amplification, rat neurons were further incubated with primary antibody against MAP2 (1:1000, Millipore, MAB3418) for 60 minutes at RT, washed in PBST (2 × 5 minutes), and incubated with secondary antibody for 60 minutes at RT (1:500, Invitrogen). Neurons were then washed in PBS (3 × 5 minutes), stained with Hoechst 33342 (1:10,000, Thermo Fisher Scientific, H3570) to visualize cell nuclei, rinsed in Wash Buffer B (2 × 10 minutes) and 0.01x Wash Buffer B (1 × 1 minute) (Sigma-Aldrich, DUO82048), and mounted in ProLong Diamond Antifade Mountant (Molecular Probes, P36970). Microscopic imaging (20X) was done with a BZ-9000 inverted epifluorescence automated microscope system (Keyence) equipped with a 12-bit monochrome camera with red, green, and blue capability.
Plasmid constructs
For co-immunoprecipitation experiments, a cDNA encoding WT 1N4R human Tau (hTau) was linked to a red-shifted variant of GFP (RSGFP4) by a P2A linker that contained a furin cleavage site and a V5 tag by PCR. The resulting GFP-P2A-hTau-WT construct was inserted into a FUGW backbone between the AscI and RsrII sites. This plasmid was used to generate deletion constructs of tau lacking specific domains (Figure 5D). Deletions were introduced with the Q5 Site-Directed Mutagenesis Kit (E0554S, New England BioLabs, NEB) using the primers listed in the Key Resource Table. These primers were designed with NEB online software (NEBaseChanger at NEBaseChanger.neb.com) and synthesized by Integrated DNA Technologies. A plasmid encoding GFP-P2A alone was used as a negative control.
For BiFC assays, we obtained two pcDNA3.1 plasmids from Addgene. One expresses WT human PTEN tagged N-terminally with the N-terminal part of Venus (aa 1–158) (VN-hPTEN, Plasmid 89331) (Marciniak et al., 2017); the other expresses WT 2N4R hTau tagged C- terminally with a complementary fragment of Venus (aa 159–239) (hTau-VC, Plasmid 87369) (Blum et al., 2015) (Figure 5G). The Q5 Site-Directed Mutagenesis Kit (NEB, E0554S) and the primers listed in the Key Resource Table were used to generate VC-tagged deletion mutants of 2N4R hTau (Figure 5G). The primers were designed with NEB online software (NEBaseChanger at NEBaseChanger.neb.com) and synthesized by Integrated DNA Technologies. A plasmid encoding VC alone served as a negative control.
After mutagenesis, plasmids were validated by sequence analysis (Quintarabio) and digestion with restriction enzymes (AscI and RsrII for FUGW plasmids; AflII and XbaI for pcDNA plasmids), and then used to transform the Stbl3 E. coli strain (Thermo Fisher Scientific, C737303) for maintenance and DNA purification (QIAGEN Plasmid Maxi Kits, 12163).
Co-immunoprecipitation assay
For co-immunoprecipitation (Co-IP) experiments, we used the Thermo Fisher Scientific Pierce Co-IP Kit (26149) according to the manufacturer’s protocol. HEK-293 cells were seeded into six- well plates at 200,000 cells/well, transfected with the plasmid constructs shown in Figure 5D using the CalPhos Mammalian Transfection Kit according to the manufacturer’s instructions (TaKaRa, 631312). After 48 hours, cells were lysed in ice-cold IP Lysis/Wash Buffer (0.025 M Tris, 0.15 M NaCl, 0.001 M EDTA, 1% NP-40, 5% glycerol; pH 7.4) with protease inhibitors (Complete Mini, Roche, 05892791001) and phosphatase inhibitors (PhosSTOP, Roche, 04906837001; Phosphatase Inhibitor Cocktails 2 and 3, Sigma-Aldrich, P5726 and P0044, respectively). Rabbit anti-PTEN antibody (Cell Signaling, 9552) was immobilized for 2 hours at RT on AminoLink Plus Coupling Resin (10 μl per column). The columns containing the antibody- coupled resin were washed and stored at 4° C. Cell lysates were pre-cleared with Control Agarose Resin at 4° C for 30 minutes and incubated with the antibody-coupled resin overnight at 4° C with gentle mixing. The resin was then wash ed five times in IP Lysis/Wash Buffer and once in Conditioning Buffer and centrifuged after each wash. Proteins were eluted with elution buffer (pH 2.8, containing primary amine) at RT. Eluates were analyzed by western blotting with primary antibodies (mouse anti-Tau46, 1:1000, Cell Signaling, 4019; mouse anti-Tau5, 1:1000, Thermo Fisher Scientific, AHB0042). A column containing PTEN-antibody-coupled resin treated with cell lysate from cells transfected with a plasmid encoding GFP-P2A alone served as a negative control (Figure 5E). An additional negative control consisted of a column containing resin that was not coupled to an antibody and was treated with cell lysate from cells transfected with a GFP-P2A-hTau-WT plasmid.
BiFC assay
HEK-293 cells were seeded on poly-D-lysine coated coverslips (Corning, 354087) into 24-well plates at 50,000 cells/well and transfected 24 hours later with VN-hPTEN in combination with WT hTau-VC or different hTau-VC deletion constructs (Figure 5G) using the CalPhos Mammalian Transfection Kit (TaKaRa, 631312) according to the manufacturer’s instructions. A plasmid encoding VC alone served as a negative control. Sixteen hours after transfection, cells were washed with DPBS, fixed with 4% paraformaldehyde in PBS for 20 minutes at RT, and permeabilized with 0.2% Triton X-100 in PBS for 15 minutes. After blocking with 10% normal goat serum (Jackson ImmunoResearch, 005-000-121) in PBS with 0.1% Tween-20 (PBST) for 60 minutes at RT, the cells were incubated at 4° C overnight with primary antibodies against PTEN (1:1000, Cell Signaling, 9552) and VC (1:1000, Millipore, MAB3580). A monoclonal primary antibody against GFP (MAB3580, Millipore) was selected for immunostaining, as it specifically recognized VC but not VN (Figure S5, C to E). After three washes with PBS, cells were incubated with secondary antibodies for 1 hour at RT. Cell nuclei were stained with Hoechst 33342 (Thermo Fisher Scientific, H3570). Microscopic images (20X) were obtained with the Zeiss LSM 880 automated microscope system described above. Zeiss ZEN imaging software was used to capture signals from four channels: BiFC-Venus signal (green), PTEN (red), VC (purple), and Hoechst 33342 (blue). Images were analyzed with ImageJ, which automatically picked regions of interest and read fluorescence intensity in each channel. Measurements of BiFC-Venus signals were normalized to VC signals for subsequent quantification.
Cell-free PTEN activity assay
PTEN activity was evaluated by monitoring production of PIP2 from PIP3 under cell-free conditions with the PTEN Activity ELISA kit (K-4700) from Echelon Biosciences according to the manufacturer’s protocol. Briefly, recombinant WT human PTEN (0.125–1.0 ng/μl; Echelon Biosciences, E-3000) was incubated with matching concentrations (in weight/volume) of recombinant 0N3R, 0N4R, 1N4R, or 2N4R hTau (Tau-352, Tau-383, Tau-412, or Tau-441, respectively; rPeptide) or with protease-free albumin (Gemini Bio-Products, 700–101P) as a negative control, in PTEN Reaction Buffer (K-4704, Echelon Biosciences) with 10 mM dithiothreitol (K-DTT1, Echelon Biosciences) containing PIP3 substrate (8 μM, K-4702; Echelon Biosciences) for 1–2 hours at 37° C in low-bind, 0. 5-ml Eppendorf tubes (Thermo Fisher Scientific, 13-698-793). PIP2 levels were determined after samples were then heated to an inactivating temperature of 95°C for 3 minutes.
Cell-free PI3K activity assay
PI3K activity was evaluated by monitoring production of PIP3 from PIP2 under cell-free conditions with the PI3K Activity ELISA kit (Pico, K-1000S) from Echelon Biosciences according to the manufacturer’s protocol. Among the 4 isoforms of the Class I catalytic subunits of PI3K, p110α and p110β are highly expressed in the CNS (Fruman et al., 2017). p110α is the main mediator of tyrosine kinase receptor signaling (Gross and Bassell, 2014). Recombinant WT human PI3Kα (p110α/p85α; 0.05–0.2 ng/μl; Echelon Biosciences, E-2000) was incubated with matching concentrations (in weight/volume) of recombinant 0N3R, 0N4R, 1N4R, or 2N4R hTau (Tau-352, Tau-383, Tau-412, or Tau-441, respectively; rPeptide) or with protease-free albumin (Gemini Bio-Products, 700–101P) as a negative control. LY294002 (Millipore Sigma, 440202), a specific PI3K inhibitor, was used as a positive control. The lipid kinase reactions were carried out in KBZ Reaction Buffer (K-KBZ, Echelon Biosciences) containing 2 mM DTT (1,4- Dithiothreitol, Millipore Sigma, 3483-12-3), 100 μM ATP (Millipore Sigma, A9187) and 5 μM PIP2 substrate (Echelon Biosciences, K-1008). After 2–3 hours of incubation at 37°C, reactions were stopped by adding a Kinase Stop Solution containing 4 mM EDTA (K-EDTA, Echelon Biosciences). PIP3 levels were determined using the Incubation Plate and Detection Plate (K- 1001s, Echelon Biosciences) according to the manufacturer’s protocol.
QUANTIFICATION AND STATISTICAL ANALYSIS
General
The Gladstone Bioinformatics Core provided advice on and assisted with the experimental designs, statistical analyses of data, and figure generation for this study. Statistical tests used, biological n, what n represents, definition of control/reference, definition of significance, and dispersion and precision measures (e.g., mean ± SEM) are described in the figures or figure legends. Statistical methods used for every dataset in this study are also listed in Table S2. Statistical analyses were done with GraphPad Prism version 7.00 (GraphPad Software, La Jolla, CA), except for the olfactory exploration and habituation/dishabituation tests, which were analyzed with R (https://www.r-project.org/). P values for behavioral data presented in this manuscript are summarized in Table S3.
No repeated measures in same subjects/samples
For each dataset, we used the D’Agostino-Pearson test first to ascertain whether the groups were distributed normally. If all groups were normally distributed, parametric tests were used; if not, non-parametric tests were used. If group sizes were small (e.g., n = 4–7), parametric tests were used because distribution assumptions could not be reliably assessed (Brown and Forsythe, 1974; Razali and Wah, 2011). For normally distributed data, we used the F-test (for datasets with two groups) or Brown-Forsythe test (for datasets with three or more groups) to determine whether the variances among groups were comparable. If so, unpaired, two-tailed Student’s t tests were used for datasets with two groups, and one-way or two-way ANOVA (for one or two independent categorical variables, respectively) was used for datasets with three or more groups, followed by Holm-Sidak post hoc test for pairwise comparisons. If variances were not comparable, Welch’s t test was used for datasets with two groups, and multiple Welch’s t tests were used for datasets with three or more groups with Holm-Sidak correction for multiple comparison. For nonparametric tests, we also used the F-test or Brown-Forsythe test to determine whether the variances among groups were comparable. If they were, the Kruskal- Wallis test was used for datasets with three or more groups, and Dunn’s post hoc test was used for pairwise comparisons.
Repeated measures in same subjects/samples
For nest building analysis (Figure 1J), nest building was scored 1, 2, 6, and 24 hours after nesting materials were given, and then analyzed by calculating the area under the curve for each mouse. D’Agostino-Pearson and Brown-Forsythe tests were then done, followed by two- way ANOVA and Holm-Sidak test for pairwise comparisons.
For olfactory habituation/dishabituation tests, sniffing times during each of three 2-minute trials of each of three olfactory stimuli were recorded. Olfactory habituation was analyzed by calculating the slopes of the linear regression lines through the three trials for each stimulus. Analysis of these data by D’Agostino-Pearson test revealed that they were not normally distributed. Habituation data were then modeled in the Generalized Estimating Equations (GEE) framework (Zeger and Liang, 1986) as a function of genotype, odorant stimulus, and their interaction. In the analysis, each disease model was chosen as the reference genotype, and water was chosen as the reference stimulus. Olfactory dishabituation was analyzed by calculating the difference between the sniffing time of the first trial of “Vanilla” (Vanilla 1) vs. the last trial of “Water” (Water 3), and the difference between the sniffing time of the first trial of “Social” (Social 1) vs. the last trial of “Vanilla” (Vanilla 3). Because these data were also not normally distributed, they were again modeled in the GEE framework as a function of genotype, stimulus, and their interaction. Each disease model was chosen as the reference genotype, “Vanilla 1 – Water 3” was chosen as the reference stimulus. The analyses were done with the R package geepack (Halekoh and Højsgaard, 2006; Yan, 2002) with an exchangeable correlation structure between all sniffing times for a given mouse. The P values for the significance of all related coefficients from this model were corrected for multiple testing with the Holm-Sidak test.
DATA AND CODE AVAILABILITY
Raw data will be made available to readers upon reasonable request.
Supplementary Material
Table S3. Summary of Behavioral P values. Related to Figure 1, Figure 2, Figure 7, Figure S1, and Figure S7.
Highlights:
(Up to 4 bullets. Each cannot exceed 85 characters, including spaces. To summarize the core results of the paper in order to allow readers to quickly gain an understanding of the main take- home messages of the paper.)
Tau reduction prevents autism-like behaviors in Scn1aRX/+ and Cntnap2−/− mice.
Tau reduction also prevents PI3K overactivation and megalencephaly in these models.
Tau interacts with PTEN via its proline-rich domain and suppresses PTEN activity.
PTEN is a critical mediator of the beneficial effects of tau reduction.
ACKNOWLEDGEMENTS
We thank M. H. Meisler (University of Michigan) and K. Yamakawa (RIKEN Brain Science Institute) for Scn1aRX/+ mice, J. Rubenstein (University of California, San Francisco) for Cntnap2−/− mice, S. Maeda for preparing the original GFP-P2A-hTau construct, D. Gulbranson for advice on cloning and cell culture experiments, D. Kim for assistance with primary cell cultures, M. Zhang for assistance with immunohistochemistry and imaging, N. Shanbhag for advice on PLA, L. Zhu for advice on ImageJ analysis, the Gladstone Behavioral Core for assistance with behavioral testing, the Gladstone Bioinformatics Core for advice on statistical analyses, the Gladstone Histology and Light Microscopy Core for assistance with histology and microscopy, and Randi Mott for administrative assistance. This work was supported by grants from the US National Institutes of Health (MH115679 to L.M. and RR18928 to the Gladstone Institutes) and by the Tau Consortium.
Footnotes
DECLARATION OF INTERESTS
Lennart Mucke is a co-inventor on patents filed by the Gladstone Institutes that focus on tau reduction as a strategy to block neural network dysfunction:
U.S. Patent Number 9,189,982 for “Agents that Reduce Neuronal Overexcitation”, issued December 1, 2015
U.S. Patent Number 9,084,813 for “Agents that Reduce Neuronal Overexcitation”, issued July 21, 2015
He is the principal investigator on a research project to develop tau-lowering small-molecule drugs that is supported, in part, by a corporate sponsored research agreement between the Gladstone Institutes and Cure Network Dolby Acceleration Partners, LLC. He also serves on the scientific advisory boards of Arvinas Operations, Biogen, and Dolby Family Ventures, and has provided consulting services to Sangamo Therapeutics.
Publisher's Disclaimer: This is a PDF file of an unedited manuscript that has been accepted for publication. As a service to our customers we are providing this early version of the manuscript. The manuscript will undergo copyediting, typesetting, and review of the resulting proof before it is published in its final form. Please note that during the production process errors may be discovered which could affect the content, and all legal disclaimers that apply to the journal pertain.
REFERENCES
- Allen Institute for Brain Science. (2019). Allen Brain Atlas: Developing Mouse Brain. Available from: https://developingmouse.brain-map.org/gene/show/17529.
- Baio J., Wiggins L., Christensen DL., Maenner MJ., Daniels J., Warren Z., Kurzius-Spencer M., Zahorodny W., Robinson Rosenberg C., White T., et al. (2018). Prevalence of autism spectrum disorder among children aged 8 years—Autism and Developmental Disabilities Monitoring Network, 11 Sites, United States, 2014. MMWR Surveill Summ 67, 1–23. [DOI] [PMC free article] [PubMed] [Google Scholar]
- Berkvens JJ, Veugen I, Veendrick-Meekes MJ, Snoeijen-Schouwenaars FM, Schelhaas HJ, Willemsen MH, Tan IY, and Aldenkamp AP (2015). Autism and behavior in adult patients with Dravet syndrome (DS). Epilepsy Behav 47, 11–16. [DOI] [PubMed] [Google Scholar]
- Bi M, Gladbach A, van Eersel J, Ittner A, Przybyla M, van Hummel A, Chua SW, van der Hoven J, Lee WS, Muller J, et al. (2017). Tau exacerbates excitotoxic brain damage in an animal model of stroke. Nat Commun 8, 473. [DOI] [PMC free article] [PubMed] [Google Scholar]
- Bidinosti M, Botta P, Kruttner S, Proenca CC, Stoehr N, Bernhard M, Fruh I, Mueller M, Bonenfant D, Voshol H, et al. (2016). CLK2 inhibition ameliorates autistic features associated with SHANK3 deficiency. Science 351, 1199–1203. [DOI] [PubMed] [Google Scholar]
- Blum D, Herrera F, Francelle L, Mendes T, Basquin M, Obriot H, Demeyer D, Sergeant N, Gerhardt E, Brouillet E, et al. (2015). Mutant huntingtin alters Tau phosphorylation and subcellular distribution. Hum Mol Genet 24, 76–85. [DOI] [PubMed] [Google Scholar]
- Brion JP, Smith C, Couck AM, Gallo JM, and Anderton BH (1993). Developmental changes in tau phosphorylation: fetal tau is transiently phosphorylated in a manner similar to paired helical filament-tau characteristic of Alzheimer’s disease. J Neurochem 61, 2071–2080. [DOI] [PubMed] [Google Scholar]
- Brown M, and Forsythe A (1974). Robust Tests for the Equality of Variances. J Am Stat Assoc 69, 364–367. [Google Scholar]
- Buckmaster P, Ingram E, and Wen X (2009). Inhibition of the mammalian target of rapamycin signaling pathway suppresses dentate granule cell axon sprouting in a rodent model of temporal lobe epilepsy. J Neurosci 29, 8259–8269. [DOI] [PMC free article] [PubMed] [Google Scholar]
- Bullmann T, Holzer M, Mori H, and Arendt T (2009). Pattern of tau isoforms expression during development in vivo. Int J Dev Neurosci 27, 591–597. [DOI] [PubMed] [Google Scholar]
- Butler MG, Dasouki MJ, Zhou XP, Talebizadeh Z, Brown M, Takahashi TN, Miles JH, Wang CH, Stratton R, Pilarski R, and Eng C (2005). Subset of individuals with autism spectrum disorders and extreme macrocephaly associated with germline PTEN tumour suppressor gene mutations. J Med Genet 42, 318–321. [DOI] [PMC free article] [PubMed] [Google Scholar]
- Catterall WA (2017). Forty years of sodium channels: structure, function, pharmacology, and epilepsy. Neurochem Res 42, 2495–2504. [DOI] [PMC free article] [PubMed] [Google Scholar]
- Cheng JS, Craft R, Yu GQ, Ho K, Wang X, Mohan G, Mangnitsky S, Ponnusamy R, and Mucke L (2014). Tau reduction diminishes spatial learning and memory deficits after mild repetitive traumatic brain injury in mice. PLoS One 9, e115765. [DOI] [PMC free article] [PubMed] [Google Scholar]
- Claes L., Del-Favero J., Ceulemans B., Lagae L., Van Broeckhoven C., and De Jonghe P. (2001). De novo mutations in the sodium-channel gene SCN1A cause severe myoclonic epilepsy of infancy. Am J Hum Genet 68, 1327–1332. [DOI] [PMC free article] [PubMed] [Google Scholar]
- Crino PB (2016). The mTOR signalling cascade: paving new roads to cure neurological disease. Nat Rev Neurol 12, 379–392. [DOI] [PubMed] [Google Scholar]
- Das M, Maeda S, Hu B, Yu GQ, Guo W, Lopez I, Yu X, Tai C, Wang X, and Mucke L (2018). Neuronal levels and sequence of tau modulate the power of brain rhythms. Neurobiol Dis 117, 181–188. [DOI] [PubMed] [Google Scholar]
- Davidson L, Maccario H, Perera NM, Yang X, Spinelli L, Tibarewal P, Glancy B, Gray A, Weijer CJ, Downes CP, and Leslie NR (2010). Suppression of cellular proliferation and invasion by the concerted lipid and protein phosphatase activities of PTEN. Oncogene 29, 687–697. [DOI] [PMC free article] [PubMed] [Google Scholar]
- Dawson HN, Ferreira A, Eyster MV, Ghoshal N, Binder LI, and Vitek MP (2001). Inhibition of neuronal maturation in primary hippocampal neurons from tau deficient mice. J Cell Sci 114, 1179–1187. [DOI] [PubMed] [Google Scholar]
- Devos SL, Goncharoff DK, Chen G, Kebodeaux CS, Yamada K, Stewart FR, Schuler DR, Maloney SE, Wozniak DF, Rigo F, et al. (2013). Antisense reduction of tau in adult mice protects against seizures. J Neurosci 33, 12887–12897. [DOI] [PMC free article] [PubMed] [Google Scholar]
- Dioli C, Patricio P, Trindade R, Pinto LG, Silva JM, Morais M, Ferreiro E, Borges S, Mateus-Pinheiro A, Rodrigues AJ, et al. (2017). Tau-dependent suppression of adult neurogenesis in the stressed hippocampus. Mol Psychiatry 22, 1110–1118. [DOI] [PubMed] [Google Scholar]
- Drubin DG, Caput D, and Kirschner MW (1984). Studies on the expression of the microtubule-associated protein, tau, during mouse brain development, with newly isolated complementary DNA probes. J Cell Biol 98, 1090–1097. [DOI] [PMC free article] [PubMed] [Google Scholar]
- Durand CM, Betancur C, Boeckers TM, Bockmann J, Chaste P, Fauchereau F, Nygren G, Rastam M, Gillberg IC, Anckarsater H, et al. (2007). Mutations in the gene encoding the synaptic scaffolding protein SHANK3 are associated with autism spectrum disorders. Nat Genet 39, 25–27. [DOI] [PMC free article] [PubMed] [Google Scholar]
- Ebert DH, and Greenberg ME (2013). Activity-dependent neuronal signalling and autism spectrum disorder. Nature 493, 327–337. [DOI] [PMC free article] [PubMed] [Google Scholar]
- Enriquez-Barreto L, and Morales M (2016). The PI3K signaling pathway as a pharmacological target in Autism related disorders and Schizophrenia. Mol Cell Ther 4, 1–12. [DOI] [PMC free article] [PubMed] [Google Scholar]
- Fruman DA., Chiu H., Hopkins BD., Bagrodia S., Cantley LC., and Abraham RT. (2017). The PI3K Pathway in Human Disease. Cell 170, 605–635. [DOI] [PMC free article] [PubMed] [Google Scholar]
- Geschwind DH (2009). Advances in autism. Annu Rev Med 60, 367–380. [DOI] [PMC free article] [PubMed] [Google Scholar]
- Geschwind DH, and State MW (2015). Gene hunting in autism spectrum disorder: on the path to precision medicine. Lancet Neurol 14, 1109–1120. [DOI] [PMC free article] [PubMed] [Google Scholar]
- Gheyara AL, Ponnusamy R, Djukic B, Craft RJ, Ho K, Guo W, Finucane MM, Sanchez PE, and Mucke L (2014). Tau reduction prevents disease in a mouse model of Dravet syndrome. Ann Neurol 76, 443–456. [DOI] [PMC free article] [PubMed] [Google Scholar]
- Gross C, and Bassell GJ (2014). Neuron-specific regulation of class I PI3K catalytic subunits and their dysfunction in brain disorders. Front Mol Neurosci 7, 12. [DOI] [PMC free article] [PubMed] [Google Scholar]
- Guariglia SR, and Chadman KK (2013). Water T-maze: A useful assay for determination of repetitive behaviors in mice. J Neurosci Methods 220, 24–29. [DOI] [PubMed] [Google Scholar]
- Halekoh U, and Højsgaard S (2006). The R Package geepack for generalized estimating equations. J Stat Software 15, 1–11. [Google Scholar]
- Han S, Tai C, Westenbroek RE, Yu FH, Cheah CS, Potter GB, Rubenstein JL, Scheuer T, de la Iglesia HO, and Catterall WA (2012). Autistic-like behaviour in Scn1a+/− mice and rescue by enhanced GABA-mediated neurotransmission. Nature 489, 385–390. [DOI] [PMC free article] [PubMed] [Google Scholar]
- Holth JK, Bomben VC, Reed JG, Inoue T, Younkin L, Younkin SG, Pautler RG, Botas J, and Noebels JL (2013). Tau loss attenuates neuronal network hyperexcitability in mouse and Drosophila genetic models of epilepsy. J Neurosci 33, 1651–1659. [DOI] [PMC free article] [PubMed] [Google Scholar]
- Huang X, Zhang H, Yang J, Wu J, McMahon J, Lin Y, Cao Z, Gruenthal M, and Huang Y (2010). Pharmacological inhibition of the mammalian target of rapamycin pathway suppresses acquired epilepsy. Neurobiol Dis 40, 193–199. [DOI] [PMC free article] [PubMed] [Google Scholar]
- Ito S, Ogiwara I, Yamada K, Miyamoto H, Hensch TK, Osawa M, and Yamakawa K (2013). Mouse with Nav1.1 haploinsufficiency, a model for Dravet syndrome, exhibits lowered sociability and learning impairment. Neurobiol Dis 49, 29–40. [DOI] [PubMed] [Google Scholar]
- Jirkof P (2014). Burrowing and nest building behavior as indicators of well-being in mice. J Neurosci Methods 234, 139–146. [DOI] [PubMed] [Google Scholar]
- Kalueff AV, Stewart AM, Song C, Berridge KC, Graybiel AM, and Fentress JC (2016). Neurobiology of rodent self-grooming and its value for translational neuroscience. Nat Rev Neurosci 17, 45–59. [DOI] [PMC free article] [PubMed] [Google Scholar]
- Klein S, Sharifi-Hannauer P, and Martinez-Agosto JA (2013). Macrocephaly as a clinical indicator of genetic subtypes in autism. Autism Res 6, 51–56. [DOI] [PMC free article] [PubMed] [Google Scholar]
- Kosik KS, Orecchio LD, Bakalis S, and Neve RL (1989). Developmentally regulated expression of specific tau sequences. Neuron 2, 1389–1397. [DOI] [PubMed] [Google Scholar]
- Kowiański P., Lietzau G., Czuba E., Waśkow M., Steliga A., and Moryś J. (2018). BDNF: A Key Factor with Multipotent Impact on Brain Signaling and Synaptic Plasticity. Cell Mol Neurobiol 38, 579–593. [DOI] [PMC free article] [PubMed] [Google Scholar]
- Kwon CH, Luikart BW, Powell CM, Zhou J, Matheny SA, Zhang W, Li Y, Baker SJ, and Parada LF (2006). Pten regulates neuronal arborization and social interaction in mice. Neuron 50, 377–388. [DOI] [PMC free article] [PubMed] [Google Scholar]
- Leigh JP, and Du J (2015). Brief report: Forecasting the economic burden of autism in 2015 and 2025 in the United States. J Autism Dev Disord 45, 4135–4139. [DOI] [PubMed] [Google Scholar]
- Li BM, Liu XR, Yi YH, Deng YH, Su T, Zou X, and Liao WP (2011). Autism in Dravet syndrome: Prevalence, features, and relationship to the clinical characteristics of epilepsy and mental retardation. Epilepsy Behav 21, 291–295. [DOI] [PubMed] [Google Scholar]
- Li Z, Hall AM, Kelinske M, and Roberson ED (2014). Seizure resistance without parkinsonism in aged mice after tau reduction. Neurobiol Aging 35, 2617–2624. [DOI] [PMC free article] [PubMed] [Google Scholar]
- Liu C, and Götz J (2013). Profiling murine tau with 0N, 1N and 2N isoform-specific antibodies in brain and peripheral organs reveals distinct subcellular localization, with the 1N isoform being enriched in the nucleus. PLoS One 8, e84849. [DOI] [PMC free article] [PubMed] [Google Scholar]
- Lord C, Cook EH, Leventhal BL, and Amaral DG (2000). Autism spectrum disorders. Neuron 28, 355–363. [DOI] [PubMed] [Google Scholar]
- Luczynski P, Whelan SO, O’Sullivan C, Clarke G, Shanahan F, Dinan TG, and Cryan JF (2016). Adult microbiota-deficient mice have distinct dendritic morphological changes: Differential effects in the amygdala and hippocampus. Eur J Neurosci 44, 2654–2666. [DOI] [PMC free article] [PubMed] [Google Scholar]
- Maeda S, Djukic B, Taneja P, Yu GQ, Lo I, Davis A, Craft R, Guo W, Wang X, Kim D, et al. (2016). Expression of A152T human tau causes age-dependent neuronal dysfunction and loss in transgenic mice. EMBO Rep 17, 530–551. [DOI] [PMC free article] [PubMed] [Google Scholar]
- Maehama T, and Dixon JE (1998). The tumor suppressor, PTEN/MMAC1, dephosphorylates the lipid second messenger, phosphatidylinositol 3,4,5-trisphosphate. J Biol Chem 273, 13375–13378. [DOI] [PubMed] [Google Scholar]
- Marciniak E, Leboucher A, Caron E, Ahmed T, Tailleux A, Dumont J, Issad T, Gerhardt E, Pagesy P, Vileno M, et al. (2017). Tau deletion promotes brain insulin resistance. J Exp Med, 2257–2269. [DOI] [PMC free article] [PubMed] [Google Scholar]
- Maski KP, Jeste SS, and Spence SJ (2011). Common neurological co-morbidities in autism spectrum disorders. Curr Opin Pediatr 23, 609–615. [DOI] [PMC free article] [PubMed] [Google Scholar]
- McMillan P., Korvatska E., Poorkaj P., Evstafjeva Z., Robinson L., Greenup L., Leverenz J., Schellenberg GD., and D’Souza I. (2008). Tau isoform regulation is region- and cell-specific in mouse brain. J Comp Neurol 511, 788–803. [DOI] [PMC free article] [PubMed] [Google Scholar]
- Meikle L, Pollizzi K, Egnor A, Kramvis I, Lane H, Sahin M, and Kwiatkowski DJ (2008). Response of a neuronal model of tuberous sclerosis to mammalian target of rapamycin (mTOR) inhibitors: Effects on mTORC1 and Akt signaling lead to improved survival and function. J Neurosci 28, 5422–5432. [DOI] [PMC free article] [PubMed] [Google Scholar]
- Miyamoto T, Stein L, Thomas R, Djukic B, Taneja P, Knox J, Vossel K, and Mucke L (2017). Phosphorylation of tau at Y18, but not tau-fyn binding, is required for tau to modulate NMDA receptor-dependent excitotoxicity in primary neuronal culture. Mol Neurodegener 12, 41. Monteiro, P., and Feng, G. (2017). SHANK proteins: roles at the synapse and in autism spectrum disorder. Nat Rev Neurosci 18, 147–157. [DOI] [PMC free article] [PubMed] [Google Scholar]
- Morris M, Hamto P, Adame A, Devidze N, Masliah E, and Mucke L (2013). Age- appropriate cognition and subtle dopamine-independent motor deficits in aged Tau knockout mice. Neurobiol Aging 34, 1523–1529. [DOI] [PMC free article] [PubMed] [Google Scholar]
- Morris M, Maeda S, Vossel K, and Mucke L (2011). The many faces of tau. Neuron 70, 410–426. [DOI] [PMC free article] [PubMed] [Google Scholar]
- Mullins C, Fishell G, and Tsien RW (2016). Unifying views of autism spectrum disorders: A consideration of autoregulatory feedback loops. Neuron 89, 1131–1156. [DOI] [PMC free article] [PubMed] [Google Scholar]
- Nygaard KR, Maloney SE, and Dougherty JD (2019). Erroneous inference based on a lack of preference within one group: Autism, mice, and the social approach task. Autism Res 12, 1171–1183. [DOI] [PMC free article] [PubMed] [Google Scholar]
- Ogiwara I, Miyamoto H, Morita N, Atapour N, Mazaki E, Inoue I, Takeuchi T, Itohara S, Yanagawa Y, Obata K, et al. (2007). Na(v)1.1 localizes to axons of parvalbumin-positive inhibitory interneurons: A circuit basis for epileptic seizures in mice carrying an Scn1a gene mutation. J Neurosci 27, 5903–5914. [DOI] [PMC free article] [PubMed] [Google Scholar]
- Peça J, Feliciano C, Ting JT, Wang W, Wells MF, Venkatraman TN, Lascola CD, Fu Z, and Feng G (2011). Shank3 mutant mice display autistic-like behaviours and striatal dysfunction. Nature 472, 437–442. [DOI] [PMC free article] [PubMed] [Google Scholar]
- Penagarikano O, Abrahams BS, Herman EI, Winden KD, Gdalyahu A, Dong H, Sonnenblick LI, Gruver R, Almajano J, Bragin A, et al. (2011). Absence of CNTNAP2 leads to epilepsy, neuronal migration abnormalities, and core autism-related deficits. Cell 147, 235–246. [DOI] [PMC free article] [PubMed] [Google Scholar]
- Poliak S, Salomon D, Elhanany H, Sabanay H, Kiernan B, Pevny L, Stewart CL, Xu X, Chiu SY, Shrager P, et al. (2003). Juxtaparanodal clustering of Shaker-like K+ channels in myelinated axons depends on Caspr2 and TAG-1. J Cell Biol 162, 1149–1160. [DOI] [PMC free article] [PubMed] [Google Scholar]
- Razali N., and Wah Y. (2011). Power comparisons of Shapiro-Wilk, Kolmogorov-Smirnov, Lilliefors and Anderson-Darling tests. J Stat Modeling Analytics 2, 21–33. [Google Scholar]
- Ren QG, Liao XM, Chen XQ, Liu GP, and Wang JZ (2007). Effects of tau phosphorylation on proteasome activity. FEBS Lett 581, 1521–1528. [DOI] [PubMed] [Google Scholar]
- Roberson ED, Halabisky B, Yoo JW, Yao J, Chin J, Yan F, Wu T, Hamto P, Devidze N, Yu G-Q, et al. (2011). Amyloid-β/Fyn-induced synaptic, network, and cognitive impairments depend on tau levels in multiple mouse models of Alzheimer’s disease. J Neurosci 31, 700–711. [DOI] [PMC free article] [PubMed] [Google Scholar]
- Rovelet-Lecrux A, and Campion D (2012). Copy number variations involving the microtubule-associated protein tau in human diseases. Biochem Soc Trans 40, 672–676. [DOI] [PubMed] [Google Scholar]
- Sacco R, Gabriele S, and Persico AM (2015). Head circumference and brain size in autism spectrum disorder: A systematic review and meta-analysis. Psychiatry Res 234, 239–251. [DOI] [PubMed] [Google Scholar]
- Silverman JL, Yang M, Lord C, and Crawley JN (2010). Behavioural phenotyping assays for mouse models of autism. Nat Rev Neurosci 11, 490–502. [DOI] [PMC free article] [PubMed] [Google Scholar]
- Sotiropoulos I, Galas MC, Silva JM, Skoulakis E, Wegmann S, Maina MB, Blum D, Sayas CL, Mandelkow EM, Mandelkow E, et al. (2017). Atypical, non-standard functions of the microtubule associated Tau protein. Acta Neuropathol Commun 5, 91. [DOI] [PMC free article] [PubMed] [Google Scholar]
- Stein LR, and Imai S (2014). Specific ablation of Nampt in adult neural stem cells recapitulates their functional defects during aging. EMBO J 33, 1321–1340. [DOI] [PMC free article] [PubMed] [Google Scholar]
- Strauss KA, Puffenberger EG, Huentelman MJ, Gottlieb S, Dobrin SE, Parod JM, Stephan DA, and Morton DH (2006). Recessive symptomatic focal epilepsy and mutant contactin-associated protein-like 2. N Engl J Med 354, 1370–1377. [DOI] [PubMed] [Google Scholar]
- Sungur AO, Schwarting RK, and Wohr M (2016). Early communication deficits in the Shank1 knockout mouse model for autism spectrum disorder: Developmental aspects and effects of social context. Autism Res 9, 696–709. [DOI] [PubMed] [Google Scholar]
- Sutton G, and Chandler L (2002). Activity-dependent NMDA receptor-mediated activation of protein kinase B/Akt in cortical neuronal cultures. J Neurochem 82, 1097–1105. [DOI] [PubMed] [Google Scholar]
- Tilot AK, Frazier TW II, and Eng C (2015). Balancing proliferation and connectivity in PTEN-associated autism spectrum disorder. Neurotherapeutics 12, 609–619. [DOI] [PMC free article] [PubMed] [Google Scholar]
- Tuchman R, Cuccaro M, and Alessandri M (2010). Autism and epilepsy: Historical perspective. Brain Dev 32, 709–718. [DOI] [PubMed] [Google Scholar]
- Vossel KA, Xu JC, Fomenko V, Miyamoto T, Suberbielle E, Knox JA, Ho K, Kim DH, Yu GQ, and Mucke L (2015). Tau reduction prevents Aβ-induced axonal transport deficits by blocking activation of GSK3β. J Cell Biol 209, 419–433. [DOI] [PMC free article] [PubMed] [Google Scholar]
- Wang Y., and Mandelkow E. (2016). Tau in physiology and pathology. Nat Rev Neurosci 17, 5–21. [DOI] [PubMed] [Google Scholar]
- Whitman M, Kaplan DR, Schaffhausen B, Cantley L, and Roberts TM (1985). Association of phosphatidylinositol kinase activity with polyoma middle-T competent for transformation. Nature 315, 239–242. [DOI] [PubMed] [Google Scholar]
- Willsey AJ, and State MW (2015). Autism spectrum disorders: From genes to neurobiology. Curr Opin Neurobiol 30, 92–99. [DOI] [PMC free article] [PubMed] [Google Scholar]
- Wilson HL, Wong AC, Shaw SR, Tse WY, Stapleton GA, Phelan MC, Hu S, Marshall J, and McDermid HE (2003). Molecular characterisation of the 22q13 deletion syndrome supports the role of haploinsufficiency of SHANK3/PROSAP2 in the major neurological symptoms. J Med Genet 40, 575–584. [DOI] [PMC free article] [PubMed] [Google Scholar]
- Won H, Mah W, and Kim E (2013). Autism spectrum disorder causes, mechanisms, and treatments: Focus on neuronal synapses. Front Mol Neurosci 6, 19. [DOI] [PMC free article] [PubMed] [Google Scholar]
- Xing X, Zhang J, Wu K, Cao B, Li X, Jiang F, Hu Z, Xia K, and Li JD (2019). Suppression of Akt-mTOR pathway rescued the social behavior in Cntnap2-deficient mice. Sci Rep 9, 1–9. [DOI] [PMC free article] [PubMed] [Google Scholar]
- Yan J (2002). Geepack: yet another package for generalized estimating equations. R-News 2, 12–14. [Google Scholar]
- Yeung KS, Tso WWY, Ip JJK, Mak CCY, Leung GKC, Tsang MHY, Ying D, Pei SLC, Lee SL, Yang W, and Chung BH (2017). Identification of mutations in the PI3K- AKT-mTOR signalling pathway in patients with macrocephaly and developmental delay and/or autism. Mol Autism 8. [DOI] [PMC free article] [PubMed] [Google Scholar]
- Zeger SL, and Liang KY (1986). Longitudinal data analysis for discrete and continuous outcomes. Biometrics 42, 121–130. [PubMed] [Google Scholar]
- Zeng L, Rensing N, and Wong M (2009). The mammalian target of rapamycin signaling pathway mediates epileptogenesis in a model of temporal lobe epilepsy. J Neurosci 29, 6964–6972. [DOI] [PMC free article] [PubMed] [Google Scholar]
- Zeng L, Rensing N, Zhang B, Gutmann D, Gambello M, and Wong M (2011). Tsc2 gene inactivation causes a more severe epilepsy phenotype than Tsc1 inactivation in a mouse model of tuberous sclerosis complex. Hum Mol Genet 20, 445–454. [DOI] [PMC free article] [PubMed] [Google Scholar]
- Zeng L, Xu L, Gutmann D, and Wong M (2008). Rapamycin prevents epilepsy in a mouse model of tuberous sclerosis complex. Ann Neurol 63, 444–453. [DOI] [PMC free article] [PubMed] [Google Scholar]
- Zhang B, and Wong M (2012). Pentylenetetrazole-induced seizures cause acute, but not chronic, mTOR pathway activation in rat. Epilepsia 53, 506–511. [DOI] [PMC free article] [PubMed] [Google Scholar]
- Zheng W., and Quirion R. (2004). Comparative signaling pathways of insulin-like growth factor- 1 and brain-derived neurotrophic factor in hippocampal neurons and the role of the PI3 kinase pathway in cell survival. J Neurochem 89, 844–852. [DOI] [PubMed] [Google Scholar]
- Zhou J, Blundell J, Ogawa S, Kwon CH, Zhang W, Sinton C, Powell CM, and Parada LF(2009). Pharmacological inhibition of mTORC1 suppresses anatomical, cellular, and behavioral abnormalities in neural-specific Pten knock-out mice. J Neurosci 29, 1773–1783. [DOI] [PMC free article] [PubMed] [Google Scholar]
Associated Data
This section collects any data citations, data availability statements, or supplementary materials included in this article.
Supplementary Materials
Table S3. Summary of Behavioral P values. Related to Figure 1, Figure 2, Figure 7, Figure S1, and Figure S7.
Data Availability Statement
Raw data will be made available to readers upon reasonable request.