Abstract
Background
The prognosis of patients with stage I non-small cell lung cancer (NSCLC) is often uncertain. This study aims to investigate a new prognostic tool to classify stage I NSCLC patients more accurately.
Methods
CD68 and CD163 macrophages were quantified by immunohistochemical analyses of the center of the tumor and the invasive margin of the 339 tumors, which were used to construct the macrophage immunoscore (MI). Cox proportional hazards models determined the effects of multiple factors on disease-free survival (DFS) and overall survival (OS). One nomogram was developed to predict DFS and OS of stage I patients.
Results
The multivariate Cox analysis identified MI (P<0.001), lymphocyte-to-monocyte ratio (LMR, P=0.006), and TNM stage (P=0.046) as independent prognostic factors for DFS. Compared with MI, TNM stage, and LMR alone, the nomogram improved the prediction accuracy of both DFS and OS in terms of the Harrell concordance index in the training cohort (0.812, P<0.001 for DFS; 0.810, P<0.001 for OS) and the external validation cohort (0.796, P<0.001 for DFS; 0.791, P<0.001 for OS). In addition, net reclassification (Nomogram vs. TNM-stage, P<0.001 for DFS and OS) and the integrated discrimination (Nomogram vs. TNM stage, P<0.001 for DFS and OS) also validated this improvement.
Conclusions
The immunoscore-based prognostic nomogram could effectively predict DFS and OS of stage I NSCLC patients and enhance the predictive value of the TNM stage system.
Keywords: Non-small cell lung cancer (NSCLC), lymphocyte-to-monocyte ratio (LMR), immunoscore
Introduction
Most lung cancers (85%) are non-small cell lung cancer (NSCLC), which is the leading cause of cancer deaths worldwide (1). Although stage I patients are well treated with curative surgery, their disease-free survival (DFS) and overall survival (OS) rates have been substantially different from each other, even after complete surgical resections (2). The identification of new biological predictors to improve the estimation of postoperative survival times for stage I NSCLC patients, therefore, remains a crucial clinical issue.
Previous studies have suggested that tumor-associated macrophages (TAMs) are the most frequent stromal cells associated with the immune system in the tumor microenvironment (TME). They selectively activate and promote tumor proliferation, epithelial-mesenchymal transformation, invasion, and metastasis, leading to poor prognosis of patients (3). Although many markers, such as CD68, CD163, CD204, and HLA-DR, have been applied to identify different kinds of TAMs in the tumor tissues (4), CD68 and CD163 are the most frequently used markers (5). Meanwhile, systemic inflammation also plays a significant role in the proliferation of cancer cells at various stages of tumor metastasis and development (6). This could be the reason why accumulating evidence has revealed the prognostic potential of parameters for assessing the systemic inflammation status in the tumor, including blood cells count (7), the neutrocyte-to-lymphocyte ratio (NLR), the neutrocyte-to-monocyte ratio (NMR), the platelet-to-lymphocyte ratio (PLR), and the lymphocyte-to-monocyte ratio (LMR) (8). However, a TNM-immune system that would combine TAMs and systemic inflammation in stage I NSCLC patients has not been identified so far.
Considering these deliberations, we think it is necessary to propose a new prognostic tool based on TAMs and systemic inflammation to reveal the treatment methods. In this study, we combined Macrophage Immunoscore (MI), LMR, and TNM stage to establish an immunoscore-based prognostic nomogram. We focused on patients with stage I NSCLC from two independent cohorts to prove the predictive value of the immunoscore-based prognostic nomogram for OS and DFS (Figure S1).
Methods
Patients
We selected 339 patients with stage I NSCLC, including 217 from Shanghai Pulmonary Hospital of Tongji University between September 2009 and December 2009 for the training cohort, and 122 from Hwa Mei Hospital, University of Chinese Academy of Sciences, and Affiliated Zhuzhou Hospital of Xiangya School of Medicine of CSU between December 2009 and January 2011 for the external validation cohort. Patients who met the following criteria were enrolled in the study: (I) no history of other malignancies; (II) with radical resections including lobectomy and sublobectomy in the form of video-assisted thoracoscopic surgery (VATS); (III) no neoadjuvant or adjuvant treatments; (IV) histopathologically confirmed diagnosis as NSCLC stage I according to 8th edition of the TNM classification for lung cancer; and (V) entire clinicopathological details and follow-up results. Patients were ruled out if they presented with a perioperative mortality or a second primary cancer. The study was endorsed by the Ethics Committee of Tongji University, University of Chinese Academy of Sciences, and Xiangya School of Medicine of CSU.
Follow-up survival
The follow-up of patients was performed by phone call, the pulmonary CT and blood routines according to the specific protocol, every 3 months the 1st year, every 6 months until the 2nd year and every year after the 2nd year. The outcomes we included in this study were DFS and OS, which were obtained until May 31, 2019 for the training cohort and June 30, 2019 for the external validation cohort. The DFS time was measured from the surgery until the first recurrence or the death induced by any cause, and the OS time was determined from the surgery to the death induced by any cause.
Immunohistochemistry (IHC) and assessment of the systemic inflammatory response
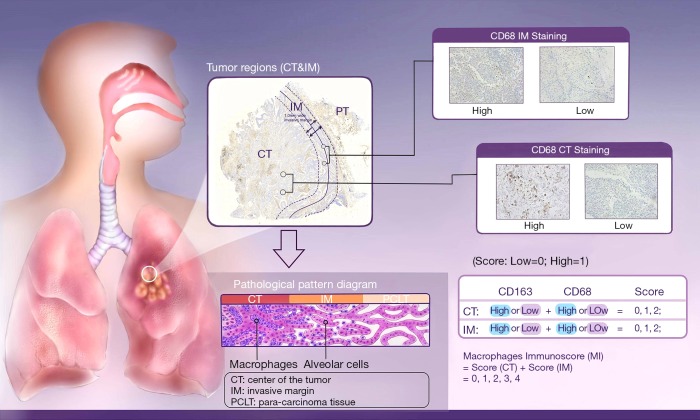
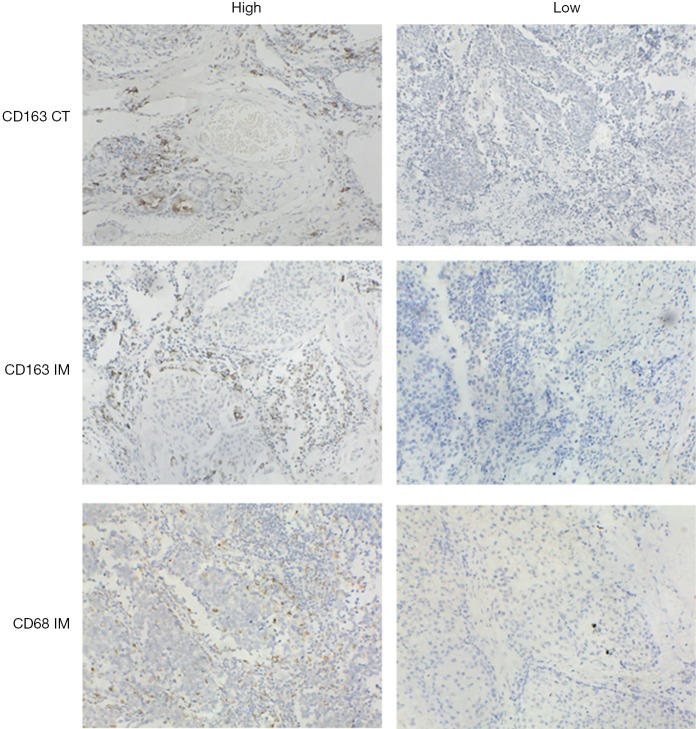
As the combination of 2 markers (CD3 and CD8) in 2 regions (center of the tumor and invasive margin) has been agreed for validation in standard clinical practice, two representative sections in this study were also selected from the invasive margin and the center of the tumor (Figure 1), respectively (10-12). The density was calculated by the number of stained cells in each unit tissue surface area at ×200 magnification (1 mm). Patients were stratified according to the MI ranging from 0 to 4, according to the sum of high densities observed (Figure 1, Figure S2). More details on how the IHC was performed were stated in the Supplementary files.
Figure 1.
The MI definition and methodology. The box on the upper left illustrated the division of the center of the tumor (CT) and invasive margin (IM) based on H&E section of NSCLC (original magnification, ×200) as well as the pathological differences between these two regions displayed by the pathological pattern diagram at the bottom left. The IM was defined as the region centered on the border separating the host tissue from the malignant nests, with an extent of 1 mm. Center of the tumor corresponded to all the tissue inside the IM, and para-carcinoma tissue (PCLT) corresponded to tissue outside of the IM (9). Two boxes on the upper right showed four representative IHC images of CD68 CT staining and CD68 IM staining. The table on the bottom right demonstrated the Establishment of a Macrophages Immunoscore based on the enumeration of two macrophages populations (CD163 and CD68) in CT and IM. Each tumor is categorized into high or low density for each marker in each tumor region according to a predetermined cutoff value. Patients are stratified according to a score ranging from 0 to 4, depending on the total number of high densities observed (two markers assessed in CT, two markers assessed in IM).
Pre-operative serum white blood cells count, platelets count, differential white cell count and serum tumor markers were measured within 1 week prior to the surgery as routine and recorded prospectively.
Statistical analysis
In all cohorts, samples were anonymized and independently scored by four experienced pathologists. Accordingly, the final count of each slide was the average of the four pathologists’ results. In case of disagreement, the slides were reexamined and the observers reached a consensus. We chose the optimum cut-off points of every feature for the best separation of patients based on their DFS outcomes (Table S1), by X-tile software version 3.6.1 (Yale University School of Medicine, New Haven, Connecticut, United States; Figures S3,S4,S5). Kaplan-Meier survival curves with a log-rank test were applied to analyze the differences of DFS and OS of patients’ groups stratified on MI, LMR, and immunoscore-based prognostic nomogram. A Cox proportional hazards model was applied in multivariable analyses using the forward-LR method with variables of a P<0.05 on univariate analysis, resulting in a four-feature-based nomogram to build an immunoscore-based prognostic nomogram. Calibration curves and time-dependent receiver operator characteristics curves were applied to evaluate the accuracy of the nomogram. In addition, the Harrell concordance index (C-index), net reclassification index (NRI) and integrated discrimination index (IDI) were applied to compare the performance of MI, LMR and immunoscore-based prognostic nomogram. All of the statistical analyses in the study were performed by using SPSS version 22.0 (IBM SPSS) and R software version 3.1.0 (complete details are provided in the Supplementary files). All statistical tests were two-sided, and P<0.05 was believed statistically significant.
Result
Patient characteristics
Seventy-eight percent of potentially relevant patients were included, as 20% were lost to follow up due to the changes of phone numbers and the unwillingness of patients or their families to cooperate. The study population consisted of a training cohort (n=217 patients; median follow-up: 86 months) and an external validation cohort (n=122 patients; median follow-up: 74 months) diagnosed with stage I NSCLC. Table S2 shows the baseline demographic characteristics of patients, tumors, and therapies for all stage I NSCLC patients.
Univariate and multivariate Cox analysis
A univariate survival analysis (Tables 1,S3) revealed that LMR, MI, and TNM stage were highly correlated with the DFS time and histology while LMR, MI, PLR, and TNM stage were highly correlated with the OS time. The results of the multivariate analysis indicated that LMR, MI, and TNM staging were independent prognostic factors for training cohort patients while histology, LMR, MI, and PLR were unrelated to the OS time.
Table 1. Univariate and multivariate Cox proportional hazards analysis for DFS in patients with stage I NSCLC of the training cohort.
| Factors | Number | DFS | ||||||
|---|---|---|---|---|---|---|---|---|
| Univariate analysis | Multivariate analysis | |||||||
| HR | 95% CI | P value | HR | 95% CI | P value | |||
| Age (years) | ||||||||
| <55 | 68 | 1.000 | ||||||
| ≥55 | 149 | 1.581 | 0.945–2.642 | 0.081 | ||||
| Sex | ||||||||
| Male | 144 | 1.000 | ||||||
| Female | 73 | 0.721 | 0.440–1.183 | 0.196 | ||||
| Surgery procedures | ||||||||
| Lobectomy | 183 | 1.000 | ||||||
| Sublobectomy | 34 | 1.357 | 0.774–2.378 | 0.287 | ||||
| TNM-stage | ||||||||
| IA | 89 | 1.000 | ||||||
| IB | 128 | 1.744 | 1.102–2.760 | 0.017 | 1.627 | 1.009–2.623 | 0.046 | |
| VPI | ||||||||
| No | 150 | 1.000 | ||||||
| Yes | 67 | 0.953 | 0.591–1.538 | 0.845 | ||||
| Smoking status | ||||||||
| No | 109 | 1.000 | ||||||
| Yes | 108 | 1.267 | 0.819–1.963 | 0.288 | ||||
| Histology | ||||||||
| Adeno | 136 | 1.000 | ||||||
| Non-adeno | 81 | 1.432 | 0.911–2.251 | 0.12 | ||||
| Macrophages immunoscore | ||||||||
| Low (score 0.1) | 132 | 1.000 | 1.000 | |||||
| Intermediate (score 2.3) | 57 | 5.115 | 2.997–8.732 | <0.001 | 4.451 | 2.583–7.670 | <0.001 | |
| High (score 4) | 28 | 13.938 | 7.714–25.184 | <0.001 | 10.965 | 5.742–20.939 | <0.001 | |
| CA153, U/mL | ||||||||
| ≤25 | 198 | 1.000 | ||||||
| >25 | 19 | 0.717 | 0.290–1.774 | 0.472 | ||||
| CEA, U/mL | ||||||||
| ≤5 | 135 | 1.000 | ||||||
| >5 | 82 | 0.961 | 0.610–1.516 | 0.865 | ||||
| NSE, U/mL | ||||||||
| ≤12.5 | 188 | 1.000 | ||||||
| >12.5 | 29 | 0.673 | 0.324–1.397 | 0.288 | ||||
| Lymphocytes | – | 0.762 | 0.561–1.033 | 0.080 | ||||
| Monocytes | – | 0.991 | 0.886–1.107 | 0.867 | ||||
| Neutrophils | – | 1.005 | 0.983–1.028 | 0.645 | ||||
| Platelets | – | 1.000 | 0.998–1.002 | 0.837 | ||||
| White blood cells | – | 0.992 | 0.934–1.050 | 0.746 | ||||
| LMR | ||||||||
| ≤3.6 | 52 | 1.000 | 1.000 | |||||
| >3.6 | 165 | 0.279 | 0.127–0.609 | 0.001 | 0.319 | 0.142–0.717 | 0.006 | |
| NMR | ||||||||
| ≤4.9 | 127 | 1.000 | ||||||
| >4.9 | 90 | 0.926 | 0.591–1.451 | 0.737 | ||||
| NLR | ||||||||
| ≤3.0 | 134 | 1.000 | ||||||
| >3.0 | 83 | 0.722 | 0.454–1.147 | 0.168 | ||||
| PLR | ||||||||
| ≤154.0 | 201 | 1.000 | ||||||
| >154.0 | 16 | 1.921 | 0.960–3.845 | 0.065 | ||||
CA153, carbohydrate antigen 153; CEA, carcinoembryonic antigen; NSE, neuron-specific enolase; LMR, lymphocyte-to-monocyte ratio; NLR, neutrocyte-to-lymphocyte ratio; NMR, neutrocyte-to-monocyte ratio; PLR, platelet-to-lymphocyte ratio.
The prognostic effect of MI
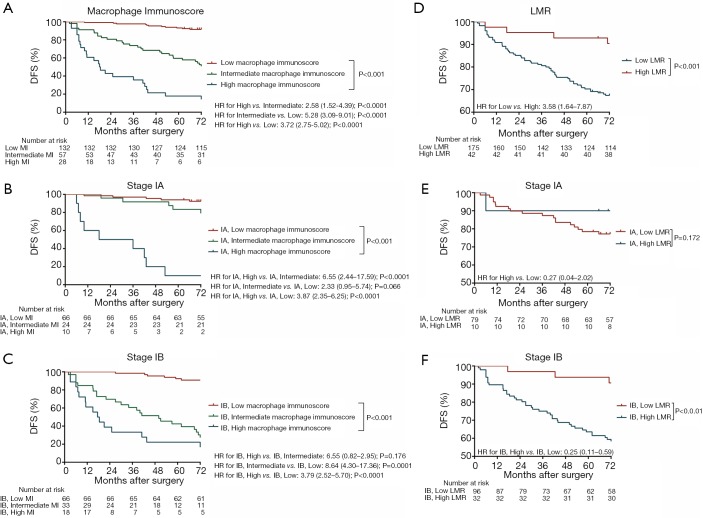
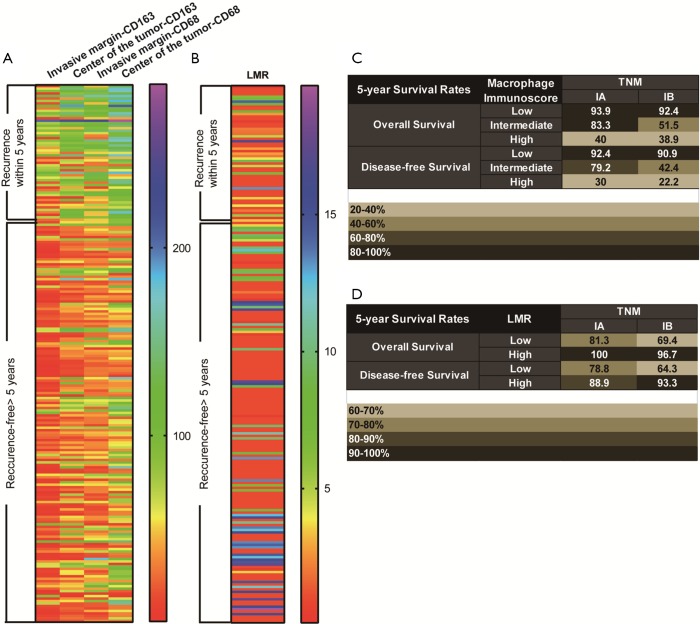
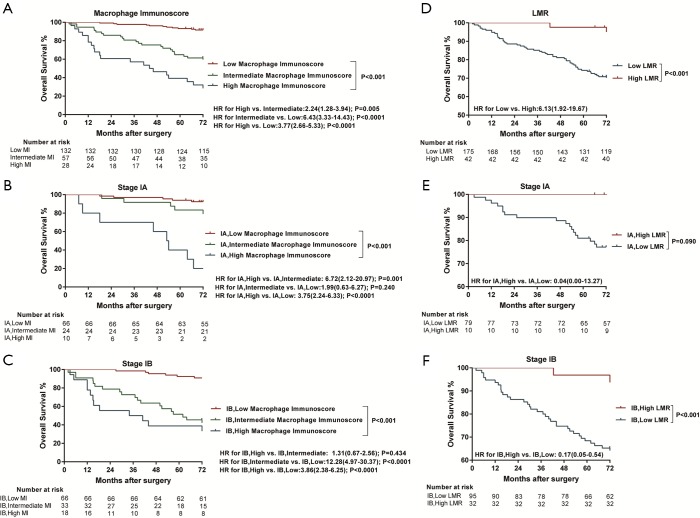
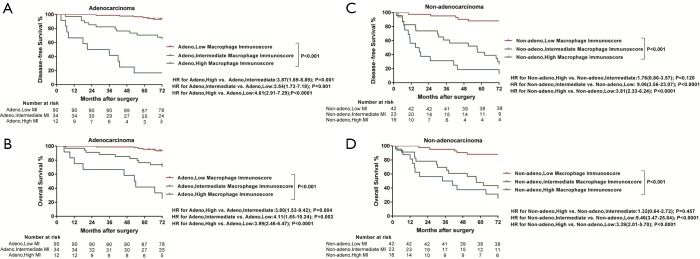
All images of tissue stained for CD68 and C163 of all included patients were analysed by four pathologists, and a strong interobserver reproducibility was found for the determination of mean cell densities (r=0.98 for the mean of all 2×2 correlations; all P<0.001; Figure S6). The relationship between the four IHC features (center of the tumor-CD68, invasive margin-CD68, center of the tumor-CD163 and invasive margin-CD163) and the recurrence-free time in the training cohort was illustrated in Figure S7. When the center of the tumor and invasive margin cell densities were considered together in the training cohort, groups of patients with a high MI differed significantly in both DFS and OS rates (P<0.001) from groups of patients with an intermediate MI and a low MI (Figures 2,S8). Similar survival results were obtained in the subgroup analysis of the same TNM stage (Figures 2,S8) and the same histological subtype (Figure S9), indicating that the low MI patients still had higher DFS and OS rates compared to patients with a high MI (P<0.001). Stage IB patients with a high MI had the lowest 5-year DFS rate (Figure S7C).
Figure 2.
Kaplan-Meier survival analysis of DFS according to the MI and LMR in the training cohort. (A) Kaplan-Meier curves for DFS according to the MI in the training cohort. (B) DFS according to the MI in the patients with stage IA of the training cohort. (C) DFS according to the MI in the patients with stage IB of the training cohort. (D) Kaplan-Meier curves for DFS according to the LMR in the training cohort. (E) DFS according to the LMR in patients with stage IA of the training cohort. (F) DFS according to the LMR in patients with stage IB of the training cohort. MI, macrophage immunoscore; LMR, lymphocyte-to-monocyte ratio.
The prognostic effect of LMR
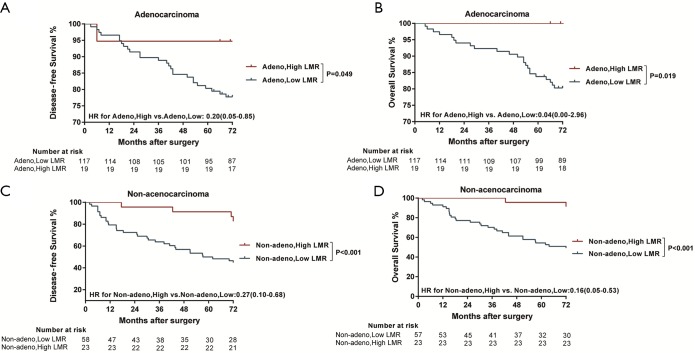
Significantly longer DFS and OS times were observed among high LMR patients compared to low LMR patients (P=0.0006 and P=0.0003, respectively) (Figures 2D,S8D). The relationship between the LMR and recurrence or nonrecurrence in the training cohort is shown in Figure S7D. High-LMR patients with stage IB disease had a better outcome in terms of DFS and OS rates (P=0.0006 and P=0.0008, respectively) (Figures 2F,S8F) compared to low-LMR patients with stage IB disease. However, in stage IA patients, no considerable differences were found between patient groups in DFS and OS rates (P=0.1716 and P=0.0904, respectively). Specifically, those with a high LMR did not have longer DFS and OS rates (P=0.1716) compared to those with a low LMR (P=0.0904) (Figures 2E,S8E). For patients with adenocarcinoma, high LMR group differed significantly from low LMR group in both DFS and OS rates (P=0.0485 and P=0.003, respectively) (Figure S10A,B). Similar result emerged for those with non-adenocarcinoma (P=0.0193 for DFS and P=0.0007 for OS) (Figure S10C,D).
The construction of the immunoscore-based prognostic nomogram
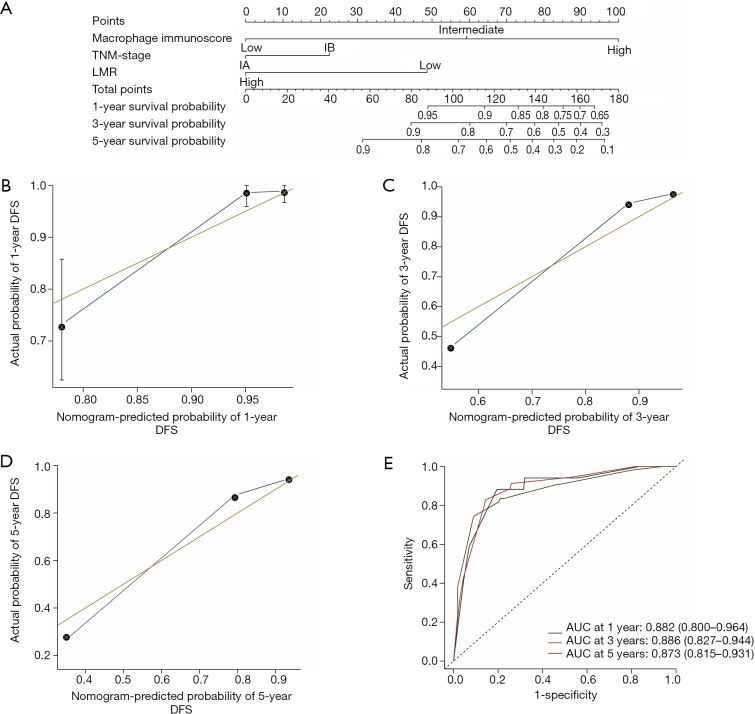
In univariate analysis, LMR, MI, and the TNM stage were greatly associated with DFS in the training cohort. As a result, LMR, MI, and TNM stage were used in the final nomogram model. We then derived an immunoscore-based prognostic nomogram according to the patients’ personalized levels of 4 IHC features (Figure 3A). The calibration curves for 1-, 3- and 5-year DFS also showed a high agreement between predicted survival probability and actual survival proportion (Figure 3B,C,D). Time-dependent receiver operator characteristics curves (Figure 3E) showed that the immunoscore-based prognostic nomogram had accurate predictive ability for 1-, 3- and 5-year DFS. We then classified patients into a high-immunoscore-based prognostic nomogram group (value: 148.66 to 170.09), an intermediate-immunoscore-based prognostic nomogram group (value: 81.73 to 130.39), and a low-immunoscore-based prognostic nomogram group (value: 0 to 71.10) by X-tile (Figure S6F). Across the two cohorts, 197 patients (58%) had a low immunoscore-based prognostic nomogram, 84 patients (25%) had an intermediate immunoscore-based prognostic nomogram, and 58 patients (17%) had a high immunoscore-based prognostic nomogram.
Figure 3.
Nomogram for predicting the risk of disease progression of stage I NSCLC patients in the training cohort. (A) The nomogram for predicting the probability of patients with 1-, 3-, and 5-year DFS. Lymphatic and Vascular Invasion is a combination of lymphatic invasion and vascular invasion, where the patients with both lymphatic and vascular invasion were divided into high Lymphatic and Vascular Invasion while the rest were divided into low Lymphatic and Vascular Invasion. (B) Calibration curve for a 1-year DFS nomogram model. The orange line represents an ideal nomogram, and the blue line represents the observed nomogram. Vertical bars indicate 95% confidence intervals (CIs), and crosses indicate bias-corrected estimates. (C) Calibration curve for a 3-year DFS nomogram model. The orange line represents an ideal nomogram, and the blue line represents the observed nomogram. Vertical bars indicate 95% CIs, and crosses indicate bias-corrected estimates. (D) Calibration curve for a 3-year DFS nomogram model. The orange line represents an ideal nomogram, and the blue line represents the observed nomogram. Vertical bars indicate 95% CIs, and crosses indicate bias-corrected estimates. (E) Time-dependent receiver operator characteristics curves by the nomogram for 1-, 3-, and 5-year DFS probability in the training cohort. AUC, the area under the curve of receiver operator characteristics; LMR, lymphocyte-to-monocyte ratio.
The prognostic effect of the immunoscore-based prognostic nomogram
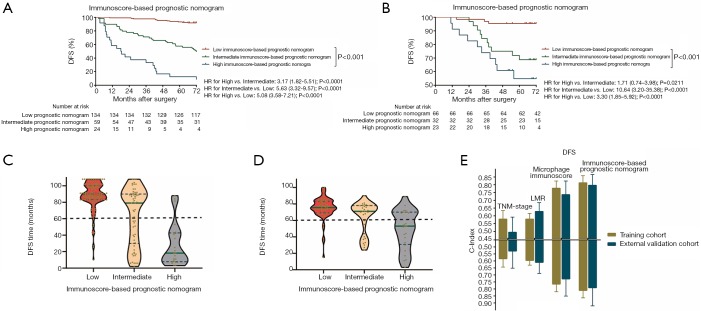
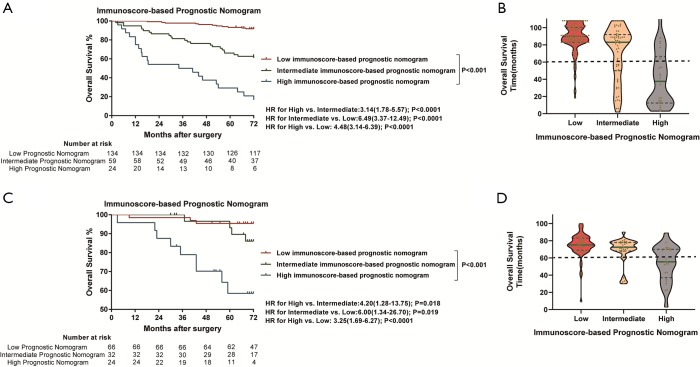
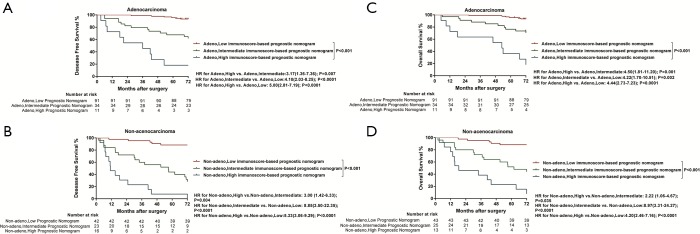
Kaplan-Meier survival curves confirmed an important difference in the DFS and OS rates among patients with the low-, intermediate-, and high-immunoscore-based prognostic nomogram in the training cohort (P<0.001) (Figures 4,S11). In the external validation cohort, patients with a high immunoscore-based prognostic nomogram still had the lowest DFS and OS rates (P<0.001) (Figure 4B). However, in the external validation cohort, no significant difference in the DFS rate was observed between groups of patients with a low immunoscore-based prognostic nomogram and those with an intermediate immunoscore-based prognostic nomogram (Figure 4B). In the stratified analysis of both training cohort (Figure S12) and external validation cohort (Figure S13), patients with the same histology subtype, the low immunoscore-based prognostic nomogram patients, still had higher DFS and OS rates compared to patients with a high immunoscore-based prognostic nomogram, except for the DFS rate in the external cohort with non-adenocarcinoma (Figure S13B).
Figure 4.
Kaplan-Meier survival analysis of DFS according to the Nomogram-based Prognostic Score in the training cohort and external validation cohort. (A) Kaplan-Meier curves for DFS according to the Nomogram-based Prognostic Score in the training cohort. (B) Kaplan-Meier curves for DFS according to the Nomogram-based Prognostic Score in the external validation cohort. (C) The green line is the median DFS time, and blue dotted lines represent the first and the third quartiles of patients’ DFS time in the training cohort. Violin-shaped shadows represent the actual distribution of individual Nomogram-based Prognostic Score subgroups’ DFS time. (D) The green line is the median DFS time, and blue dotted lines represent the first and the third quartiles of patients’ DFS time in the training cohort. Violin-shaped shadows represent the actual distribution of individual Nomogram-based Prognostic Score subgroups’ disease-free time. (E) The predictive accuracy based on Harrell C-index for TNM stage, LMR, macrophage immunoscore, and Nomogram-based Prognostic Score in the training cohort and external validation cohort. The vertical lines represent the standard deviation (SD) of C-Index values. All the P values are <0.001. LMR, lymphocyte-to-monocyte ratio; NRI, net reclassification improvement; IDI, integrated discrimination improvement.
Accordingly, the violin plots demonstrated differences in the probability distribution of the DFS time in patients with a low immunoscore-based prognostic nomogram, intermediate immunoscore-based prognostic nomogram, and high immunoscore-based prognostic nomogram for both the training cohort and external validation cohort (Figure 4C,D). Obviously, the low-group had a more intensive distribution with a longer DFS time (less than 60 months), followed by the intermediate- and high- groups. This kind of difference also existed for the OS time (Figure S11C,D).
The improvement of the immunoscore-based prognostic nomogram in predictive accuracy
When comparing the C-index, we found that the immunoscore-based prognostic nomogram had the best predictive accuracy for both the DFS and OS times. In terms of the DFS time, the C-index of the immunoscore-based prognostic nomogram was 0.812 (P<0.001) for the training cohort and 0.796 (P<0.001) for the external validation cohort. On the other hand, in predicting the OS time, the C-index of the immunoscore-based prognostic nomogram prognosis model was 0.810 (P<0.001) for the training cohort and 0.791 (P<0.001) for the external validation cohort (Figure 4E). Compared with the MI alone, the immunoscore-based prognostic nomogram improved the prediction accuracy regarding the NRI [0.463 (0.398–0.628), P=0.01; Table 2) and IDI [0.087 (0.024–0.147), P=0.01; Table 2] at 5 years. It also proved that the immunoscore-based prognostic nomogram offered meaningful improvement for an individualized DFS time prediction compared with the LMR alone [NRI, 0.235 (0.129–0.644), P<0.001; IDI, 0.266 (0.167–0.364), P<0.001; Table 2] and TNM stage alone [NRI, 0.445 (0.334–0.648), P<0.001; IDI, 0.298 (0.192–0.401); P<0.001; Table 2]. All the above results were also included in the OS time (Table 3). Thus, the immunoscore-based prognostic nomogram was superior to LMR, MI, or TNM stage alone in predicting the DFS and OS times.
Table 2. The improvement of immunoscore-based prognostic nomogram in predicting DFS according to NRI and IDI.
| DFS | Immunoscore-based prognostic nomogram vs. MI |
Immunoscore-based prognostic nomogram vs. TNM stage |
Immunoscore-based prognostic nomogram vs. LMR |
|||||||||||
|---|---|---|---|---|---|---|---|---|---|---|---|---|---|---|
| NRI (95%CI) | P | IDI (95%CI) | P | NRI (95%CI) | P | IDI (95%CI) | P | NRI (95%CI) | P | IDI (95%CI) | P | |||
| 1-year | 0.646 (0.404–0.799) |
0.004 | 0.031 (0.002–0.071) |
0.042 | 0.567 (0.364–0.712) |
<0.001 | 0.110 (0.062–0.181) |
<0.001 | 0.611 (0.266–0.761) |
<0.001 | 0.106 (0.061–0.176) |
<0.001 | ||
| 3-year | 0.458 (0.311–0.607) |
0.006 | 0.054 (0.005–0.112) |
0.028 | 0.476 (0.337–0.633) |
<0.001 | 0.203 (0.120–0.293) |
<0.001 | 0.467 (0.116–0.612) |
<0.001 | 0.190 (0.117–0.277) |
<0.001 | ||
| 5-year | 0.463 (0.398–0.628) |
0.01 | 0.087 (0.024–0.147) |
0.01 | 0.445 (0.334–0.648) |
<0.001 | 0.298 (0.192–0.399) |
<0.001 | 0.235 (0.129–0.644) |
<0.001 | 0.266 (0.167–0.364) |
<0.001 | ||
LMR, lymphocyte-to-monocyte ratio; NRI, net reclassification improvement; IDI, integrated discrimination improvement.
Table 3. The improvement of immunoscore-based prognostic nomogram in predicting OS according to NRI and IDI.
| OS | Immunoscore-based prognostic nomogram vs. MI |
Immunoscore-based prognostic nomogram vs. TNM stage |
Immunoscore-based prognostic nomogram vs. LMR |
|||||||||||
|---|---|---|---|---|---|---|---|---|---|---|---|---|---|---|
| NRI (95%CI) | P | IDI (95%CI) | P | NRI (95%CI) | P | IDI (95%CI) | P | NRI (95%CI) | P | IDI (95%CI) | P | |||
| 1-year | 0.500 (0.187–0.761) |
<0.001 | 0.021 (0.005–0.052) |
<0.001 | 0.370 (0.057–0.643) |
0.02 | 0.055 (0.018–0.121) |
<0.001 | 0.399 (0.089–0.676) |
<0.001 | 0.054 (0.022–0.115) |
<0.001 | ||
| 3-year | 0.597 (0.417–0.740) |
<0.001 | 0.077 (0.037–0.136) |
<0.001 | 0.531 (0.384–0.666) |
<0.001 | 0.173 (0.098–0.260) |
<0.001 | 0.366 (0.199–0.634) |
<0.001 | 0.164 (0.099–0.259) |
<0.001 | ||
| 5-year | 0.493 (0.389–0.616) |
<0.001 | 0.106 (0.057–0.169) |
<0.001 | 0.404 (0.274–0.535) |
<0.001 | 0.249 (0.145–0.363) |
<0.001 | 0.255 (0.122–0.515) |
<0.001 | 0.226 (0.131–0.335) |
<0.001 | ||
LMR, lymphocyte-to-monocyte ratio; NRI, net reclassification improvement; IDI, integrated discrimination improvement.
Discussion
Even patients with early NSCLC who have experienced a complete surgical resection may face a significant risk of recurrence and death. Therefore, the establishment of reliable biomarkers is of great value in screening patients who may benefit from supernumerary adjuvant therapy to reduce the risk of recurrence. In our study, we created and proved a novel prognostic tool based on the expression of biological markers combined with clinical risk factors. This new scoring system, the immunoscore-based prognostic nomogram, improves the ability to predict survival outcomes in stage I NSCLC patients. It includes the MI, which is dependent on the density and distribution of the TAMs, LMR in routine preoperative blood testing, and the TNM stage. Meanwhile, the C-index, NRI, and IDI at 5 years all showed superior predictive accuracy of the immunoscore-based prognostic nomogram compared with these four features.
Monocytes play the role in secreting a series of chemokines and cytokines in the tumor micro-environment, which is beneficial for tumor progression and metastasis (13). Conversely, lymphocytes play a crucial role in tumor suppression by inducing the death of the cytotoxic cell and producing anticancer cytokines that prohibit (14). Therefore, to analyze the joint effects of lymphocytes and monocytes, the LMR can be utilized broadly in clinical fields to show the integrated predictive information of these two processes and also to reflect systemic inflammation (15) detected easily in plasma or serum (16). Besides the host cells, the host micro-environment is also an indispensable contributor to cancer progression and metastasis, and it may be turned into a promising target for anticancer therapeutics (17). Cancer cells activate macrophages and other host stromal cells in the TME, like fibroblasts and vascular endothelial cells, to bring about malignant tumors (18). This indicates that a positive association between tumor cells and TAMs stimulates malignancy. Although a recent meta-analysis (19) found that the density of total CD68+ TAMs which was accepted as a pan-marker for all macrophages phenotypes in the tumor islet and stroma was not associated with OS of the NSCLC patients, how CD68+ CD163+ M2 TAMs were associated with the poor DFS and OS in stage I NSCLC hasn’t been validated clearly. However, the exact process during which TAMs facilitate malignancy remains generally unknown.
According to this study, the immunoscore-based prognostic nomogram may provide an appropriate tool for pretreatment stratification of patients and posttrial evaluation. Although the application of adjuvant therapy and immunotherapy in stage I NSCLC remains controversial (20), proposing a new method for screening patients for chemotherapy and immunotherapy seems to reverse this situation (21). The strong prognostic value of the immunoscore-based prognostic nomogram and its association with TAMs (22) indicated that the immunoscore-based prognostic nomogram could be applied to select patients with the stage I NSCLC who remain at the highest risk of recurrence and who might achieve a better survival after receiving additional systemic therapy. This may improve the prognosis of stage I NSCLC patients.
Meanwhile, the immunoscore-based prognostic nomogram has greater clinical potential compared to any other single biological marker. Many biological markers, prognostic signatures, and methods have been described to evaluate the prognosis of NSCLC patients (23), such as CD8 (24), CD3 (25), CD20 (26), PD1 (27), PD-L1 (27), DC (28), FoxP3/CD3 ratio (29), CD4 (30), CD25 (31), CD117 (31), and CD138 (31). Few of these markers and laboratory assays have been converted into clinical routines. One meta-analysis found that the density of total CD68+ TAMs in the tumor islet and stroma was not associated with OS of the NSCLC patients. Our study defined M2 TAMs equal to CD68+ CD163+ cells, and confirmed CD68+ CD163+ M2 TAM density was correlated with survival, while high invasive margin and high central tumor CD68+ TAMs were both associated with poor DFS and OS. In this meta-analysis, the differences in tumor stages between the high and low TAM density groups may be a confounding factor for the observation of OS, and our study focuses on stage I patients. In short, the key features of the immunoscore-based prognostic nomogram indicate that it could have a wide clinical implementation in the future. Specifically, it is easy to perform as part of preoperative blood testing and postoperative pathological examinations. It is economically feasible, for its calculations are precise, its results can be obtained rapidly, and its values for predicting postoperative survival time and assisting with clinical work are powerful and readily reproducible.
The present study has several limitations that need to be pointed out. First, the selection bias and missing variables are an inevitable defect of retrospective research. Second, differences in the size of different hospitals and the number of electronic medical records led to the variance in included numbers between the two cohorts. However, we strictly ensure that the inclusion criteria of the two cohorts are consistent. Third, it is regrettable that due to limitations of pathological records, the lymphatic or vascular invasion was missing in this study. it is not until 2012 that the information of lymphatic and vascular invasion was documented in the database. Fourth, 15% of the included patients received sublobectomy without lymph node sampling or dissection, who might have been understaged as stage I. Fifth, the cut-off points for all prognostic factors were decided according to the DFS time, as in other studies (32), which is why the predictions of the OS time for all factors were not as accurate as those for the DFS time. Sixth, as shown in the violin plots, for the high immunoscore-based prognostic nomogram groups, the distribution of survival was relatively scattered, containing obvious discrete values, whereas the survival distribution was more concentrated in the low- and intermediate-immunoscore-based prognostic nomogram group. This limitation may be attributable to the low number of high-immunoscore-based prognostic nomograms in our stage I NSCLC cohorts. To optimize the immunoscore-based prognostic nomogram, we may have to include more patients in the future. However, the immunoscore-based prognostic nomogram lacks a flexible structure that provides the most up-to-date prediction that is possible. Lastly, the stratification of the immunoscore-based prognostic nomogram for additional systemic treatments, such as chemotherapy and immunotherapy, needs to be confirmed in more prospective studies in the upcoming years.
Conclusions
In conclusion, MI and LMR along with the TNM stage were unrelated prognostic elements of the OS and DFS times in patients with stage I NSCLC. Moreover, the immunoscore-based prognostic nomogram can be an effective and robust prognostic stratification method for individualized predictions of the DFS and OS times in stage I NSCLC patients. As such, it can play a significant role in the classification of NSCLCs. More prospective studies are required to further confirm its accuracy in assessing the prognosis of NSCLC patients and guiding the development of the individualized treatment.
Supplementary
The article’s supplementary files as
Acknowledgments
We thank Servicescape (https://www.servicescape.com/) for its linguistic assistance during the preparation of this manuscript.
Funding: The work was supported by the Shanghai Pulmonary Hospital Innovation Team (fkcx1906).
Supplementary
Methods
Patients
In order to measure DFS time more accurately, all the patients selected in this study reviewed the pulmonary CT and blood routines every three months within the first year after surgery, every 6 months in the second year after surgery, and once a year lifelong.
Histopathologic analysis
All the hematoxylin and eosin (H&E) sections of included patients were examined by pathologists for evaluation of TNM stage, tumor differentiation, presence of tumor emboli in vascular, lymphatic, or perineural structures, and the quality of resection. It should be noted that there are 6 patients with Tis in the training cohort, while 22 patients with Tis in the external validation cohort. Considering that the number of these patients with Tis is too small, we put Tis into T1a together as Tis-T1a.
IHC and scoring
IHC assays for CD68 and CD163 were performed on primary surgical specimen using standard indirect immunoperoxidase protocols (33). Briefly, embedded tumor tissues were sectioned to 3-µm thickness, deparaffinized twice with xylene and rehydrated in a graded series of ethanol. Heat-mediated antigen retrieval in citrate buffer was performed followed by 3% hydrogen peroxide. After blocked with serum, sections were incubated with indicated primary antibodies at appropriate dilution at 4 °C overnight. The information of primary antibodies used in IHC was EPR19518 and KP1. The next day, the sections were incubated with second antibodies for 30 min at room temperature and visualized by staining with the DAB system, then counterstained with hematoxylin, dehydrated, and coverslipped (34).
For the evaluation of IHC assays, all specimens were examined independently by four experienced pathologists in a blinded manner. Semiquantitative analyses of TAMs were performed on full slides, and the results were calculated as cell densities. The staining was firstly evaluated according to overall impression at low microscopic magnification (×100) and calculated as the mean value of five random field at higher magnification (×200).
Assessment of the systemic inflammatory response
Pre-operative serum white blood cells count, platelets count, and differential white cell count including neutrophils, monocytes and lymphocytes were measured within 1 week prior to surgery as routine and recorded prospectively. The cut-off values of these cell count and the ratio between them including PLR, LMR, NLR, and NMR were decided in the same way with cell densities. Also, serum tumor markers such as CA153, CEA and NSE were also included, whose cut-off values are normal values. The systemic inflammatory response was measured using LMR and NLR, NMR and PLR as previously described.
Tissue microarray construction, staining, and analysis
It is known that immune cells are scattered in the core of the tumor (CT) within the tumor stroma and the tumor glands, in the invasive margin (IM) and in organized lymphoid follicles distant from the tumor. Further, the combined analysis of tumor regions (CT plus IM) improved the accuracy of prediction of survival for the different patient groups compared with single-region analysis (35). Given the major clinical importance of distinct tumor regions, it is appropriate to conduct immune cell infiltration evaluation systematically in the two separate areas, CT and IM (36). For routine practice, this requires immune cell evaluation on whole-tissue sections, taking into account their location.
For tissue samples harvested on surgical specimens, two cores were taken from CT and two cores from IM for tissue microarray (TMA) construction as previously described. Slides immunostained for CD68 and CD163 (EPR19518 and KP1, respectively; Neomarkers) were quantified using Image J software. Meanwhile, the optimum cutoff score of each feature except the serum tumor markers as mentioned above was selected on the basis of the association with the patients’ DFS by using X-tile software (version 3.6.1). Accordingly, the cutoff values determined for CD68+ and CD163+ cell densities were 116 and 84 cells/mm2 in the CT and 96 and 64 cells/mm2 in the IM, respectively.
Figure S1.
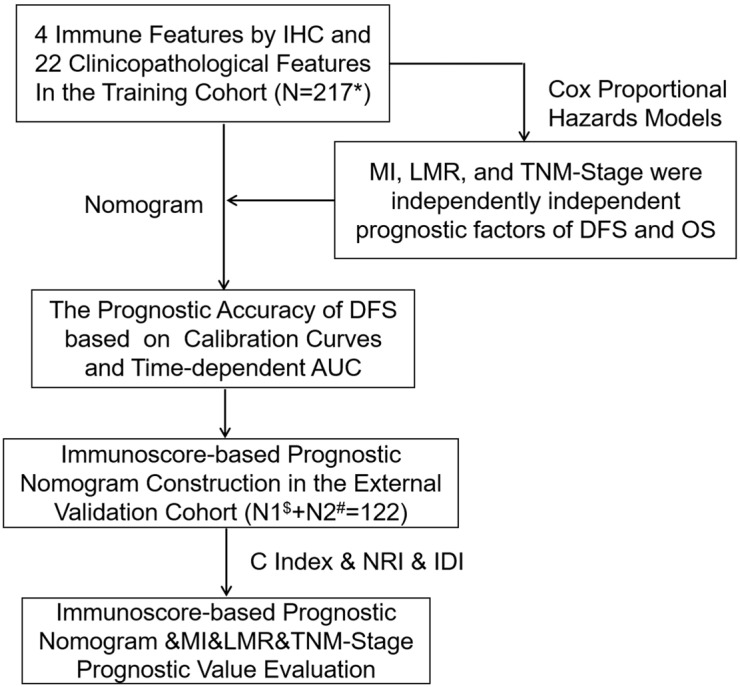
Study design. *, stage I NSCLC patients at Shanghai Pulmonary Hospital; $, stage I NSCLC patients at Affiliated Zhuzhou Hospital of Xiangya School of Medicine of CSU; #, stage I NSCLC patients at the Hwa Mei Hospital, University of Chinese Academy of Science (Ningbo No. 2 Hospital).
Figure S2.
Representative immunohistochemistry images. The 3 IHC features were stained brown and detected in the invasive margin (IM) and center of tumor (CT). Bar, 100 µm.
Figure S3.
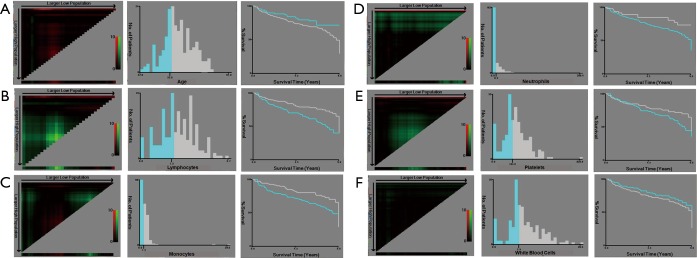
X-tile analysis of the prognostic significance of age (A), lymphocytes (B), monocytes (C), neutrophils (D), platelets (E) and white blood cells (F) in the training cohort. Coloration of the plot representing the strength of the association at each division were shown in the left panels, ranging from low (dark, black) to high (bright, red or green). Red represents the inverse association between the expression levels and survival of the feature, whereas green represents a direct association. The optimal cut-off points were shown in a histogram (middle panels) and a Kaplan-Maier plot (right panels). The optimal cut-off points were defined by the most significant base in the X-tile analysis.
Figure S4.
X-tile analysis of the prognostic significance of LMR (A), NLR (B), PLR (C), and NMR (D) in the training cohort. Coloration of the plot representing the strength of the association at each division were shown in the left panels, ranging from low (dark, black) to high (bright, red or green). Red represents the inverse association between the expression levels and survival of the feature, whereas green represents a direct association. The optimal cut-off points were shown in a histogram (middle panels) and a Kaplan-Maier plot (right panels). The optimal cut-off points were defined by the most significant base in the X-tile analysis. LMR, lymphocyte-to-monocyte ratio; NLR, neutrocyte-to-lymphocyte ratio; NMR, neu-trachyte-to-monocyte ratio; PLR, platelet-to-lymphocyte ratio.
Figure S5.
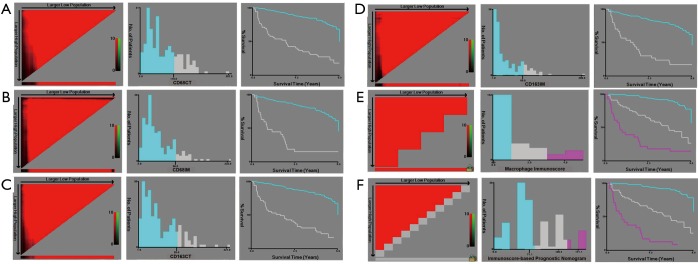
X-tile analysis of the prognostic significance of CD68CT (A), CD68IM (B), CD163CT (C), CD163IM (D), macrophage immunoscore (E) and total macrophage immunoscore (F) in the training cohort. Coloration of the plot representing the strength of the association at each division were shown in the left panels, ranging from low (dark, black) to high (bright, red or green). Red represents the inverse association between the expression levels and survival of the feature, whereas green represents a direct association. The optimal cut-off points were shown in a histogram (middle panels) and a Kaplan-Maier plot (right panels). The optimal cut-off points were defined by the most significant base in the X-tile analysis.
Figure S6.
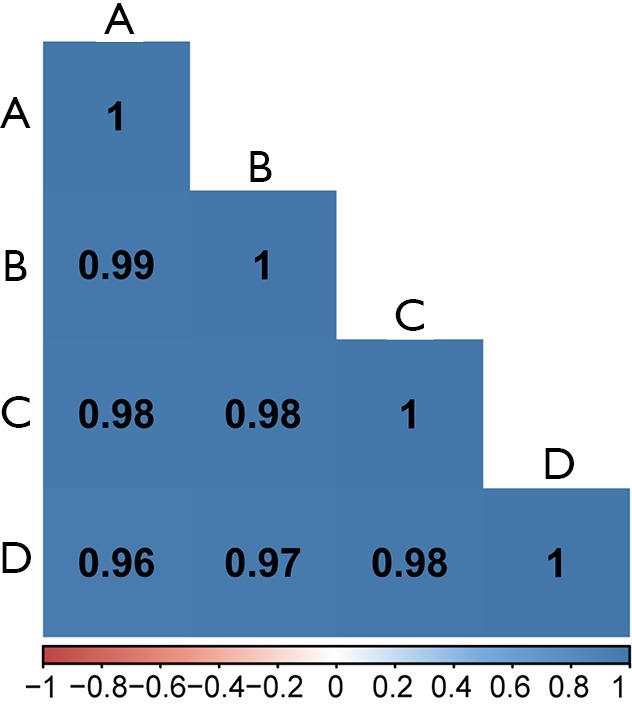
Correlation matrix of CD68+ and CD163+ cell counting in all slides from 4 pathologists. Correlation matrix illustrating the reproducibility of the CD68+ and CD163+ cell counting in all included slides with stage I NSCLC tumor sections by four pathologists (tagged A to D). The mean of all 2×2 correlations between the four pathologists doing digital pathology is r=0.98.
Figure S7.
Heat maps and 5-year survival rates of IHC features and LMR. (A) Heat map of the classification of 5-year recurrence based on the 4 IHC features in the training cohort. (B) Heat map of the classification of 5-year recurrence based on the LMR in the training cohort. (C) 5-year overall survival rates and disease-free survival rates in a TNM-macrophage immunoscore classification. (D) 5-year overall survival rates and disease-free survival rates in a TNM-LMR classification. LMR, lymphocyte-to-monocyte ratio.
Figure S8.
Kaplan-Meier survival analysis of overall survival according to the macrophages immunoscore and LMR. (A) Kaplan-Meier curves for overall survival according to the MI in the training cohort. (B) Overall survival according to the MI in the patients with stage IA of the training cohort. (C) Overall survival according to the MI in the patients with stage IB of the training cohort. (D) Kaplan-Meier curves for overall survival according to the LMR in the training cohort. (E) Overall survival according to the LMR in the patients with stage IA of the training cohort. (F) Overall survival according to the LMR in the patients with stage IB of the training cohort. MI, macrophage immunoscore; LMR, lymphocyte-to-monocyte ratio.
Figure S9.
Kaplan-Meier survival analysis of disease-free survival time and overall survival according to the MI and histology. (A) Kaplan-Meier curves for disease-free survival according to the MI of patients with adenocarcinoma in the training cohort. (B) Kaplan-Meier curves for overall survival according to the MI of patients with adenocarcinoma in the training cohort. (C) Kaplan-Meier curves for disease-free survival according to the MI of patients with non-adenocarcinoma in the training cohort. (D) Kaplan-Meier curves for overall survival according to the MI of patients with non-adenocarcinoma in the training cohort. MI, macrophage immunoscore.
Figure S10.
Kaplan-Meier survival analysis of disease-free survival time and overall survival according to the MI and histology. (A) Kaplan-Meier curves for disease-free survival according to the MI of patients with adenocarcinoma in the training cohort. (B) Kaplan-Meier curves for overall survival according to the MI of patients with adenocarcinoma in the training cohort. (C) Kaplan-Meier curves for disease-free survival according to the MI of patients with non-adenocarcinoma in the training cohort. (D) Kaplan-Meier curves for overall survival according to the MI of patients with non-adenocarcinoma in the training cohort. MI, macrophage immunoscore.
Figure S11.
Kaplan-Meier survival analysis and violin plots of overall survival time according to the immunoscore-based prognostic nomogram. (A) Kaplan-Meier curves for overall survival according to the immunoscore-based prognostic nomogram in the training cohort. (B) The green line is the median overall survival time, and blue dotted lines represent the first and third quartiles of patients’ overall survival time in the training cohort. Violin shape shadows represent the actual distribution of individual immunoscore-based prognostic nomogram subgroups’ overall survival time. (C) Kaplan-Meier curves for overall survival according to the immunoscore-based prognostic nomogram in the external validation cohort. (D) The green line is the median overall survival time, and blue dotted lines represents the first and third quartiles of patients’ overall survival time in the training cohort. Violin shape shadows represent the actual distribution of individual immunoscore-based prognostic nomogram subgroups’ overall survival time.
Figure S12.
Kaplan-Meier survival analysis of disease-free survival time and overall survival according to the immunoscore-based prognostic nomogram and histology in the training cohort. (A) Kaplan-Meier curves for disease-free survival according to the immunoscore-based prognostic nomogram of the training cohort with adenocarcinoma. (B) Kaplan-Meier curves for disease-free survival according to the immunoscore-based prognostic nomogram of the training cohort with non-adenocarcinoma. (C) Kaplan-Meier curves for overall survival according to the immunoscore-based prognostic nomogram of the training cohort with adenocarcinoma. (D) Kaplan-Meier curves for overall survival according to the immunoscore-based prognostic nomogram of the training cohort with non-adenocarcinoma.
Figure S13.
Kaplan-Meier survival analysis of disease-free survival time and overall survival according to the immunoscore-based prognostic nomogram and histology in the external validation cohort. (A) Kaplan-Meier curves for disease-free survival according to the immunoscore-based prognostic nomogram of the external validation cohort with adenocarcinoma. (B) Kaplan-Meier curves for disease-free survival according to the immunoscore-based prognostic nomogram of the external validation cohort with non-adenocarcinoma. (C) Kaplan-Meier curves for overall survival according to the immunoscore-based prognostic nomogram of the external validation cohort with adenocarcinoma. (D) Kaplan-Meier curves for overall survival according to the immunoscore-based prognostic nomogram of the external validation cohort with non-adenocarcinoma.
Table S1. Statistical characteristics of included continuous variables of the training cohort.
| Continuous variables | Range | Average value | Cut-off value |
|---|---|---|---|
| Age (years) | 37–91 | 59 | 55 |
| Center of the tumor-CD68 (cell numbers/mm2) | 5–287 | 74.7 | 116 |
| Invasive margin-CD68 (cell numbers/mm2) | 3–232 | 48.8 | 96 |
| Center of the tumor-CD163 (cell numbers/mm2) | 1–221 | 50.4 | 85 |
| Invasive margin-CD163 (cell numbers/mm2) | 1–109 | 27.8 | 46 |
| CA153, U/mL | 0–68.74 | 5.03 | – |
| CEA, U/mL | 0–90.34 | 4.1 | – |
| NSE, U/mL | 0–102.96 | 10.5 | – |
| White blood cells (×109/L) | 0–20.5 | 7.1 | – |
| Platelets (×109/L) | 0–828.9 | 211.5 | – |
| Monocytes (×109/L) | 0–29.0 | 1.4 | – |
| Lymphocytes (×109/L) | 0–3.7 | 1.6 | – |
| Neutrophils (×109/L) | 0–206.4 | 7.1 | – |
| LMR | 0.1–8.9 | 2.4 | 3.6 |
| NLR | 0–9.6 | 1.3 | 3.0 |
| NMR | 0.1–58.0 | 6.3 | 4.9 |
| PLR | 0–427.0 | 186.6 | 154.0 |
CA153, carbohydrate antigen 153; CEA, carcinoembryonic antigen; NSE, neuron-specific enolase; LMR, lymphocyte-to-monocyte ratio; NLR, neutrocyte-to-lymphocyte ratio; NMR, neutrocyte-to-monocyte ratio; PLR, platelet-to-lymphocyte ratio.
Table S2. Clinical characteristics of patients in the training cohort and the external validation cohort.
| Variables | Training cohort (n=217) | External validation cohort (n=122) | P |
|---|---|---|---|
| Sex | 0.010 | ||
| Male | 144 | 97 | |
| Female | 73 | 25 | |
| Age, years | 0.139 | ||
| <55 | 68 | 29 | |
| ≥55 | 149 | 93 | |
| Surgery procedures | 0.668 | ||
| Lobectomy | 183 | 105 | |
| Sublobectomy | 34 | 17 | |
| TNM-stage | <0.001 | ||
| IA | 89 | 82 | |
| IB | 128 | 40 | |
| VPI | 0.025 | ||
| No | 150 | 98 | |
| Yes | 67 | 24 | |
| Smoking status | 0.353 | ||
| No | 109 | 56 | |
| Yes | 108 | 66 | |
| Histology | 0.011 | ||
| Adeno | 136 | 93 | |
| Non-adeno | 81 | 29 | |
| CA153, U/mL | 0.740 | ||
| ≤25 | 198 | 110 | |
| >25 | 19 | 12 | |
| CEA, U/mL | 0.091 | ||
| ≤5 | 135 | 87 | |
| >5 | 82 | 35 | |
| NSE, U/mL | 0.948 | ||
| ≤12.5 | 188 | 106 | |
| >12.5 | 29 | 16 | |
| Lymphocytes | 0.798 | ||
| Monocytes | 0.426 | ||
| Neutrophils | <0.001 | ||
| Platelets | 0.406 | ||
| White blood cells | 0.465 | ||
| LMR | 0.050 | ||
| ≤3.6 | 178 | 89 | |
| >3.6 | 39 | 33 | |
| NMR | 0.004 | ||
| ≤4.9 | 127 | 91 | |
| >4.9 | 90 | 31 | |
| NLR | 0.016 | ||
| ≤3.0 | 134 | 91 | |
| >3.0 | 83 | 31 | |
| PLR | 0.083 | ||
| ≤154.0 | 201 | 106 | |
| >154.0 | 16 | 16 |
CA153, carbohydrate antigen 153; CEA, carcinoembryonic antigen; NSE, neuron-specific enolase; LMR, lymphocyte-to-monocyte ratio; NLR, neutrocyte-to-lymphocyte ratio; NMR, neutrocyte-to-monocyte ratio; PLR, platelet-to-lymphocyte ratio.
Table S3. Univariate and multivariate Cox proportional hazards analysis for overall survival in patients with stage I NSCLC of the training cohort.
| Factor | Number | Overall survival | ||||||
|---|---|---|---|---|---|---|---|---|
| Univariate analysis | Multivariate analysis | |||||||
| HR | 95% CI | P | HR | 95% CI | P | |||
| Age (years) | ||||||||
| <55 | 68 | 1.000 | 0.425 | |||||
| ≥55 | 149 | 1.254 | 0.719–2.188 | |||||
| Sex | ||||||||
| Male | 144 | 1.000 | 0.057 | |||||
| Female | 73 | 0.569 | 0.318–1.016 | |||||
| Surgery procedures | ||||||||
| Lobectomy | 183 | 1.000 | ||||||
| Sublobectomy | 34 | 1.235 | 0.644–2.368 | 0.524 | ||||
| TNM-stage | ||||||||
| IA | 89 | 1.000 | 0.010 | 1.000 | 0.560 | |||
| IB | 128 | 2.008 | 1.181–3.416 | 1.194 | 0.658–2.165 | |||
| VPI | ||||||||
| No | 150 | 1.000 | ||||||
| Yes | 67 | 0.821 | 0.471–1.433 | 0.489 | ||||
| Smoke | ||||||||
| No | 109 | 1.000 | ||||||
| Yes | 108 | 1.257 | 0.766–2.063 | 0.366 | ||||
| Histology | ||||||||
| Adeno | 136 | 1.000 | 0.001 | 1.000 | ||||
| Non-adeno | 81 | 2.346 | 1.421–3.874 | 2.427 | 1.436–4.102 | 0.001 | ||
| Macrophages immunoscore | ||||||||
| Low (score 0.1) | 132 | 1.000 | <0.001 | 1.000 | ||||
| Intermediate (score 2.3) | 57 | 6.372 | 3.298–12.312 | 4.914 | 2.523–9.570 | <0.001 | ||
| High (score 4) | 28 | 14.563 | 7.299–29.055 | <0.001 | 9.031 | 4.284–19.038 | <0.001 | |
| CA153, U/mL | ||||||||
| ≤25 | 198 | 1.000 | 0.850 | |||||
| >25 | 19 | 0.915 | 0.367–2.284 | |||||
| CEA, U/mL | ||||||||
| ≤5 | 135 | 1.000 | 0.858 | |||||
| >5 | 82 | 1.048 | 0.630–1.744 | |||||
| NSE, U/mL | ||||||||
| ≤12.5 | 188 | 1.000 | 0.191 | |||||
| >12.5 | 29 | 0.543 | 0.218–1.355 | |||||
| Lymphocytes | 0.793 | 0.563–1.116 | 0.183 | |||||
| Monocytes | 1.011 | 0.917–1.114 | 0.830 | |||||
| Neutrophils | 1.012 | 0.991–1.034 | 0.266 | |||||
| Platelets | 1.001 | 0.999–1.003 | 0.501 | |||||
| White blood cells | 0.972 | 0.910–1.040 | 0.412 | |||||
| LMR | ||||||||
| ≤3.6 | 52 | 1.000 | 0.002 | 1.000 | ||||
| >3.6 | 165 | 0.163 | 0.051–0.522 | 0.173 | 0.053–0.570 | 0.004 | ||
| NMR | ||||||||
| ≤4.9 | 127 | 1.000 | 0.384 | |||||
| >4.9 | 90 | 0.796 | 0.476–1.330 | |||||
| NLR | ||||||||
| ≤3.0 | 134 | 1.000 | 0.398 | |||||
| >3.0 | 83 | 0.799 | 0.475–1.344 | |||||
| PLR | ||||||||
| ≤154.0 | 201 | 1.000 | 0.009 | 1.000 | ||||
| >154.0 | 16 | 2.569 | 1.269–5.209 | 1.428 | 0.659–3.095 | 0.366 | ||
Ethical Statement: The authors are accountable for all aspects of the work in ensuring that questions related to the accuracy or integrity of any part of the work are appropriately investigated and resolved. The study was endorsed by the Ethics Committee of Tongji University, University of Chinese Academy of Sciences, and Xiangya School of Medicine of CSU. Written informed consent was obtained from all patients.
Footnotes
Conflicts of Interest: All authors have completed the ICMJE uniform disclosure form (available at http://dx.doi.org/10.21037/atm.2020.03.113). The authors have no conflicts of interest to declare.
References
- 1.Wang BY, Huang JY, Lin CH, et al. Thoracoscopic Lobectomy Produces Long-Term Survival Similar to That with Open Lobectomy in Cases of Non-Small Cell Lung Carcinoma: A Propensity-Matched Analysis Using a Population-Based Cancer Registry. J Thorac Oncol 2016;11:1326-34. 10.1016/j.jtho.2016.04.032 [DOI] [PubMed] [Google Scholar]
- 2.Burotto M, Thomas A, Subramaniam D, et al. Biomarkers in early-stage non-small cell lung cancer: current concepts and future directions. J Thorac Oncol 2014;9:1609-17. 10.1097/JTO.0000000000000302 [DOI] [PMC free article] [PubMed] [Google Scholar]
- 3.De Palma M, Biziato D, Petrova TV. Microenvironmental regulation of tumour angiogenesis. Nat Rev Cancer 2017;17:457-74. 10.1038/nrc.2017.51 [DOI] [PubMed] [Google Scholar]
- 4.Mills CD, Ley K. M1 and M2 macrophages: the chicken and the egg of immunity. J Innate Immun 2014;6:716-26. 10.1159/000364945 [DOI] [PMC free article] [PubMed] [Google Scholar]
- 5.Pelekanou V, Villarroel-Espindola F, Schalper KA, et al. CD68, CD163, and matrix metalloproteinase 9 (MMP-9) co-localization in breast tumor microenvironment predicts survival differently in ER-positive and -negative cancers. Breast Cancer Res 2018;20:154. 10.1186/s13058-018-1076-x [DOI] [PMC free article] [PubMed] [Google Scholar]
- 6.Mantovani A, Allavena P, Sica A, et al. Cancer-related inflammation. Nature 2008;454:436-44. 10.1038/nature07205 [DOI] [PubMed] [Google Scholar]
- 7.Sparmann A, Bar-Sagi D. Ras-induced interleukin-8 expression plays a critical role in tumor growth and angiogenesis. Cancer Cell 2004;6:447-58. 10.1016/j.ccr.2004.09.028 [DOI] [PubMed] [Google Scholar]
- 8.Diakos CI, Charles KA, McMillan DC, et al. Cancer-related inflammation and treatment effectiveness. Lancet Oncol 2014;15:e493-503. 10.1016/S1470-2045(14)70263-3 [DOI] [PubMed] [Google Scholar]
- 9.Hendry S, Salgado R, Gevaert T, et al. Assessing Tumor-infiltrating Lymphocytes in Solid Tumors: A Practical Review for Pathologists and Proposal for a Standardized Method From the International Immunooncology Biomarkers Working Group. Adv Anat Pathol 2017;24:235-51. 10.1097/PAP.0000000000000162 [DOI] [PMC free article] [PubMed] [Google Scholar]
- 10.Pages F, Kirilovsky A, Mlecnik B, et al. In situ cytotoxic and memory T cells predict outcome in patients with early-stage colorectal cancer. J Clin Oncol 2009;27:5944-51. 10.1200/JCO.2008.19.6147 [DOI] [PubMed] [Google Scholar]
- 11.Anitei MG, Zeitoun G, Mlecnik B, et al. Prognostic and predictive values of the immunoscore in patients with rectal cancer. Clin Cancer Res 2014;20:1891-9. 10.1158/1078-0432.CCR-13-2830 [DOI] [PubMed] [Google Scholar]
- 12.Wang Y, Lin HC, Huang MY, et al. The Immunoscore system predicts prognosis after liver metastasectomy in colorectal cancer liver metastases. Cancer Immunol Immunother 2018;67:435-44. 10.1007/s00262-017-2094-8 [DOI] [PMC free article] [PubMed] [Google Scholar]
- 13.Eruslanov E, Neuberger M, Daurkin I, et al. Circulating and tumor-infiltrating myeloid cell subsets in patients with bladder cancer. Int J Cancer 2012;130:1109-19. 10.1002/ijc.26123 [DOI] [PubMed] [Google Scholar]
- 14.Kitayama J, Yasuda K, Kawai K, et al. Circulating lymphocyte is an important determinant of the effectiveness of preoperative radiotherapy in advanced rectal cancer. BMC Cancer 2011;11:64. 10.1186/1471-2407-11-64 [DOI] [PMC free article] [PubMed] [Google Scholar]
- 15.Pinato DJ, Shiner RJ, Seckl MJ, et al. Prognostic performance of inflammation-based prognostic indices in primary operable non-small cell lung cancer. Br J Cancer 2014;110:1930-5. 10.1038/bjc.2014.145 [DOI] [PMC free article] [PubMed] [Google Scholar]
- 16.Lin GN, Peng JW, Xiao JJ, et al. Prognostic impact of circulating monocytes and lymphocyte-to-monocyte ratio on previously untreated metastatic non-small cell lung cancer patients receiving platinum-based doublet. Med Oncol 2014;31:70. 10.1007/s12032-014-0070-0 [DOI] [PubMed] [Google Scholar]
- 17.Colotta F, Allavena P, Sica A, et al. Cancer-related inflammation, the seventh hallmark of cancer: links to genetic instability. Carcinogenesis 2009;30:1073-81. 10.1093/carcin/bgp127 [DOI] [PubMed] [Google Scholar]
- 18.Xia H, Sun Z, Deng L, et al. Prognostic Significance of the Preoperative Lymphocyte to Monocyte Ratio in Patients With Stage I Non-Small Cell Lung Cancer Undergoing Complete Resection. Cancer Invest 2016;34:378-84. 10.1080/07357907.2016.1213276 [DOI] [PubMed] [Google Scholar]
- 19.Mei J, Xiao Z, Guo C, et al. Prognostic impact of tumor-associated macrophage infiltration in non-small cell lung cancer: A systemic review and meta-analysis. Oncotarget 2016;7:34217-28. [DOI] [PMC free article] [PubMed] [Google Scholar]
- 20.Vansteenkiste J, Barlesi F, Waller CF, et al. Cilengitide combined with cetuximab and platinum-based chemotherapy as first-line treatment in advanced non-small cell lung cancer (NSCLC) patients: results of an open-label, randomized, controlled phase II study (CERTO). Ann Oncol 2015;26:1734-40. 10.1093/annonc/mdv219 [DOI] [PubMed] [Google Scholar]
- 21.Park SE, Lee SH, Ahn JS, et al. Increased Response Rates to Salvage Chemotherapy Administered after PD-1/PD-L1 Inhibitors in Patients with Non-Small Cell Lung Cancer. J Thorac Oncol 2018;13:106-11. 10.1016/j.jtho.2017.10.011 [DOI] [PubMed] [Google Scholar]
- 22.Lo CS, Sanii S, Kroeger DR, et al. Neoadjuvant Chemotherapy of Ovarian Cancer Results in Three Patterns of Tumor-Infiltrating Lymphocyte Response with Distinct Implications for Immunotherapy. Clin Cancer Res 2017;23:925-34. 10.1158/1078-0432.CCR-16-1433 [DOI] [PubMed] [Google Scholar]
- 23.Becht E, Giraldo NA, Germain C, et al. Immune Contexture, Immunoscore, and Malignant Cell Molecular Subgroups for Prognostic and Theranostic Classifications of Cancers. Adv Immunol 2016;130:95-190. 10.1016/bs.ai.2015.12.002 [DOI] [PubMed] [Google Scholar]
- 24.Wu SP, Liao RQ, Tu HY, et al. Stromal PD-L1-Positive Regulatory T cells and PD-1-Positive CD8-Positive T cells Define the Response of Different Subsets of Non-Small Cell Lung Cancer to PD-1/PD-L1 Blockade Immunotherapy. J Thorac Oncol 2018;13:521-32. 10.1016/j.jtho.2017.11.132 [DOI] [PubMed] [Google Scholar]
- 25.Kayser G, Schulte-Uentrop L, Sienel W, et al. Stromal CD4/CD25 positive T-cells are a strong and independent prognostic factor in non-small cell lung cancer patients, especially with adenocarcinomas. Lung Cancer 2012;76:445-51. 10.1016/j.lungcan.2012.01.004 [DOI] [PubMed] [Google Scholar]
- 26.Schalper KA, Brown J, Carvajal-Hausdorf D, et al. Objective measurement and clinical significance of TILs in non-small cell lung cancer. J Natl Cancer Inst 2015. doi: . 10.1093/jnci/dju435 [DOI] [PMC free article] [PubMed] [Google Scholar]
- 27.Kim MY, Koh J, Kim S, et al. Clinicopathological analysis of PD-L1 and PD-L2 expression in pulmonary squamous cell carcinoma: Comparison with tumor-infiltrating T cells and the status of oncogenic drivers. Lung Cancer 2015;88:24-33. 10.1016/j.lungcan.2015.01.016 [DOI] [PubMed] [Google Scholar]
- 28.Goc J, Germain C, Vo-Bourgais TK, et al. Dendritic cells in tumor-associated tertiary lymphoid structures signal a Th1 cytotoxic immune contexture and license the positive prognostic value of infiltrating CD8+ T cells. Cancer Res 2014;74:705-15. 10.1158/0008-5472.CAN-13-1342 [DOI] [PubMed] [Google Scholar]
- 29.Suzuki K, Kadota K, Sima CS, et al. Clinical impact of immune microenvironment in stage I lung adenocarcinoma: tumor interleukin-12 receptor beta2 (IL-12Rbeta2), IL-7R, and stromal FoxP3/CD3 ratio are independent predictors of recurrence. J Clin Oncol 2013;31:490-8. 10.1200/JCO.2012.45.2052 [DOI] [PMC free article] [PubMed] [Google Scholar]
- 30.Sterlacci W, Wolf D, Savic S, et al. High transforming growth factor beta expression represents an important prognostic parameter for surgically resected non-small cell lung cancer. Hum Pathol 2012;43:339-49. 10.1016/j.humpath.2011.05.017 [DOI] [PubMed] [Google Scholar]
- 31.Al-Shibli K, Al-Saad S, Andersen S, et al. The prognostic value of intraepithelial and stromal CD3-, CD117- and CD138-positive cells in non-small cell lung carcinoma. Apmis 2010;118:371-82. 10.1111/j.1600-0463.2010.02609.x [DOI] [PubMed] [Google Scholar]
- 32.Donnem T, Hald SM, Paulsen EE, et al. Stromal CD8+ T-cell Density-A Promising Supplement to TNM Staging in Non-Small Cell Lung Cancer. Clin Cancer Res 2015;21:2635-43. 10.1158/1078-0432.CCR-14-1905 [DOI] [PubMed] [Google Scholar]
- 33.Trinh A, Trumpi K, De Sousa E, Melo F, et al. Practical and Robust Identification of Molecular Subtypes in Colorectal Cancer by Immunohistochemistry. Clin Cancer Res 2017;23:387-98. 10.1158/1078-0432.CCR-16-0680 [DOI] [PubMed] [Google Scholar]
- 34.Sabour S. Immunohistochemistry Improves the Diagnosis of Small Cell Lung Cancer; Statistical Issue on Reproducibility Analysis. J Thorac Oncol 2017;12:e69. 10.1016/j.jtho.2017.01.029 [DOI] [PubMed] [Google Scholar]
- 35.Yatabe Y, Dacic S, Borczuk AC, et al. Best Practices Recommendations for Diagnostic Immunohistochemistry in Lung Cancer. J Thorac Oncol 2019;14:377-407. 10.1016/j.jtho.2018.12.005 [DOI] [PMC free article] [PubMed] [Google Scholar]
- 36.Galon J, Costes A, Sanchez-Cabo F, et al. Type, density, and location of immune cells within human colorectal tumors predict clinical outcome. Science 2006;313:1960-4. 10.1126/science.1129139 [DOI] [PubMed] [Google Scholar]
Associated Data
This section collects any data citations, data availability statements, or supplementary materials included in this article.
Supplementary Materials
The article’s supplementary files as


