Abstract
Background
Thyroid carcinoma constitutes the vast majority of all thyroid cancer, most of which is the solid nodule type. No previous studies have examined combining both conventional and elastic sonography to evaluate the diagnostic performance of partially cystic thyroid cancer (PCTC). This retrospective study was designed to evaluate differentiation of PCTC from benign partially cystic nodules with a machine learning–assisted system based on ultrasound (US) and elastography.
Methods
Patients with suspicious partially cystic nodules and finally confirmed were included in the study. We performed conventional US and real-time elastography (RTE). The US features of nodules were recorded. The data set was entered into 6 machine-learning algorithms. Sensitivity, specificity, accuracy, and area under the curve (AUC) were calculated.
Results
A total of 177 nodules were included in this study. Among these nodules, 81 were malignant and 96 were benign. Wreath-shaped feature, micro-calcification, and strain ratio (SR) value were the most important imaging features in differential diagnosis. The random forest classifier was the best diagnostic model.
Conclusions
US features of PCTC exhibited unique characteristics. Wreath-shaped partially cystic nodules, especially with the appearance of micro-calcifications and larger SR value, are more likely to be malignant. The random forest classifier might be useful to diagnose PCTC.
Keywords: Partially cystic nodule, thyroid, elastography, machine learning
Introduction
Thyroid nodules can be detected in up to 50% of the population at autopsy (1) and 19–68% of randomly selected individuals using high-resolution ultrasound (US) (2,3). Fewer than 5% of thyroid nodules are malignant (4), but prevalence has been rapidly increasing over the past several decades (5). Most thyroid cancer shows as solid nodule ultrasonographically, and cystic carcinomas are rare (6).
US is widely used as the primary imaging modality for the initial characterization of thyroid nodules. Characteristic features of conventional US of papillary thyroid carcinoma (PTC) include indistinct margin, irregular shape, non-parallel orientation, micro-calcifications, hypoechogenicity, intranodular vascularity, among other features (7-9). However, most studies in this area have focused on solid thyroid nodules rather than partially cystic nodules. Partially cystic nodules, which have both solid and cystic portions, are mixed echoic nodules on conventional US, and can account for approximately 15–53.8% of all sonographically detected nodules (10). Clinically, most of these nodules are benign, and the percentage of the malignant nodules varies from approximately 3.3% to 5.4% (10,11). Therefore, general sonographers are likely to diagnose lesions as benign when thyroid nodules show as partially cystic and may misdiagnose malignancy, especially if they are less experienced. Real-time elastography (RTE) has been used to assess the hardness of nodules to support the diagnosis, but the added value is controversial.
In this study, we examined suspicious partially cystic nodules and evaluated their ultrasonic and elastic features. A machine learning classifier was validated for identifying partially cystic nodules that are possibly malignant.
Methods
Patients
We conducted a retrospective study consisting of patients from a single hospital. This study was approved by the Ethics Committee of West China hospital in Sichuan University, and informed consent from the patients was not required. Patients who met the following criteria were included in the study: (I) the composition of the nodule was partially solid and partially cystic, (II) the patient underwent high-resolution US and RTE before clinical intervention, (III) all the nodules were suspicious for malignancy and underwent fine-needle aspiration (FNA), and (IV) pathology results of nodules were confirmed after surgery or FNA. Patients had been exposed to high-dose radiation, either inadvertently or as part of medical treatment, or who had neck surgery, were excluded from the study. Patients whose pathology was confirmed after FNA were also excluded from the study. Thyroid US was performed by a Phillips iu22 scanner (Philips, Bothell, WA, USA) using a bandwidth of 5 MHz with a 12 MHz transducer, and RTE was performed by a HITACHI Vision 900 system (Hitachi Medical System, Tokyo, Japan).
Sonographic imaging
The nodule US features recorded were size, shape, margins, micro-calcifications, composition, echogenicity of the solid portion, halo sign, vascularity, colour scale scoring system of RTE, and strain ratio (SR) value.
According to the proportion of the solid portion, composition was divided into solid portion <50% and solid portion ≥50%. According to the distribution of the cystic and solid portions of the nodule, composition was further classified as petaloid shape, papillary shape, and spongy form. Petaloid shape appearance was defined as solid portion that displayed small clusters with scalloped margins projecting into multiple small cysts arranged partially or totally around the solid element on 1 ultrasonic plane (Figure 1). Papillary shape was defined as solid portion abutted to the side of the cyst wall (Figure 2), or a solid portion with a small part of liquefaction. A spongy form, as reported by Moon (12), was defined as the aggregation of multiple microcytic components in more than 50% of the volume of the nodule. Nodule size was defined as the maximum diameter in the US. Shape was classified as regular shape, micro-lobulated shape, or angular shape. Margins were categorized as distinct or indistinct. Because there has been no clear size criterion for determining whether a calcification is a micro- or macro-calcification, we decided to classify each calcification as a micro- or macro-calcification by using a cut-off value of 1 mm. Micro-calcifications exhibited tiny, punctuate hyperechoic foci <1 mm in diameter without posterior acoustic shadow. The echogenicity of the solid portion was classified as hyperechoic, isoechoic, or hypoechoic, compared with peripheral thyroid parenchyma. Vascularity was determined to be Alder grade 0, 1, 2, or 3, consistent with Alder’s study. The location of the main vessel was classified into two groups based upon its position relative to the tumour: group 1, marked internal flow; group 2, peripheral blood flow. If present, the peak-systole velocity (PSV) and resistance index (RI) of the artery within the tumour were measured.
Figure 1.
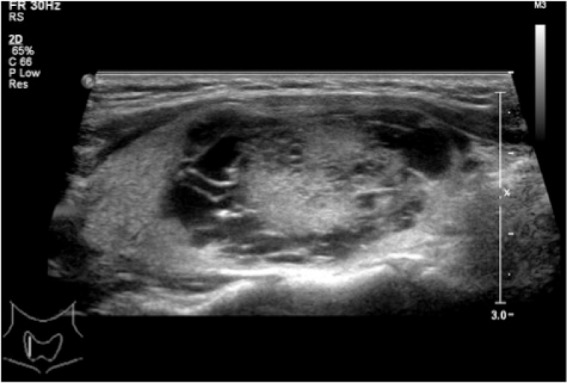
A mixed echoic nodule with petaloid shape and without calcification. The image shows the solid portion displaying small clusters with scalloped margins, projecting into multiple small cysts arranged completely around the solid element. Papillary carcinoma was diagnosed after surgery.
Figure 2.
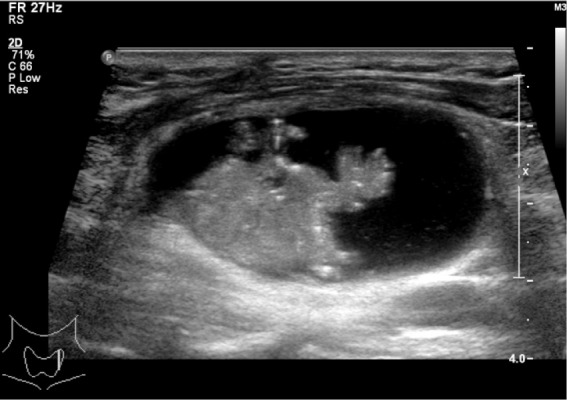
A mixed echoic nodule with papillary shape. The image shows the solid portion is abutted on the side of the cyst wall. Papillary carcinoma was diagnosed after surgery.
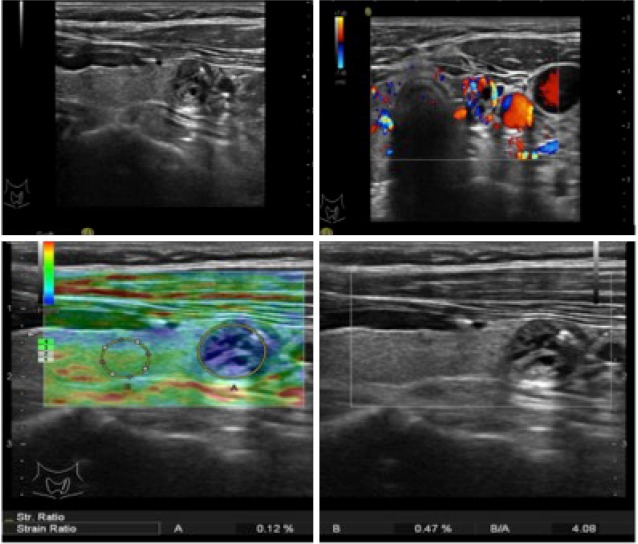
RTE was performed as follows. An elastogram was displayed on a colour scale ranging from blue to red. The scoring system used was similar to that described by Rago et al. (13): score 1: elasticity in the whole nodule; score 2, elasticity in a large part of the nodule; score 3, elasticity only at the peripheral part of the nodule; score 4, no elasticity in the nodule; score 5, no elasticity in the nodule or in the posterior shadowing. The SR value that was obtained by comparing the stiffness of the nodule with the surrounding normal thyroid parenchyma in the same depth was assessed for each nodule. Remarkably, all elastography images were obtained in longitudinal planes, with the pressure by the transducer indicator displayed on the screen ranging between 3 and 4. Optimally, the image in the surrounding normal thyroid parenchyma was homogeneous.
Statistical analysis was performed using SPSS 17.0 (Chicago, IL, USA). Data that accorded with normal distribution and homogeneity of variance were compared by t-test, or by rank-sum test. A chi-square test was used to evaluate categorical variables. Analysis of the receiver operating characteristic (ROC) curve was used to identify the optimal cut-off value for elastography score (ES) and SR value.
For each nodule, 20 features were collected. The data set was entered into six machine-learning algorithms: L1 logistic regression, random forest, extreme gradient boosting, support vector machine, multilayer perceptron, and k-nearest neighborhood. The ability of the algorithms was compared in terms of area under the curve.
Results
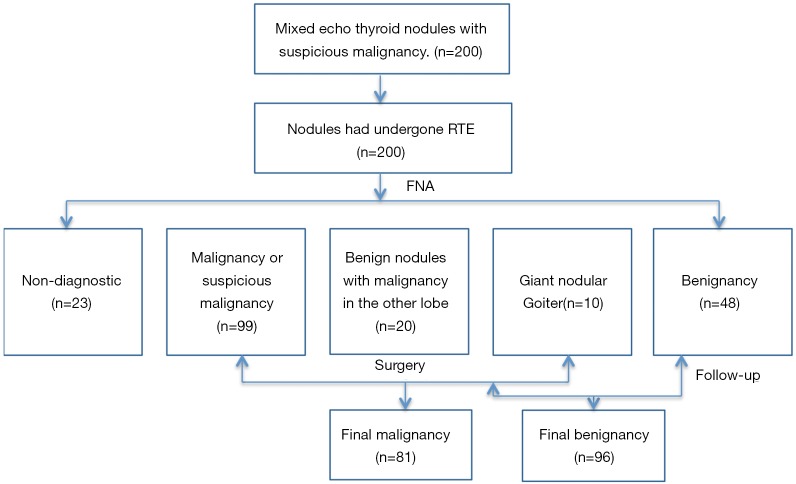
A total of 44 men and 130 women with 177 nodules were included in the study, while 23 nodules were excluded because of an inadequate cytology reading. Ages ranged from 22 to 75 years (mean: 45 years). Among the 177 nodules, 81 were malignant and 96 were benign. All the malignant nodules were confirmed post-surgery. Ultimately, 38 benign nodules were confirmed post-surgery for suspicion of carcinoma after FNA or malignancy in the other lobe of thyroid gland, and 10 patients went through partial thyroidectomy because of giant nodular goiter; the remaining benign nodules were confirmed after FNA and at least 6-month follow-up (Figure 3).
Figure 3.
Flow diagram summarizing inclusion of thyroid nodules. RTE, real-time elastography; FNA, fine-needle aspiration.
Conventional US features and corresponding histopathology data are summarized in Table 1. Benign nodules ranged from 0.4 to 9.3 cm in size, and malignant nodules ranged from 0.7 to 5.3 cm in size. The mean size of the benign nodules was slightly larger than the mean size of the malignant nodules, but the difference was not significant (P=0.395). As expected, there were more women than men in the study; however, significantly more men suffered from malignancy. Micro-lobulated shape and micro-calcifications were significantly associated with malignancy (P<0.0001; Table 1). The sensitivity, specificity, accuracy, positive predictive value (PPV), and negative predictive value (NPV) of micro-lobulated margin were 61.7%, 82.3%, 72.9%, 74.6%, and 71.8%, respectively. For micro-calcifications, they were 81.5%, 72.9%, 76.8%, 71.7%, and 82.4%, respectively (Table 2).
Table 1. US and ES features of partially cystic nodules.
| US features | Malignant nodules | Benign nodules | P value |
|---|---|---|---|
| Mean size (mm) | 20.0 | 23.4 | 0.395 |
| Age (years) | 41.9 | 47.9 | <0.0001 |
| Sex (male/female) | 29/52 | 16/80 | 0.004 |
| Composition | <0.0001 | ||
| Petaloid shape | 56 | 4 | |
| Papillary shape | 24 | 62 | |
| Spongy form | 1 | 30 | |
| HT (yes/no) | 21/60 | 13/83 | 0.037 |
| Shape | <0.0001 | ||
| Micro-lobulate | 50 | 17 | |
| Angular margin | 2 | 11 | |
| Regular | 29 | 68 | |
| Taller than wide shape | 0.164 | ||
| ≥1 | 28 | 24 | |
| <1 | 53 | 72 | |
| Margin | 0.021 | ||
| Distinct | 47 | 39 | |
| Indistinct | 34 | 57 | |
| Echogenicity | 0.01 | ||
| Hypoechoic | 48 | 35 | |
| Isoechoic | 31 | 58 | |
| Hyperechoic | 2 | 3 | |
| Calcification | <0.0001 | ||
| Microcalcification | 66 | 26 | |
| Macrocalcification | 6 | 9 | |
| No calcification | 9 | 61 | |
| Color Doppler | <0.0001 | ||
| Marked internal flow | 42 | 21 | |
| Peripheral blood flow | 24 | 48 | |
| Alder grade | 0.186 | ||
| Alder grade 0 | 15 | 27 | |
| Alder grade 1 | 35 | 20 | |
| Alder grade 2 | 22 | 18 | |
| Alder grade 3 | 9 | 31 | |
| Peak-systole velocity | 24.8±19.4 | 20.2±11.8 | 0.504 |
| Resistance index | 0.67±0.16 | 0.60±0.15 | 0.104 |
| Elastic features | <0.0001 | ||
| ES 4–5 | 51 | 22 | |
| ES 1–3 | 30 | 74 | |
| SR | <0.0001 | ||
| >2.82 | 55 | 20 | |
| ≤2.82 | 26 | 76 |
US, ultrasound; ES, elastography score; HT, Hashimoto’s thyroiditis; SR, strain ratio.
Table 2. Diagnostic index of malignant ultrasound features.
| Feature | Sensitivity | Specificity | Accuracy | PPV | NPV |
|---|---|---|---|---|---|
| Micro-lobulated shape | 61.7%±10.8% | 82.3%±7.8% | 72.9%±6.6% | 74.6%±10.7% | 71.8%±8.5% |
| Micro-calcifications | 81.5%±8.7% | 72.9%±9.0% | 76.8%±6.2% | 71.7%±9.3% | 82.4%±8.3% |
| Petaloid shape | 69.1%±10.2% | 95.8%±4.0% | 83.6%±5.5% | 93.3%±6.5% | 78.6%±7.5% |
| ES 4–5 | 63.0%±10.8% | 77.1%±8.6% | 70.6%±6.8% | 70.0%±10.8% | 71.2%±8.9% |
| SR >2.82 | 67.9%±10.4% | 79.2%±8.3% | 74.0%±6.5% | 73.3%±10.2% | 74.5%±8.6% |
PPV, positive predictive value; NPV, negative predictive value; ES, elastography score; SR, strain ratio.
Notably, none of the nodules were marked hypoechoic, and approximately 40.7% of malignant nodules were isoechoic or hyperechoic.
Composition of partially cystic thyroid cancer (PCTC) showed typical characteristics. Approximately 69.1% of PCTCs were petaloid shape while only 4.2% of benign nodules were petaloid shape. The sensitivity, specificity, accuracy, PPV, and NPV were 69.1%, 95.8%, 83.6%, 93.3%, and 78.6%, respectively. Spongy form appearance typically indicates benignancy with a high specificity (14), and in our study, 96.8% nodules with spongy form feature were benign. In contrast, the percentage of spongy form in the benign group was 31.3%. The US feature of solid portion ≥50% was not significantly different in benign and malignant nodules.
Elastography (Figure 4)
Figure 4.
A mixed echoic nodule with characteristics of calcification, regular shape, and distinct margin. The elastography score was 4, and the strain ratio value was 4.08. Papillary carcinoma was diagnosed after surgery.
Table 1 shows the distribution of elastosonography scores for thyroid nodules and final histopathology. The area under the receiver operating characteristic curve (AUC) for diagnosing PCTC by ES was 0.763 [95% confidence interval (CI), 0.694–0.833]. The cut-off value for differentiating benignancy and malignancy was 3, and ES >3 was predictive of malignancy (P=0.0001). The sensitivity, specificity, accuracy, PPV, and NPV were 63.0%, 77.1%, 70.6%, 70.0%, and 71.2%, respectively.
The AUC for differentiating benign from malignant nodules by SR value was 0.767 (95% CI, 0.697–0.838). The cut-off value for differentiating benignancy and malignancy was 2.82, and SR >2.82 was predictive of malignancy (P=0.0001). The sensitivity, specificity, accuracy, PPV, and NPV was 67.9%, 79.2%, 74.0%, 73.3%, and 74.5%, respectively.
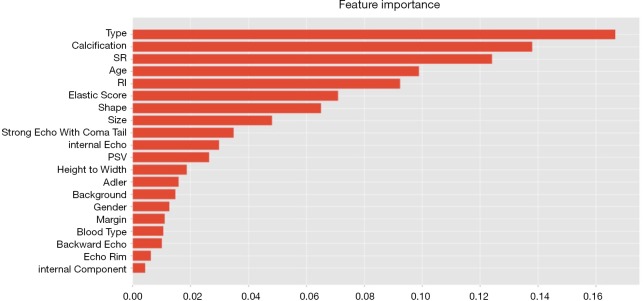
The diagnostic performance of the 6 machine-learning algorithms is shown in Table 3. Among these methods, the random forest classifier demonstrated the highest values for AUC (93.4%±4%, Figure 5) with a sensitivity of 86.6%±8%, a specificity of 85.5%±6%, and an accuracy of 86.0%±6%. The 3 more important features for the diagnostic performance of the random forest model were petaloid shape, presence of micro-calcification, and higher SR (Figure 6).
Table 3. Model performance on pure testing dataset.
| Classifier | AUC | Accuracy | Sensitivity | Specificity |
|---|---|---|---|---|
| L1 logistic regression | 92.8%±4% | 84.2%±4% | 90.1%±6% | 79.2%±11% |
| Random forest | 93.4%±4% | 86.0%±6% | 86.6%±8% | 85.5%±6% |
| XGboost | 92.6%±3% | 83.7%±6% | 85.3%±7% | 82.3%±7% |
| SVM | 92.3%±5% | 84.8%±5% | 89.0%±4% | 81.3%±8% |
| MLP | 90.8%±4% | 84.8%±3% | 87.6%±6% | 82.4%±9% |
| KNN | 91.8%±4% | 85.4%±6% | 81.5%±5% | 88.6%±7% |
AUC, area under the curve; SVM, support vector machine; MLP, multilayer perceptron; KNN, k-nearest neighbor.
Figure 5.
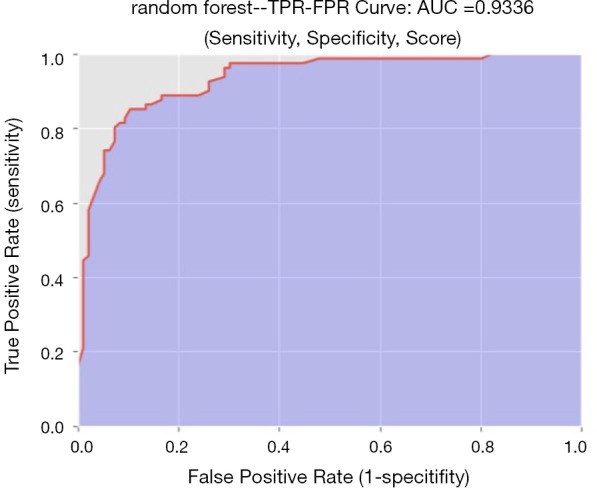
ROC of the random forest plot. AUC =0.9336. ROC, receiver operating characteristic; AUC, area under the curve.
Figure 6.
Relative importance of features for diagnosis of random forest classifier.
Discussion
Cystic change has been identified in many thyroid nodules, including PTC, although it is far more common in non-neoplastic thyroid nodules such as nodular goitres, adenomatous nodules, and others (15). PCTC is a variant of papillary carcinoma, and the ultrasonic features are quite different from typical solid papillary carcinoma. It is easy to misdiagnose, especially for less experienced sonographers. The main purpose of this study was to identify those US features predictive of malignancy.
The sonographic features of solid PTC have been well described in the literature, most of which were reported as hypoechoic or marked hypoechoic nodules. There is little information, however, regarding US features with PCTC. In our study, the echogenicity was not significantly different between PCTC and the other benign nodules. None of the PCTCs were marked hypoechoic; by contrast, 40.7% of the PCTCs were isoechoic and hyperechoic. This could lead to a misdiagnosis of adenomatoid nodule. Interestingly, it was reported that histologically differentiating PCTC from cystic adenomatoid nodules was very difficult because of the many common findings in the two kinds of nodules (16). This could be the cytopathological reason behind misdiagnosis.
In our study, the US feature of petaloid shape showed high specificity and NPV. Approximately 69.1% of PCTCs presented with petaloid shape on ultrasonography. Additionally, the majority (93.3%) of cystic nodules with characteristic petaloid shape were PCTC. We observed in detail that this correlated well with the features on histology. In a previous study (16), the presence of small clusters with scalloped margins on histology was observed in PCTC but not in other cystic lesions. Thus, the presence of a partially cystic nodule showing petaloid shape in particular may indicate or predict malignancy.
Unlike usual solid thyroid cancer, indistinct margin was not a suspicious US feature for PCTC in the current study. Yang et al. (17) reported that PCTC correlated with a subset of the encapsulated variant of PTC, a tumour with a favourable prognosis according to the 1988 WHO classification of tumours. This pathological characteristic might be the basis of a distinct margin sonographically.
Calcifications, especially micro-calcifications, were strongly associated with malignancy. Our findings supported those of previous studies (10,18,19), which have reported that the presence of micro-calcification was very specific for differentiating malignant nodules from benign ones. Micro-calcifications were the most sensitive marker of malignancy. It is sometimes difficult to distinguish micro-calcification from punctuate hyperechoic focus with the comet tail sign, especially in partially cystic nodules. Punctuate hyperechoic focus on the cystic wall frequently showed comet tail sign. In our study, there were 66 malignant nodules that contained micro-calcification, while 26 nodules (39.4%) of which also showed comet tail sign. This may be another reason of misdiagnosis by sonographers.
Elastography is a new, non-invasive, cost-effective diagnostic tool, which can enhance the accuracy of assessing the malignancy risk of solid thyroid nodules (20,21). In many centers, elastography is integrated into the routine US examination of thyroid nodules (22). While previous reports have suggested that US elastography may be effectively applied to only solid nodules, thus excluding its utility for cystic or partially cystic nodules (23,24), the presence of the partially cystic component correlated to increased levels of stiffness (24). Bhatia found that qualitative RTE predicted malignancy only if predominantly cystic nodules were excluded (24). Clinically, most predominantly cystic nodules are benign. In our study, all PCTC excised in our hospital during the study period were included, and only 1 case had a predominantly cystic nodule, the remaining cases were predominantly solid ones. In the control group, all the nodules were suspicious, and only 3 nodules were predominantly cystic ones. Therefore, we would not advocate using RTE to assess probably benign nodules, and we would only consider using RTE to assess suspicious nodules, most of which were predominantly solid ones, as this feature showed satisfactory diagnostic value compared to the other suspicious US features. When the nodule had both ES >3 and SR >2.82, the nodule was strongly associated with malignancy.
In this study, we also used the data to train 6 artificial intelligence-based machine-learning classifiers to identify which of the 6 was the best in differentiating between benignancy and malignancy; this revealed that the random forest algorithm had the best performance. Compared with single US features, this classifier was more reliable for differentiating benign and malignant nodules. This was consistent with previous a study (25), in which most cases included were solid ones.
There are a few limitations to this study which should be addressed. First, this study did not include all benign mixed echoic thyroid nodules. All nodules in our study were suspicious and were confirmed pathologically. Therefore, we could not estimate the percentage of malignancy in partially cystic nodules. Second, most cases, including those in both study and control groups, displayed as predominantly solid in our study. Thus, ES features may not be useful in the differential diagnosis of predominantly cystic nodules. Third, the number of cases was a bit small for using computer-aided diagnosis systems, so our findings need to be confirmed in a larger patient population.
In summary, this is one of the few studies focussing on the US and ES features of PCTC. Our findings suggest that the random forest classifier may improve the differential diagnosis of malignant and benign nodules with partially cystic character. The most important US features were petaloid shape, micro-calcification, and SR value, as partially cystic nodules were highly suspected to be malignant whenever these features appeared.
Supplementary
The article’s supplementary files as
Acknowledgments
Funding: None.
Ethical Statement: The authors are accountable for all aspects of the work in ensuring that questions related to the accuracy or integrity of any part of the work are appropriately investigated and resolved. We conducted a retrospective study consisting of patients from a single hospital. This study was approved by the Ethics Committee of West China hospital in Sichuan University (No. 524), and informed consent from the patients was not required.
Footnotes
Conflicts of Interest: All authors have completed the ICMJE uniform disclosure form (available at http://dx.doi.org/10.21037/atm.2020.03.211). The authors have no conflicts of interest to declare.
References
- 1.Frates MC, Benson CB, Charboneau JW, et al. Management of thyroid nodules detected at US: Society of Radiologists in Ultrasound Consensus Conference Statement 1. Radiology 2005;237:794-800. 10.1148/radiol.2373050220 [DOI] [PubMed] [Google Scholar]
- 2.Wang Y, Guan Q, Lao I, et al. Using deep convolutional neural networks for multi-classification of thyroid tumor by histopathology: a large-scale pilot study. Ann Transl Med 2019;7:468. 10.21037/atm.2019.08.54 [DOI] [PMC free article] [PubMed] [Google Scholar]
- 3.Tan GH, Gharib H. Thyroid incidentalomas: management approaches to nonpalpable nodules discovered incidentally on thyroid imaging. Ann Intern Med 1997;126:226-31. 10.7326/0003-4819-126-3-199702010-00009 [DOI] [PubMed] [Google Scholar]
- 4.Hegedüs L. Clinical practice. The thyroid nodule. N Engl J Med 2004;351:1764-71. 10.1056/NEJMcp031436 [DOI] [PubMed] [Google Scholar]
- 5.La VC, Malvezzi M, Bosetti C, et al. Thyroid cancer mortality and incidence: a global overview. Int J Cancer 2015;136:2187-95. 10.1002/ijc.29251 [DOI] [PubMed] [Google Scholar]
- 6.Chan BK, Desser TS, Mcdougall IR, et al. Common and uncommon sonographic features of papillary thyroid carcinoma. J Ultrasound Med 2003;22:1083-90. 10.7863/jum.2003.22.10.1083 [DOI] [PubMed] [Google Scholar]
- 7.Haugen BR, Alexander EK, Bible KC, et al. 2015 American Thyroid Association Management guidelines for adult patients with thyroid nodules and differentiated thyroid cancer: The American Thyroid Association guidelines task force on thyroid nodules and differentiated thyroid cancer. Thyroid 2016;26:1-133. 10.1089/thy.2015.0020 [DOI] [PMC free article] [PubMed] [Google Scholar]
- 8.Li M, Zhao B, Qu W, et al. Uncovering the potential miRNAs and mRNAs in follicular variant of papillary thyroid carcinoma in the Cancer Genome Atlas database. Transl Cancer Res 2019;8:1158-69. 10.21037/tcr.2019.06.30 [DOI] [PMC free article] [PubMed] [Google Scholar]
- 9.Wu Q, Wang Y, Li Y, et al. Diagnostic value of contrast-enhanced ultrasound in solid thyroid nodules with and without enhancement. Endocrine 2016;53:480-8. 10.1007/s12020-015-0850-0 [DOI] [PubMed] [Google Scholar]
- 10.Lee MJ, Kim EK, Kwak JY, et al. Partially cystic thyroid nodules on ultrasound: probability of malignancy and sonographic differentiation. Thyroid 2009;19:341-6. 10.1089/thy.2008.0250 [DOI] [PubMed] [Google Scholar]
- 11.Na DG, Kim JH, Kim DS, et al. Thyroid nodules with minimal cystic changes have a low risk of malignancy. Ultrasonography 2016;35:153-8. 10.14366/usg.15070 [DOI] [PMC free article] [PubMed] [Google Scholar]
- 12.Moon WJ, Jung SL, Lee JH, et al. Benign and malignant thyroid nodules: US differentiation--multicenter retrospective study. Radiology 2008;247:762-70. 10.1148/radiol.2473070944 [DOI] [PubMed] [Google Scholar]
- 13.Rago T, Santini F, Scutari M, et al. Elastography: new developments in ultrasound for predicting malignancy in thyroid nodules. J Clin Endocrinol Metab 2007;92:2917-22. 10.1210/jc.2007-0641 [DOI] [PubMed] [Google Scholar]
- 14.Moon WJ, Jung SL, Lee JH, et al. Benign and malignant thyroid nodules: US differentiation-multicenter retrospective study. Radiology 2008;247:762-70. 10.1148/radiol.2473070944 [DOI] [PubMed] [Google Scholar]
- 15.Faquin WC, Cibas ES, Renshaw AA. “Atypical” cells in fine-needle aspiration biopsy specimens of benign thyroid cysts. Cancer 2005;105:71-9. 10.1002/cncr.20832 [DOI] [PubMed] [Google Scholar]
- 16.Mokhtari M, Kumar PV, Hayati K. Fine-needle aspiration study of cystic papillary thyroid carcinoma: Rare cytological findings. J Cytol 2016;33:120-4. 10.4103/0970-9371.188046 [DOI] [PMC free article] [PubMed] [Google Scholar]
- 17.Yang GC, Stern CM, Messina AV. Cystic papillary thyroid carcinoma in fine needle aspiration may represent a subset of the encapsulated variant in WHO classification. Diagn Cytopathol 2010;38:721-6. [DOI] [PubMed] [Google Scholar]
- 18.Park JM, Choi Y, Kwag HJ. Partially cystic thyroid nodules: ultrasound findings of malignancy. Korean J Radiol 2012;13:530-5. 10.3348/kjr.2012.13.5.530 [DOI] [PMC free article] [PubMed] [Google Scholar]
- 19.Kobayashi K, Hirokawa M, Yabuta T, et al. Papillary thyroid carcinoma with honeycomb-like multiple small cysts: characteristic features on ultrasonography. Eur Thyroid J 2013; 2:270-274. [DOI] [PMC free article] [PubMed] [Google Scholar]
- 20.Moon HJ, Sung JM, Kim EK, et al. Diagnostic performance of gray-scale US and elastography in solid thyroid nodules. Radiology 2012;262:1002-13. 10.1148/radiol.11110839 [DOI] [PubMed] [Google Scholar]
- 21.Cantisani V, Lodise P, Grazhdani H, et al. Ultrasound elastography in the evaluation of thyroid pathology. Current status. Eur J Radiol 2014;83:420-8. 10.1016/j.ejrad.2013.05.008 [DOI] [PubMed] [Google Scholar]
- 22.Samir Anthony E. The role and value of ultrasound elastography in the evaluation of thyroid nodules. Cancer Cytopathology 2016;124:765-6. 10.1002/cncy.21782 [DOI] [PubMed] [Google Scholar]
- 23.Szczepanek-Parulska E, Woliński K, Stangierski A, et al. Biochemical and ultrasonographic parameters influencing thyroid nodules elasticity. Endocrine 2014;47:519-27. 10.1007/s12020-014-0197-y [DOI] [PubMed] [Google Scholar]
- 24.Bhatia KS, Rasalkar DP, Lee YP, et al. Cystic change in thyroid nodules: a confounding factor for real-time qualitative thyroid ultrasound elastography. Clin Radiol 2011;66:799-807. 10.1016/j.crad.2011.03.011 [DOI] [PubMed] [Google Scholar]
- 25.Zhang B, Tian J, Pei S, et al. Machine Learning-Assisted System for Thyroid Nodule Diagnosis. Thyroid 2019;29:858-67. 10.1089/thy.2018.0380 [DOI] [PubMed] [Google Scholar]
Associated Data
This section collects any data citations, data availability statements, or supplementary materials included in this article.
Supplementary Materials
The article’s supplementary files as


