

Abstract
Purpose
This study examined vocal hyperfunction (VH) using voice onset time (VOT). We hypothesized that speakers with VH would produce shorter VOTs, indicating increased laryngeal tension, and more variable VOTs, indicating disordered vocal motor control.
Method
We enrolled 32 adult women with VH (aged 20–74 years) and 32 age- and sex-matched controls. All were speakers of American English. Participants produced vowel–consonant–vowel combinations that varied by vowel (ɑ/u) and plosive (p/b, t/d, k/g). VOT—measured at the release of the plosive to the initiation of voicing—was averaged over three repetitions of each vowel–consonant–vowel combination. The coefficient of variation (CoV), a measure of VOT variability, was also computed for each combination.
Results
The mean VOTs were not significantly different between the two groups; however, the CoVs were significantly greater in speakers with VH compared to controls. Voiceless CoV values were moderately correlated with clinical ratings of dysphonia (r = .58) in speakers with VH.
Conclusion
Speakers with VH exhibited greater variability in phonemic voicing targets compared to vocally healthy speakers, supporting the hypothesis for disordered vocal motor control in VH. We suggest future work incorporate VOT measures when assessing auditory discrimination and auditory–motor integration deficits in VH.
Hyperfunctional voice disorders are defined as “conditions of abuse or misuse of the vocal mechanism due to excessive or imbalanced laryngeal tension” (Hillman et al., 1989). People with vocal hyperfunction (VH) present with a myriad of symptoms, including (a) self-reported laryngeal pain, vocal fatigue, and vocal effort (Altman et al., 2005; Solomon, 2008); (b) increased perception of breathiness (Hillenbrand & Houde, 1996) and/or strangled vocal quality (Holmberg et al., 2001); (c) higher laryngeal posturing (Lowell et al., 2012) and increased extrinsic laryngeal tension assessed via palpation (Angsuwarangsee & Morrison, 2002; Roy, 2008; Roy et al., 1996); and (d) increased degree of supraglottal constriction via laryngoscopy (Garaycochea et al., 2018; Morrison, 1997; Van Houtte et al., 2013). Speakers with VH constitute a heterogeneous population, with no single etiology or physiological presentation (Altman et al., 2005). Two subtypes of VH have been identified: nonphonotraumatic VH (NPVH), in which there are no anatomical changes to the vocal folds, and phonotraumatic VH (PVH; Mehta et al., 2015), in which there are organic changes to the vocal folds (e.g., vocal nodules, scar). At this time, it is not clear whether people without vocal fold lesions (NPVH) progress to develop lesions at a later time (PVH) or if these two subtypes of VH are, in fact, distinct from one another. Likely, there are multiple factors contributing to VH (Altman et al., 2005; Van Houtte et al., 2011), which include psychological and/or personality differences, daily voice use and vocal patterns (e.g., overuse and misuse), and compensation for pre-existing pathologies (e.g., nodules).
Nearly 40% of individuals with voice disorders present with a hyperfunctional component (Morrison et al., 1983). Despite this prevalence, little is known about the etiology and factors contributing to the persistence of VH. Hillman et al. (1989) proposed a framework for understanding the mechanisms that lead to VH; this landmark study described a cycle of vocal overuse or misuse, wherein increased vocal demands—resulting from occupational voice demands or recent illness—cause speakers to adopt a compensatory vocal patternprimarily characterized by increased laryngeal tension. Then, a vicious cycle may occur, whereby the muscular tension contributes to voice misuse, which results in further compensation of increased laryngeal tension.
The experimental framework proposed by Hillman et al. (1989) has been instrumental to understanding and examining VH for the past 30 years, yet the framework does not answer some lingering questions. For example, it does not explain why two individuals who experience the same precipitating event (e.g., an upper respiratory infection) could develop different vocal patterns. One individual may completely recover from the event with no residual symptoms of dysphonia or laryngeal tension, whereas the other may continue with abnormal vocal patterns and chronic problems. For this reason, a modified framework that includes etiological factors would be beneficial to understanding the pathophysiology of VH. More recently, researchers have proposed that individuals with VH may have auditory perceptual or auditory–motor integration deficits (an aspect of vocal motor control) that may contribute to the development of VH (Stepp et al., 2017; Tam et al., 2018).
Vocal Motor Control
It is widely accepted that integration of auditory feedback is crucial to the development of typical oral speech and language. Specifically, the “directions into velocities of articulators” (DIVA) model (Guenther, 2016) theorizes that the auditory feedback control system—which monitors and corrects motor behaviors to both acquire and produce targeted speech acoustics—is the basis for the development of speech. Once the auditory targets for speech sounds are learned, the mature adult system relies on a feedforward system to produce stored motor programs, subsequently depending less on auditory feedback. Auditory feedback control continues to be important for monitoring and correcting errors during speech production; however, because speech correction occurs at a relatively slow rate (i.e., the time it takes to detect and then correct an error can be as long as 100–150 ms; Burnett et al., 1998, 1997), it is necessary to use established motor programs for fluent speech.
Vocal motor control also relies on feedforward and feedback control to produce and monitor voice-specific targets (Behroozmand & Sangtian, 2018). One way to assess vocal motor control is to perturb the vocal system. For example, researchers can examine immediate reflexive responses to adjusted auditory feedback (e.g., pitch and loudness stimulus shifts), providing information about immediate feedback error correction (Bauer & Larson, 2003; Bauer et al., 2006; Burnett et al., 1998). Furthermore, there are paradigms that examine sensorimotor adaptation or how small shifts to auditory feedback over time result in a learned adjustment that persists for a period of time even when the shifted stimulus is removed (Behroozmand & Sangtian, 2018; Hawco & Jones, 2010; Keough & Jones, 2009; Scheerer et al., 2016). In sensorimotor adaptation paradigms, adults with typical voices tend to produce a compensatory vocal response in opposition to the perturbation. As such, an upward pitch shift to auditory feedback typically results in a downward response to the produced pitch. According to the DIVA model, the adaptation response results from the consistent detection of errors produced outside the designated auditory target range. Then, a gain (adjustment) is applied to the feedforward motor control map on the subsequent vocal productions so that the speaker can continue phonating within the prespecified auditory target range (Behroozmand & Sangtian, 2018; Burnett et al., 1998; Keough & Jones, 2009).
Auditory Motor Control in Individuals With VH
Stepp et al. (2017) evaluated the adaption response of speakers with VH, via a shift-up sensorimotor adaption paradigm. Participants produced the vowel /ɑ/ while their auditory feedback was slowly pitch-shifted upward in small increments (such that participants were unaware of the shift). Contrary to the established perturbation responses in adults with typical voices, five of the nine participants with VH followed the direction of the perturbation. The authors hypothesized that a subset of speakers with VH may have larger auditory targets. These larger targets could have contributed to maladaptive updating of the feedforward system via (a) inappropriate (or absent) detection of an auditory feedback error and/or (b) inappropriate adjustment of the gain applied to stored motor programs.
Stepp et al. (2017) had hypothesized that speakers with VH would exhibit auditory–motor integration deficits because they present with similar vocal patterns to those of speakers with profound hearing loss. Like the voice characteristics of speakers with VH, individuals with profound hearing loss have also been shown to have abnormal vocal quality (Ubrig et al., 2011), elevated subglottal pressure (Wang et al., 2017), and abnormal laryngeal posturing during voicing (Metz et al., 1984). Yet, no participants enrolled in the study by Stepp et al. (2017) had any history of hearing disorder or impairment, indicating normal auditory detection thresholds. It is important to note that auditory–motor integration deficits do not necessarily indicate a problem with auditory acuity, but rather, could be due to auditory discrimination abilities. Accordingly, there is preliminary evidence that speakers with VH may have auditory discrimination deficits. Tam et al. (2018) evaluated the ability to discriminate between small changes in pitch via a just-noticeable difference paradigm, which systematically reduced the pitch difference between two pure tones until the listener was unable to perceive a difference. Results showed that speakers with VH had significantly reduced pitch discrimination abilities when compared to controls. The reduced discrimination accuracy could result in a larger range of auditory targets and contribute to an increase in vocal variability during production.
Speech perception is intricately related to speech production. For example, reduced auditory discrimination between phonemes has been consistently correlated to reduced articulatory contrasts during phoneme productions (Franken et al., 2017; Perkell et al., 2004). Likewise, there is evidence that voice perception and production behave in a similar manner, with a moderate relationship between the precision of auditory–perceptual boundaries of breathiness and the subsequent acoustic measures of breathiness during vocal output (Park et al., 2019). For the case of VH, reduced auditory decriminalization could result in greater variability in vocal targets; for this reason, we hypothesized that individuals with VH have an underlying auditory representation that impacts their range of acceptable vocal targets and results in increased vocal variability. This central deficit could result in an inability to detect or correct auditory errors and contribute to maladaptive updating of the feedforward system (Stepp et al., 2017). If we combine the evidence for auditory–motor integration deficits (larger auditory targets, increased vocal variability) with maladaptive vocal motor control (inappropriate updating of the feedforward system), a new pattern of vocal motor control deficits emerges in individuals with VH. An underlying deficit in auditory–motor integration could be a contributing factor to the development and persistence of this voice disorder.
The works of Stepp et al. (2017) and Tam et al. (2018) elucidate potential etiological underpinnings contributing to VH. However, these works are somewhat limited as they require controlled experimental settings that lack ecological validity. It would be beneficial to evaluate vocal motor control and voicing targets during typical speech in order to better understand the manifestation of vocal variability in speakers with VH. Therefore, we chose to examine a phonemic voice target that could be evaluated during more natural speech: voice onset time (VOT). Unlike other languages that use a vocal target of pitch for phonemic meaning (e.g., Mandarin), VOT is one of the few targets that requires precise laryngeal vibratory timing for phonemic discrimination in the English language.
VOT
VOT is a temporal acoustic property that is measured as the duration of time between the release of a plosive (i.e., burst) and the onset of quasiperiodic voicing (Lisker & Abramson, 1964). Although VOT is a means of distinguishing phonemes across many languages, we only refer to the English language for the purposes of this study (specifically, the dialect of American English). In the English language, VOT determines whether plosives are perceived as voiceless (p/t/k) or voiced (b/d/g) in the word-initial context.
VOT is impacted by age (Ryalls et al., 2004; Sweeting & Baken, 1982; Zlatin & Koenigsknecht, 1976) and hearing status (for a review, see Lane & Perkell, 2005), as well as the phonemic and prosodic content of a speech utterance; this includes speaking rate and vowel duration (Kessinger & Blumstein, 1997; Miller et al., 1986; Volaitis & Miller, 1992), place of articulation (e.g., bilabial vs. velar; Lisker & Abramson, 1964; Port & Rotunno, 1979), and fundamental frequency (McCrea & Morris, 2005; Narayan & Bowden, 2013). However, it is possible that laryngeal muscle tension also affects VOT. Recent findings indicated that purposeful increases in pitch, the perceptual correlate of fundamental frequency, simultaneously reduced voiceless VOT durations (McCrea & Morris, 2005; Narayan & Bowden, 2013). Fundamental frequency, the vibratory rate of the vocal folds, is modulated by contraction of specific intrinsic (e.g., cricothyroid) and extrinsic (i.e., suprahyoids) laryngeal muscles (Shipp, 1975). Laryngeal tension likely mediates the abductory and adductory gestures of the vocal folds during the voiceless plosive as well; it is hypothesized that increased tension reduces the size of the abductory gesture during the plosive production and results in a shorter voiceless VOT (McCrea & Morris, 2005).
It follows that speakers with greater degrees of laryngeal muscle tension—a primary feature of VH—would then also exhibit shorter voiceless VOTs as compared to speakers without laryngeal tension. Using a laryngeal biomechanical model, Stepp et al. (2010) showed that increasing stiffness parameters in specific abductory and adductory muscles (i.e., lateral cricoarytenoid, thyroarytenoid, and posterior cricoarytenoid) resulted in concurrent increases in adductory angular velocities during alternating gross abductory/adductory gestures (i.e., /i/-sniff). The same study also found that laryngeal stiffness parameters were less affected by an increased rate of abductory/adductory laryngeal gestures in speakers with VH when compared to healthy speakers. The authors hypothesized that speakers with VH produced all gestures at an increased level of baseline laryngeal tension, which subsequently reduced the ability to increase laryngeal stiffness with gesture rate. Based on this evidence, we first hypothesized that speakers with VH would have shorter VOTs in comparison to speakers with healthy voices due to increased laryngeal tension of the abductory/adductory gesture during the plosive. We thought that VOT durations in individuals with VH would be similar to previous work that found shorter VOTs in healthy speakers when speaking at higher pitches.
To our knowledge, only one study has examined VOT in a small cohort of speakers with VH: five speakers with PVH (nodules) and five speakers with healthy voices (Marciniec, 2009). The speakers with PVH exhibited significantly greater variability in voiceless velar plosive productions (/k/) when compared to controls. The results of this study draw another parallel between speakers with VH and speakers with profound hearing loss: Individuals with hearing loss exhibit heightened variability within their own phonemic productions (Harris et al., 1985), as well as reduced contrast between voiced and voiceless plosives due to shorter voiceless VOTs (Osberger & McGarr, 1982). With the supposition that a subset of speakers with VH have a larger range of auditory targets, we hypothesized that speakers with VH would exhibit increased variability in their voicing targets, as evidenced by increased variability in VOT.
Purpose and Hypotheses
The purpose of this study was to build upon the existing theoretical framework regarding the etiological development and pathophysiology of VH. Specifically, we evaluated a phonemic voicing target, VOT, in speakers with VH in order to determine whether there was evidence for increased laryngeal tension and/or disordered vocal motor control. We developed the following theoretical hypotheses:
Hypothesis 1
Speakers with VH have increased laryngeal tension. Prior work has reported that increased tension (via purposeful increases in pitch) manifests as a reduction in VOT for voiceless plosives (McCrea & Morris, 2005; Narayan & Bowden, 2013). We predicted that speakers with VH would have significantly shorter VOTs when compared to healthy controls.
Hypothesis 2
Speakers with VH have auditory–motor integration deficits. We anticipated that individuals with VH would have significantly greater variability in their voicing targets when compared to healthy controls. This would indicate a larger range of auditory targets and provide more evidence that some speakers with VH have an impairment in their vocal motor control.
Method
Participants
Data were obtained from an existing database of voice samples collected for a larger study at Boston University between 2016 and 2019. Informed consent was obtained from every participant prior to the study in compliance with the Boston University Institutional Review Board.
A group of 32 speakers with healthy voices (henceforth referred to as controls) and a group of 32 speakers with VH participated in the study. All participants reported their sex to be female. We also had gender information on a subset of participants (n = 37) who all self-identified as feminine. Female participants were chosen for this study because voice disorders are consistently more prevalent in females than males (Coyle et al., 2001; Roy et al., 2005, 2004). Participants with VH were between the ages of 20 and 74 years (M = 38.4 years, SD = 15.8), and each control was matched to a speaker with VH within an age range of 5 years (M = 36.8 years, SD = 16.0). Participants with VH were diagnosed by a board-certified laryngologist via laryngoscopy and perceptual assessment. Participants with diagnoses of both NPVH (n = 21; no structural changes to the vocal folds) and PVH (n = 11; diagnosed with vocal nodules or scar) were included in the study. All participants were speakers of Standard American English and had no history of speech, language, hearing, or neurological disorders. Participants completed the Voice-Related Quality of Life Questionnaire (V-RQOL; Hogikyan & Sethuraman, 1999). A lower score on the V-RQOL indicates a greater impact of voice problems on the participant's daily life (a standardized score range of 0–100). Speakers with VH (M = 75.7, SD = 19.9) had lower scores on the V-RQOL compared to controls (M = 98.3, SD = 3.0).
A certified speech-language pathologist (SLP), blinded to the participants in the study, completed overall severity ratings for speakers with VH via the Consensus Auditory–Perceptual Evaluation of Voice (CAPE-V; Kempster et al., 2009). The SLP used an interactive custom MATLAB graphical user interface with a visual analog scale from 0 to 100 to provide a single overall rating. The range of CAPE-V ratings were from 2 to 48 (M = 19.3, SD = 11.5), which is a range from perceptually normal vocal quality to moderate dysphonia. Intrarater reliability was completed for 20% of randomly selected participants with VH (n = 7), with the SLP blind to the first ratings. The intraclass correlation coefficient (ICC) for intrarater reliability was deemed excellent (ICC[2,1] = .95). Interrater reliability was completed with a second certified SLP, blinded to the participants and previous SLP ratings, indicating good reliability (ICC[2,1] = .85). Further information on all participants can be found in Table A1 in the Appendix.
Protocol
Participants were instructed to produce vowel–consonant–vowel (VCV) utterances at their typical pitch and volume. The vowel in each utterance was either /ɑ/ or /u/, and the consonant was a plosive that was either voiceless (p/t/k) or voiced (b/d/g). All combinations of vowels and consonants were produced by each participant in the same order. VCV utterances were repeated three times in the carrier phrase: “Say ____ again”; for example, a participant would repeat “Say /upu/ again” three separate times. With two vowels, six consonants, and three repetitions, participants produced a total of 36 phrases.
If any utterances were produced incorrectly, the researcher responsible for recording the data would instruct the participant to repeat the target utterance. All utterances required complete production of both vowels so that central vowels (e.g., /ə/) were not substituted for the target /ɑ/ or /u/ vowels. The first vowel was given primary stress in each VCV utterance.
Data Acquisition
All participants donned a headset microphone (WH20 or MX 153; Shure) placed 7 cm away from the lips and 45° from the midline. A neck-surface accelerometer (Knowles BU-21771; Knowles Acoustics) or contact microphone (K & K Sound Hot Spot; K&K Sound Systems) was placed with double-sided adhesive on the anterior surface of the neck, superior to the sternal notch and inferior to the cricoid cartilage. Neck-surface recordings were employed in this study to provide a cleaner signal during the onset of vocal fold vibration in the postplosive vowel. Specifically, the headset microphone signal is subject to environmental noise and bursts of high-frequency energy from plosive aspiration noise, whereas the neck-surface signals can be impervious to much of this additive noise (Hillman et al., 2006).
Acoustic recordings were made in either (a) a sound-treated room at Boston University or (b) a quiet office at Boston Medical Center. Acoustic recordings at Boston University were acquired with SONAR acoustical software on a desktop computer. Recordings at Boston Medical Center were acquired with a digital handheld audio recorder (H4N Handy Portable Recorder; Zoom). All data acquired from the headset microphone, neck-surface accelerometer, and contact microphone were digitized at a sampling rate of 44.1 KHz and 16 bits.
Data Processing
All recordings were analyzed using Praat acoustic analysis software (Versions 6.0.19 and 6.0.43). VOT was measured by visually inspecting the acoustic waveform from the headset microphone, the waveform from the neck-surface signal (accelerometer or contact microphone), and a wideband spectrogram constructed from both signals. In accordance with previous research, VOT measurement began at the onset of the noise burst from each plosive release and ended at the point of vocal vibration (Francis et al., 2003; McCrea & Morris, 2005). The onset of the noise burst was visually determined using the headset microphone signal. The start of acoustic vocal fold vibration was determined by identifying the first consistent vocal cycle of the waveform using the neck-surface signal; the time point selected to mark this event was chosen as the location at which the waveform crossed the x-axis. Figure 1 provides an example of signals from a headset microphone and neck-surface accelerometer, with the VOT segment identified. Utterances were excluded from analysis when the noise burst was absent or if voicing began prior to the initiation of the plosive release.
Figure 1.

Example of a headset microphone (A) and a neck-surface accelerometer signal (B). The production is of the utterance /uku/ by Participant C24. The voice onset time segment is highlighted (duration of 83 ms). The plosive burst was identified in the microphone signal, and the vocal cycles corresponding to voice onset were identified with assistance of the accelerometer signal.
Reliability of VOT extraction. Two researchers completed data extraction. Prior to data extraction, both researchers completed training on 108 VOT utterances extracted from participants in the study to provide a relevant training sample. Interrater reliability between the two researchers on the training was considered excellent (Koo & Li, 2016) with an ICC for consistency (ICC[2,1]) of .99. Once training was completed, the researchers then extracted experimental data.
Researcher 1 extracted experimental data from 14 participants with VH and 14 controls. For intrarater reliability purposes, Researcher 1 re-extracted VOT data from four randomly selected participants (two with VH, two controls) at least 1 month following the original data extraction (blinded to the original VOT values). Intrarater reliability for Researcher 1 was excellent with an ICC(2,1) value of .99. Researcher 2 extracted experimental data from the remaining participants (18 with VH, 18 controls). Intrarater reliability for re-extracted data (blinded, at least 1 month after the original extraction) from four participants revealed an ICC = .97. Finally, a third trained technician extracted VOT from four randomly selected participants from the entire experimental data set (which included participants who were analyzed by Researchers 1 and 2), yielding an interrater reliability of ICC = .99.
Measures
Once VOT was measured for each utterance, mean VOT was determined by averaging the three repetitions per utterance (i.e., a single mean VOT value for a set of three “say /ɑpɑ/ again”). On average, there were 2.77 repetitions averaged per utterance. In order to characterize variability in the VOT productions, a coefficient of variation (CoV) was calculated for each VCV VOT set (e.g., a CoV value for the three repetitions of /upu/). The mean VOT and the standard deviation of the three utterances were calculated to determine CoV (see Equation 1). In situations in which there was only one VOT utterance available within a VCV set, a standard deviation could not be determined and the subsequent CoV could not be calculated. In these cases, the VOT data point was still used in the statistical analysis, though the CoV was missing.
| (1) |
Statistical Analysis
Two separate analyses of variance (ANOVAs) were calculated to analyze mean VOT and CoV. Main effects for each model included group (VH, control), plosive voicing (voiced, voiceless), vowel (/ɑ/, /u/), and plosive place of articulation (bilabial, alveolar, velar). All two-, three-, and four-way interactions between these effects were examined. Although we were primarily interested in interaction effects that included the variable “group,” we included all lower order interactions from the four-way interaction of Group × Plosive Voicing × Vowel × Plosive Place of Articulation. Significance was set a priori to p < .05, and partial eta squared (ηp 2) was calculated as an effect size metric for each significant effect. Tukey's post hoc analysis was calculated for main effects, as indicated, with adjusted p value set to .05. Tukey's post hoc testing adjusts the familywise error rate when multiple comparisons are made, reducing the possibility of Type I error.
Exploratory analysis. Following our planned analysis, we completed exploratory analyses. For further analysis of mean VOTs, we identified subsets of speakers with more pronounced vocal symptoms. We identified speakers with VH who presented with at least mild dysphonia on the day of testing, operationally defined as having CAPE-V ratings of overall severity ≥ 25. Separately, we identified speakers with VH with scores ≤ 75 on the V-RQOL, indicating a greater impact of voice problems in their daily lives. We then compared mean VOTs between each of these subsets and their matched controls. We calculated two separate two-way ANOVAs that included group (VH, control), plosive voicing (voiced, voiceless), and the interaction of Group × Plosive Voicing. We decided to complete two separate analyses because CAPE-V ratings and VRQOL scores are not always strongly correlated with one another (Karnell et al., 2007). As such, the relationship between CAPE-V ratings and V-RQOL scores for speakers with VH in this study was considered weak with a Pearson product–moment correlation coefficient of r = −.33.
We completed further analysis on all participants with VH and their CoV values. We examined the impact of VH subtype on CoV values via a two-way ANOVA between the main effects of plosive voicing (voiced, voiceless) and VH subtype (NPVH, PVH), as well as their interaction. Furthermore, we averaged all voiced plosive CoV values and all voiceless plosive CoV values separately for each participant with VH and correlated each to (a) participant age (in years) and (b) overall dysphonia severity ratings made on the CAPE-V. Pearson product–moment correlation values and p values were calculated. Alpha criterion was set to .05 for each exploratory analysis, and effect sizes (ηp 2) were calculated as indicated. All statistical analyses were completed in Minitab Statistical software (Ver. 18).
Results
Summary Statistics
VOT and CoV values are reported in Table 1. Data were missing for 1% of mean VOT values (two /ubu/ and two /ɑbɑ/) and 3% of CoV values (five /ugu/, four /ubu/, and three /ɑbɑ/ productions) for the controls. Participants with VH were missing 4% of mean VOT values (five /ɑdɑ/, three /ɑbɑ/, two /ubu/, two /udu/, two /ugu/, and one /ɑgɑ/) and 9% of CoV values (ten /ubu/, seven /ɑbɑ/, five /udu/, six /ɑdɑ/, five /ugu/, and three /ɑgɑ/). All missing data were from voiced productions; the most common reason for missing data was because of voicing prior to the release of the plosive segment. The incidence of voicing prior to the burst of the plosive is consistent with previous work that reports the finding in 4% of healthy adult samples (McCrea & Morris, 2005). Frequently, we observed continuous voicing throughout the entire plosive segment, precluding identification of the onset of vocal vibration. Please refer to Figure A1 in the Appendix for an example of continuous voicing throughout the plosive segment.
Table 1.
Mean and standard deviation of mean voice onset time (VOT) and coefficient of variation (CoV) for the groups combined (overall) as well as each group individually (control and vocal hyperfunction [VH]).
| VCV utterance | Mean VOT (ms) |
CoV |
|||||
|---|---|---|---|---|---|---|---|
| Overall | Control | VH | Overall | Control | VH | ||
| Voicing | Voiced | 18 (6) | 17 (5) | 19 (6) | .24 (.13) | .21 (.08) | .26 (.16) |
| Voiceless | 64 (17) | 64 (18) | 63 (15) | .15 (.08) | .14 (.09) | .15 (.06) | |
| Vowel | /ɑ/ | 34 (9) | 33 (10) | 35 (9) | .19 (.08) | .18 (.06) | .21 (.08) |
| /u/ | 48 (11) | 48 (13) | 48 (10) | .18 (.08) | .17 (.09) | .19 (.07) | |
| Place of articulation | Bilabial | 32 (12) | 32 (12) | 32 (11) | .24 (.11) | .22 (.09) | .26 (.13) |
| Alveolar | 47 (12) | 46 (12) | 48 (11) | .16 (.07) | .15 (.08) | .17 (.06) | |
| Velar | 44 (11) | 43 (12) | 45 (9) | .17 (.09) | .15 (.09) | .18 (.08) | |
Note. VCV = vowel–consonant–vowel.
Mean VOT Analysis
Mean VOT data met the assumptions of the planned ANOVA (e.g., normality, homogeneity of variance). ANOVA results can be found in Table 2. Results revealed no main effect of group (p = .703). There were significant main effects of plosive voicing, plosive place of articulation, and vowel (all ps < .001), with large and medium effect sizes. Specifically, voiceless plosives had significantly longer VOT durations compared to voiced plosives (64 vs. 18 ms, respectively), and /ɑ/ resulted in shorter VOTs (M = 34 ms) compared to /u/ (M = 48 ms). Post hoc analysis for the main effect of plosive place of articulation (bilabial, alveolar, velar) revealed that bilabial plosives resulted in significantly shorter mean VOTs compared to alveolar (p adj < .001) and velar (p adj < .001) plosives. Of all interaction effects examined, only Plosive Voicing × Plosive Place of Articulation and Plosive Voicing × Vowel were significant. All pairwise comparisons for these two interaction effects were significantly different from one another except for two comparisons: Alveolar voiced plosives were no different from bilabial voiced and velar voiced plosives in the interaction effect between Plosive Voicing × Plosive Place of Articulation (see Figure A2 in the Appendix for interaction plots).
Table 2.
Results of analysis of variance for mean voice onset time (VOT) and coefficient of variation (CoV).
| Measure | Effect | df | F | p | Effect size (ηp 2) | Effect size interpretation |
|---|---|---|---|---|---|---|
| Mean VOT | Group | 1 | 0.15 | .703 | — | — |
| Voicing | 1 | 1504.40 | < .001 | .68 | Large | |
| Pl. of Artic. | 2 | 57.63 | < .001 | .14 | Medium | |
| Vowel | 1 | 135.37 | < .001 | .16 | Medium | |
| Group × Voicing | 1 | 1.08 | .229 | — | — | |
| Group × Pl. of Artic. | 2 | 0.63 | .531 | — | — | |
| Group × Vowel | 1 | 0.26 | .608 | — | — | |
| Voicing × Pl. of Artic. | 2 | 29.57 | < .001 | .08 | Medium | |
| Voicing × Vowel | 1 | 40.67 | < .001 | .05 | Small–medium | |
| Pl. of Artic. × Vowel | 2 | 0.72 | .486 | — | — | |
| Group × Voicing × Pl. of Artic. | 2 | 1.31 | .270 | — | — | |
| Group × Voicing × Vowel | 1 | 0.02 | .896 | — | — | |
| Group × Pl. of Artic. × Vowel | 2 | 1.05 | .349 | — | — | |
| Voicing × Pl. of Artic. × Vowel | 2 | 0.01 | .992 | — | — | |
| Group × Voicing × Pl. of Artic. × Vowel | 2 | 0.05 | .950 | — | — | |
| CoV | Group | 1 | 7.61 | .006 | .01 | Small |
| Voicing | 1 | 61.64 | < .001 | .08 | Medium | |
| Pl. of Artic. | 2 | 20.07 | < .001 | .05 | Small–medium | |
| Vowel | 1 | 3.81 | .051 | — | — | |
| Group × Voicing | 1 | 0.04 | .844 | — | — | |
| Group × Pl. of Artic. | 2 | 0.07 | .928 | — | — | |
| Group × Vowel | 1 | 0.32 | .573 | — | — | |
| Voicing × Pl. of Artic. | 2 | 0.46 | .633 | — | — | |
| Voicing × Vowel | 1 | 1.80 | .180 | — | — | |
| Pl. of Artic. × Vowel | 2 | 0.18 | .832 | — | — | |
| Group × Voicing × Pl. of Artic. | 2 | 0.69 | .504 | — | — | |
| Group × Voicing × Vowel | 1 | 0.03 | .870 | — | — | |
| Group × Pl. of Artic. × Vowel | 2 | 0.62 | .540 | — | — | |
| Voicing × Pl. of Artic. × Vowel | 2 | 1.13 | .322 | — | — | |
| Group × Voicing × Pl. of Artic. × Vowel | 2 | 1.26 | .283 | — | — |
Note. Effect sizes and interpretations are reported for significant findings (p < .05). Em dashes indicate nonsignificant findings. Pl. of Artic. = place of articulation.
CoV Analysis
CoV data did not meet the assumption of normality (Ryan–Joiner normality test result of p ≤ .01) and required a log transformation before the planned parametric ANOVA testing. ANOVA results revealed significant main effects of group (p = .006), plosive voicing (p < .001), and plosive place of articulation (p < .001), all with small-to-medium effect sizes (ηp 2 = .01–.08). The group effect was due to significantly larger CoV values for speakers with VH (M = .20) compared to controls (M = .17). CoV values for voiced plosives (M = .24) were significantly larger than CoV for voiceless plosives (M = .15). Post hoc analysis for plosive place of articulation showed that CoV values for bilabial plosives were significantly larger than those for alveolar (p adj < .001) and velar (p adj < .001) plosives. No significant interactions (two- , three-, or four-way) were found. Figure 2 provides the mean and 95% confidence intervals for each group by plosive voicing category for mean VOT and CoV values.
Figure 2.
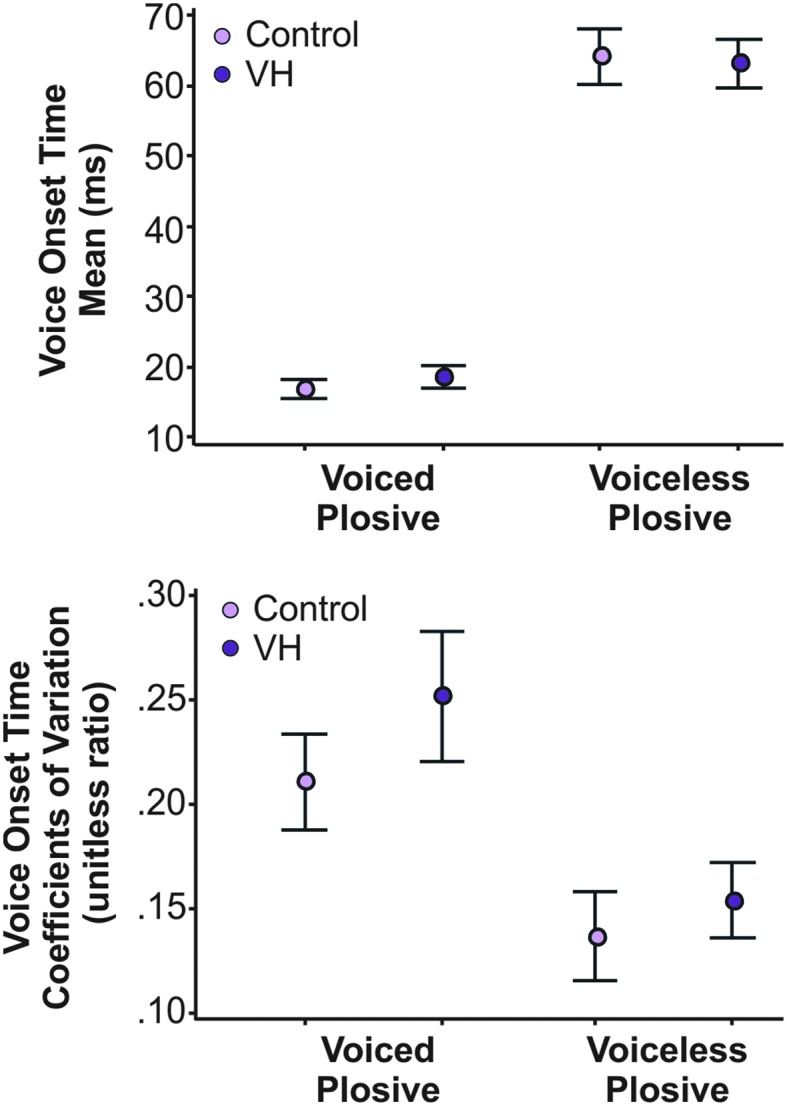
(Top) Mean and 95% confidence interval (CI) of mean voice onset time for speakers with vocal hyperfunction (VH) and healthy controls for voiced and voiceless plosives. (Bottom) Mean and 95% CI for coefficient of variation for controls and speakers with VH for voiced and voiceless plosives.
Exploratory Analysis
Mean VOT
We completed exploratory analyses on two subsets of speakers: (a) speakers with VH who had CAPE-V overall severity ratings ≥ 25 (n = 12) and (b) speakers with VH who had V-RQOL scores ≤ 75 (n = 15). Ten speakers overlapped between the two groups (refer to Table A1 in the Appendix for individual ratings and scores). Data from each subgroup and their matched controls met the assumptions of the planned ANOVAs and did not require transformation.
The results of the ANOVA for speakers with VH who had CAPE-V ratings ≥ 25 revealed a significant effect of group (p = .025); the speakers with VH had significantly shorter mean VOTs (40 ms) compared to their matched controls (45 ms), with a small effect size of ηp 2 = .02. Consistent with the other findings in this study, plosive voicing continued to be a significant effect (p < .001), with shorter voiced plosives compared to voiceless plosives. The interaction between Group × Voicing was also significant (p = .003, ηp 2 = .03), with voiceless plosive durations driving the interaction effect. Post hoc analysis yielded significantly shorter voiceless VOTs (p adj = .001) for speakers with VH (59 ms) compared to the control group (71 ms), but no post hoc group difference for voiced VOTs (p adj = .953). See Figure 3 for mean VOT and 95% CI for the subgroup of speakers with VH and their matched controls.
Figure 3.
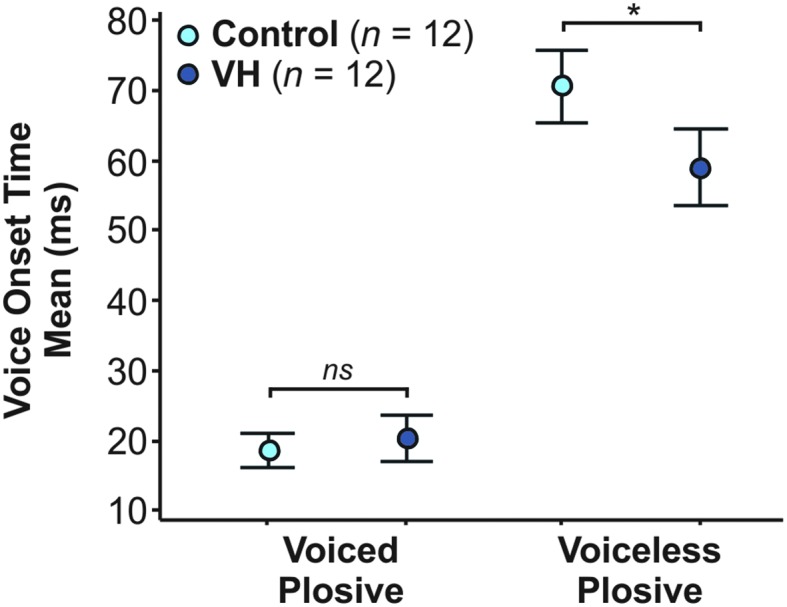
Mean and 95% confidence interval for mean voice onset time (VOT) for a subgroup of 12 speakers with vocal hyperfunction (VH) who had CAPE-V ratings ≥ 25 and their matched controls. The mean VOTs of voiceless plosives were significantly shorter in speakers with VH compared to controls (indicated here by an asterisk), driving the interaction effect in the exploratory analysis. There was no significant (ns) difference for the pairwise comparison of voiced plosives for speakers with and without VH.
ANOVA results for speakers with V-RQOL ≤ 75 revealed no effect of group (p = .154) and no interaction between group and plosive voicing (p = .066). However, there was a significant effect of plosive voicing (p < .001), once again, with voiced VOTs being shorter than voiceless VOTs.
CoV of VOT. CoV values for voiceless plosives were similar between speakers with NPVH and speakers with PVH (M = 0.17 and 0.15, respectively). There was a larger apparent difference between the voiced plosives with larger CoV values for NPVH (M = 0.28) than PVH (M = 0.21). Although the sample sizes between the two groups were uneven (NPVH = 21, PVH = 11), there was homogeneity of variance and CoV values were normally distributed (once log transformed, as previously described), allowing for a parametric ANOVA calculation. ANOVA results showed a significant main effect of plosive voicing (p < .001), with significantly larger CoV values for voiced plosives compared to voiceless plosives. There was no effect of VH subtype (p = .599) and no interaction between VH subtype and plosive voicing (p = .170).
When averaged into a single value, the voiceless plosive CoV and voiced plosive CoV data were normally distributed and did not require further transformation. Pearson product–moment correlation coefficients between age (years) and averaged CoV values were weak with r = −.03 (p = .890) and r = .21 (p = .256) for voiceless and voiced plosives, respectively. Results further showed a moderate positive correlation between overall severity rating on the CAPE-V and averaged voiceless plosive CoV (r = .58, p < .001) and a weak correlation between CAPE-V rating and averaged voiced plosive CoV (r = .12, p = .523).
Discussion
This study sought to examine VH using the phonemic voicing target VOT. We hypothesized that speakers with VH would exhibit shorter VOT durations when compared to age- and sex-matched controls, which would be characteristic of increased laryngeal muscle tension. This hypothesis was not supported by our initial analysis; however, there was preliminary evidence for shorter voiceless VOTs in a subset of speakers with perceived dysphonia, defined as CAPE-V overall severity rating ≥ 25. We further hypothesized that speakers with VH would exhibit more variable VOTs compared to vocally healthy controls, based on recent work that identified auditory–motor integration deficits in a subset of speakers with VH (Stepp et al., 2017). Our hypothesis was supported by our analysis when speakers with VH had significantly larger CoV values (an index of VOT variability) compared to controls, providing further support for disordered vocal motor control in VH.
Laryngeal Tension in Hyperfunctional Voice Disorders
The averaged voiced plosive VOT across all places of articulation (18 ms) was within a normal range reported in previous works (Forrest et al., 1989; Klatt, 1975; Lisker & Abramson, 1964; McCrea & Morris, 2005). The average voiceless plosive VOT (64 ms) was on the lower end of the previously reported ranges (Lisker & Abramson, 1964; Morris et al., 2008; Ryalls et al., 2004) and, in some cases, more than 10 ms shorter in duration when compared to other reported values (Baum & Ryan, 1993; Ryalls et al., 1997; Sweeting & Baken, 1982). The shorter voiceless VOT could be due to the midvocalic placement of the plosive (as many previous studies examined plosives in the initial position) or possible methodological differences in VOT extraction. Overall, the significant main effects of voicing, vowel, and place of articulation for VOT values were expected and consistent with previous studies (Klatt, 1973, 1975; McCrea & Morris, 2005; Morris et al., 2008; Port & Rotunno, 1979; Volaitis & Miller, 1992).
We hypothesized that speakers with VH would have significantly shorter VOT durations compared to vocally healthy controls as a result of increased laryngeal tension—a hallmark feature of VH. Contrary to our first hypothesis, VOT values were not significantly different between speakers with and without VH in the large group analysis. Although these results imply that speakers with VH do not exhibit excessive laryngeal tension, we thought that was unlikely given the clinical presentation is characterized by excessive and imbalanced tension. Our exploratory analyses of more severe cases of VH (i.e., those with CAPE-V rating ≥ 25) revealed a significant group effect as well as an interaction effect between group and plosive voicing. Combined, these results indicated that voiceless VOTs were significantly shorter in this subgroup of speakers with VH than their matched controls, mirroring the findings of previous works reporting shorter voiceless VOT in healthy adults who purposefully increased pitch (McCrea & Morris, 2005; Narayan & Bowden, 2013).
The mechanisms underlying purposeful increases in pitch in healthy subjects and excessive laryngeal tension in those with VH likely overlap (i.e., tension in cricothyroids, suprahyoids, and/or intrinsic adductory muscles). Participants with VH who had more pronounced dysphonia could have exhibited increased laryngeal tension to a degree that impacted not only their vocal quality but also our measurement of VOT. Conversely, our analyses of speakers with VH with self-reported voice problems (V-RQOL scores ≤ 75) did not show significantly shorter mean VOTs compared to their matched controls. This subset of speakers could have had voice symptoms (e.g., vocal fatigue, laryngeal pain, and excessive vocal effort) that were not as strongly associated with elevated laryngeal tension and thus had symptoms that did not impact mean VOT values.
Alternatively, the laryngeal muscle tension observed and reported in speakers with VH may not impact specific temporal acoustic measures in a consistent way. It is well known that speakers with VH are a heterogeneous patient population (Altman et al., 2005). Besides the possibility of increased tension in cricothyroids, suprahyoids, and/or intrinsic adductory muscles, patients with VH may present with excessive tension in the infrahyoid muscles, additional strap musculature (e.g., sternocleidomastoid), respiratory muscles, oral (lip/tongue) muscles, and/or abductory intrinsic laryngeal muscles. Excessive laryngeal and body-based tension could act in isolation or combination to affect the duration of VOT differently. For example, VOT has been shown to be significantly longer in speakers with abductor spasmodic dysphonia compared to vocally healthy speakers (Edgar et al., 2001; Yanagida et al., 2015) due to dystonia in the abductory posterior cricoarytenoid muscle impacting coordination of abduction, adduction, and voicing onset. Moreover, studies examining VOT in speakers with Parkinson's disease, a disorder that presents as dysarthria as well as stiffness/bowing of the vocal folds (Perju-Dumbrava et al., 2017), are equivocal. Studies showed longer, shorter, or similar VOTs when speakers with Parkinson's disease were directly compared to matched controls (Fischer & Goberman, 2010; Flint et al., 1992; Forrest et al., 1989). Furthermore, the only previous study that examined VOT in speakers with VH (n = 5 speakers with PVH) reported a trend for longer VOTs (Marciniec, 2009). As such, mean VOT may not be a consistent indicator of laryngeal tension in a larger sample of speakers with VH.
Of note, however, we did not assess laryngeal muscle tension in our study and therefore cannot report the presence and degree of tension in our sample. Further work should consider adding an assessment of laryngeal muscle tension (e.g., laryngeal imaging, electromyography, digital palpation, or patient-reported symptoms) in order to determine whether VOT is a sensitive metric of tension.
Disordered Vocal Motor Control in Hyperfunctional Voice Disorders
Supporting our second hypothesis, we found statistically significant differences in the CoV of VOTs between speakers with VH and age- and sex-matched controls. VOT CoV values in speakers with VH were larger compared to individuals who were vocally healthy. These experimental results provide further evidence for increased vocal variability for a phonemically based voicing target during more natural speech contexts.
Stepp et al. (2017) hypothesized that auditory–motor integration deficits may be an etiological factor contributing to VH. When provided altered auditory feedback, a subset of speakers with VH exhibited inappropriate feedforward vocal control and a perturbation response in opposition to those found in adults who are vocally healthy. Furthermore, the work by Tam et al. (2018) showed that individuals with VH had reduced auditory discrimination abilities, further supporting the notion that individuals with VH have larger ranges of auditory targets. Our results add to the previous literature by establishing greater vocal variability in individuals with VH, as evidenced by statistically significant larger VOT CoVs. We suspect that larger auditory targets result in increased vocal variability and impact the ability to detect auditory errors. According to the DIVA model, the ability to detect and correct auditory errors is necessary to appropriately update feedforward control systems. Thus, inappropriate updating of feedforward vocal motor control reported in some speakers with VH could be due to inappropriate auditory representations. If so, there may be a neurological predisposition for impairment in vocal auditory–motor control in speakers with VH.
The framework developed by Hillman et al. (1989) identifies a precipitating event to initiate a cycle of abnormal phonatory behavior that is primarily characterized by increased laryngeal tension. In this framework, increased laryngeal muscle tension persists even when the event subsides. We propose that some individuals with VH have a central deficit that is exacerbated by a vocal event and contributes to the persistence of their maladaptive vocal patterns. As such, the etiology of VH could include a combination of larger auditory targets, greater vocal variability, and maladaptive updating of feedforward vocal motor control. An in-depth analysis of the relationship between deviations in auditory discrimination and sensorimotor adaptation responses is needed to investigate this theory further.
Exploratory Analysis of VOT Variability
We completed additional exploratory analyses to determine which factors may be contributing to larger CoV values in speakers with VH. First, we evaluated whether the subtypes of VH (PVH, NPVH) resulted in different levels of VOT variability. Prior research indicates that the two subtypes of VH are physiologically distinct from one another. Espinoza et al. (2017) confirmed previous findings of the study of Hillman et al. (1989), which detailed these subtypes. The results from Espinoza et al. showed that speakers with PVH exhibited increases in a series of glottal flow parameters (i.e., open quotient, maximum flow declination rate, peak-to-peak amplitude of the unsteady airflow, and subglottal pressure) compared to a matched-cohort control group, whereas speakers with NPVH only exhibited increases in open quotient and subglottal pressure estimates compared to their matched control group. Furthermore, another study utilized the acoustic measure of relative fundamental frequency to distinguish between subtypes of VH. Findings indicated that speakers with PVH exhibited significantly lower voicing offset cycles (measured in semitones) and tended to have lower onset cycle 1 values compared to speakers with NPVH (Heller Murray et al., 2017). Despite this evidence, our results showed no significant differences in variability between the two subtypes of VH. VOT is a relatively simple duration measure and may not be sensitive to cycle-to-cycle vibrational changes that distinguish the subtypes of VH. Still, our study enrolled a relatively small cohort of individuals with NPVH (n = 11). A larger sample may be required to find differences between the two groups, if they exist.
Next, we examined the relationship between CoV and participant age. We enrolled participants across a large age range greater than 50 years (22–74 years), in which it was possible that age-related changes could have contributed to the variability reported. Sweeting and Baken (1982) reported that VOTs did not vary by age but that the standard deviation of the VOTs was significantly greater in speakers aged 65–74 years compared to a cohort of speakers aged 25–39 years. In our analysis, the correlations between age and CoV were weak for both voiced and voiceless plosives, indicating that age was not contributing to variability in this study.
Within these exploratory analyses, the only evidence for a predictor of VOT variability was the overall severity rating made using the CAPE-V. Specifically, larger voiceless CoVs were moderately correlated with greater dysphonia severity (r = .58), whereas the correlations between voiced CoV and CAPE-V ratings were weak (r = .12). Voiced VOTs are less affected by prosody and speech rate and must be shorter than 30 ms to be perceived as “voiced” by listeners (Kessinger & Blumstein, 1997). Likely, voiced VOTs are more constrained than voiceless VOTs.
Researchers have proposed that voiceless VOTs require greater temporal coordination between the laryngeal and supralaryngeal structures compared to voiced VOTs (Whiteside & Marshall, 2001). When children are acquiring VOT contrasts, they default to voicing the voiceless plosives and do not develop adultlike patterns until at least 6 years of age (Gilbert & Purves, 1977; Kewley-Port & Preston, 1974; Zlatin & Koenigsknecht, 1976). Likewise, speakers with profound hearing loss have reduced contrasts in VOT category distinctions, with the tendency to produce shorter voiceless VOTs (Lane & Perkell, 2005; Lane et al., 1994). Furthermore, there is a trend for phonemic boundaries between /p/ and /b/ to decrease with age in healthy speakers (Neiman et al., 1983; Sweeting & Baken, 1982); specifically, the VOTs from /p/ productions have shorter durations. This suggests that voiceless VOTs are sensitive to less stable speech systems across various patient populations, including maturational and aging effects in healthy speakers. Given these exploratory analyses were not the original intent of this work, future studies are needed to determine whether variation in voiceless plosives is, indeed, a robust marker for variability in vocal motor control. Further work should investigate the relationships among variability, perception of vocal quality, categorical perception of phonemic boundaries, and allophonic variance in voice disordered speech.
Limitations and Future Directions
A limiting factor to the generalization of the present findings was our restriction to only female participants. Our decision was based on the increased incidence of voice disorders in females compared to males (Coyle et al., 2001; Roy et al., 2005) and the general knowledge that speakers with VH are a heterogeneous patient population. With equivocal findings on whether VOT is further impacted by sex due to possible anatomical- and/or sociolinguistic-based differences (Morris et al., 2008; Robb et al., 2005; Ryalls et al., 1997; Whiteside & Marshall, 2001), we decided to analyze a more homogenous group, limiting to female participants. We suggest future studies examine VOT across both male and female speakers.
Another limitation to this study is the missing data from voiced plosives for speakers with VH. In our sample, 4% of voiced VOTs were excluded in the VH group, mostly due to continuous voicing or “voicing lead” (i.e., voice that begins prior to the burst release of the plosive), whereas only 1% of controls' utterances were excluded for this reason. Voicing lead in the English language is not a phonetically relevant acoustic property because there is a binary categorization of voiced and voiceless phonemes (unlike other languages that have a third VOT category that includes a voicing lead distinction). As such, voicing lead is likely a normal variant of voiced VOT in adult speakers (Lisker & Abramson, 1964; Ryalls et al., 1997; Zlatin & Koenigsknecht, 1976), especially in VCV utterances (Davidson, 2016). In this study, 47% of speakers with VH (15 out of 32 participants) and 31% of controls (10 out of 32 participants) were missing at least one value for statistical analysis due to voicing lead. This higher incidence of voicing lead in those with VH could be investigated further. It has been hypothesized that voiced plosives may have voicing lead as a strategy to increase the distinction between voiced and voiceless plosives (Lisker & Abramson, 1964). Moving forward, it may be beneficial to account for instances of voicing lead in VOT measures in speakers with VH. Whether speakers and listeners perceive these productions as phonemically ambiguous or as contributing to the perceptual severity of dysphonia requires further inquiry as well.
Prior work investigating VOT most often used a microphone signal to identify both the plosive burst and the first vocal cycle of the postplosive vowel. The exact method to reduce overall variability and increase accuracy in identifying the first acoustic cycle of vocal fold vibration is still debated in the literature, with a variety of identification methods employed across different studies (Francis et al., 2003; Klatt, 1975; Lisker & Abramson, 1964). In addition to the microphone, we elected to incorporate a neck-surface signal (i.e., accelerometer, contact microphone) to assist in identifying the first vocal cycle. A neck-surface signal is less affected by environmental and aspiration noise than a headset microphone signal. As a result, the vocal cycle marking the start of the postplosive vowel was easier to distinguish in the neck-surface signal compared to the headset microphone signal. Our ICC values were considered excellent for both interrater and intrarater reliability (ICC range = .97–.99), and therefore, we are confident in our use of neck-surface signals to assist in identifying the initial voicing cycle of the postplosive vowel.
VOT and CoV of VOT are not yet ready for clinical application. We suggest an investigation into VOT measures both before and after voice therapy in a large cohort of speakers with VH. This could reveal answers to some questions raised in this study, such as whether voiceless VOT is a robust marker of vocal motor control in speakers with VH and whether there are additional patient factors (e.g., duration of disorder) that are related to VOT measures. It may be that there are specific patient profiles wherein VOT measures are an appropriate clinical marker of progress, but more work is needed to determine whether VOT will be clinically meaningful. In the same regard, an analysis that includes a wider range of speech samples (readings, monologues) may yield important information on the types of VOT stimuli best suited for clinical monitoring.
Currently, there is no direct link between auditory–motor integration deficits and the development of VH. Although we hypothesize that auditory integration deficits are a precursor to the development of the disorder in some patients, it is possible that having a voice disorder may impact the sensory–motor integration needed for appropriate feedback and feedforward function (Naunheim et al., 2019). An in-depth analysis of auditory discrimination, vocal variability, sensorimotor adaptation, and reflex responses is a necessary next step to elucidate the interplay between auditory–motor integration deficits and vocal behavior. Only then will we be able to add to the existing framework of the etiology of VH.
Conclusion
In our large group analysis, mean VOT values were not different between speakers with and without VH; however, in a subgroup of speakers with more severe dysphonia (n = 12), there were significantly shorter voiceless VOTs compared to matched controls, suggesting increased laryngeal tension. Furthermore, speakers with VH had significantly more variable VOT durations, indicating greater vocal variability and providing evidence for larger auditory targets. Exploratory analysis revealed that overall vocal severity ratings on the CAPE-V for speakers with VH were moderately correlated with increased variability in voiceless VOTs (r = .58). More experimental data are needed to support the growing hypothesis that people with VH may have auditory–motor integration deficits contributing to difficulty with vocal motor control. We suspect that it may justify an extension to the current framework describing the etiology and pathophysiology of VH.
Acknowledgments
This work was supported by Grants R01DC015570, P50DC015446, T32DC000030, and T32DC013017 from the National Institute on Deafness and Other Communication Disorders. We would like to thank Daniel Buckley and Kimberly Dahl for their assistance with data processing. Parts of this article were presented at the American Speech-Language-Hearing Association Convention in Boston, MA, on November 15, 2018.
Appendix
Table A1.
Demographic characteristics of individuals with vocal hyperfunction (VH) and age/sex-matched controls (C).
| Participant with VH | Diagnosis | Age (years) | Hearing screen | V-RQOL | CAPE-V | Matched control | Age (years) | Hearing screen | V-RQOL |
|---|---|---|---|---|---|---|---|---|---|
| VH01 | NPVH | 24 | Pass | n/a | 11 | C01 | 25 | Pass | 100 |
| VH02 | PVH | 31 | Pass | 80 | 32 | C02 | 26 | Pass | 97.5 |
| VH03 | NPVH | 74 | n/a | 100 | 19 | C03 | 73 | ** | 100 |
| VH04 | NPVH | 63 | n/a | 95 | 8 | C04 | 64 | Pass | 97.5 |
| VH05 | NPVH | 40 | n/a | 92.5 | 6 | C05 | 45 | n/a | 100 |
| VH06 | NPVH | 56 | n/a | 2.5 | 32 | C06 | 51 | Pass | 100 |
| VH07 | PVH | 47 | n/a | 100 | 25 | C07 | 48 | Pass | 85 |
| VH08 | NPVH | 38 | Pass | 65 | 48 | C08 | 34 | Pass | 100 |
| VH09 | NPVH | 36 | Pass | 92.5 | 21 | C09 | 32 | ** | 100 |
| VH10 | PVH | 27 | Pass | 42.5 | 28 | C10 | 26 | Pass | n/a |
| VH11 | NPVH | 36 | Pass | 90 | 13 | C11 | 31 | Pass | 100 |
| VH12 | PVH | 20 | Pass | 70 | 8 | C12 | 20 | Pass | 92.5 |
| VH13 | NPVH | 35 | Pass | 55 | 7 | C13 | 30 | Pass | 97.5 |
| VH14 | PVH | 28 | Pass | 82.5 | 11 | C14 | 25 | Pass | 100 |
| VH15 | NPVH | 32 | Pass | 62.5 | 34 | C15 | 27 | Pass | 100 |
| VH16 | NPVH | 21 | Pass | 62.5 | 4 | C16 | 20 | Pass | 97.5 |
| VH17 | NPVH | 21 | Pass | 80 | 7 | C17 | 21 | Pass | 97.5 |
| VH18 | PVH | 20 | Pass | 90 | 7 | C18 | 20 | Pass | 100 |
| VH19 | PVH | 20 | Pass | 65 | 27 | C19 | 20 | Pass | 97.5 |
| VH20 | PVH | 31 | Pass | 62.5 | 20 | C20 | 28 | Pass | 95 |
| VH21 | PVH | 52 | n/a | 65 | 30 | C21 | 57 | Pass | 100 |
| VH22 | NPVH | 63 | n/a | 75 | 42 | C22 | 62 | Pass | 97.5 |
| VH23 | NPVH | 28 | n/a | 90 | 2 | C23 | 26 | Pass | 100 |
| VH24 | NPVH | 42 | Pass | 67.5 | 25 | C24 | 37 | Pass | n/a |
| VH25 | NPVH | 66 | Pass | 70 | 27 | C25 | 66 | Pass | 97.5 |
| VH26 | NPVH | 43 | Pass | 95 | 23 | C26 | 42 | Pass | 100 |
| VH27 | NPVH | 25 | Pass | 100 | 11 | C27 | 25 | Pass | 100 |
| VH28 | PVH* | 39 | Pass | 87.5 | 24 | C28 | 34 | Pass | 97.5 |
| VH29 | NPVH | 35 | Pass | 90 | 21 | C29 | 33 | n/a | 100 |
| VH30 | PVH | 21 | Pass | 72.5 | 28 | C30 | 21 | Pass | 97.5 |
| VH31 | NPVH | 40 | Pass | 62.5 | 10 | C31 | 36 | n/a | 100 |
| VH32 | NPVH | 74 | ** | 82.5 | 9 | C32 | 71 | Pass | 100 |
Note. All participants with PVH had vocal fold nodules except for VH28 who was diagnosed with vocal fold scar, indicated by an asterisk (*). Hearing screenings were completed with pulsed pure tones for 1–2 s via insert or over-the-ear headphones. Pass for < 50 years of age: 25 dB HL at 1, 2, 4, and 8 kHz, and 125, 250, and 500 Hz. Pass for ≥ 50 years of age: 25 dB at 1 kHz and below, and 40 dB at 2 and 4 kHz. The double asterisks (**) indicate an adjustment to the participant's threshold. VH32 met threshold criterion for 1, 2, and 4 kHz, except for her right ear that did not meet threshold at 4 kHz. Her thresholds for 125, 250, and 500 Hz were 30 dB for both ears except for 125 Hz in her left ear, which met criterion at 25 dB HL. C03 passed at frequencies of 1 kHz and above but had a threshold of 30 dB at 1 kHz for her left ear and had a 35- to 45-dB threshold range at 125, 250, and 500 Hz. C09 passed at all frequencies but had a 30-dB threshold in her left ear and a 35-dB threshold in her right ear at 8 kHz. V-RQOL = Voice-Related Quality of Life questionnaire; CAPE-V = Consensus Auditory–Perceptual Rating of Voice; NPVH = nonphonotraumatic vocal hyperfunction; n/a = not assessed; PVH = phonotraumatic vocal hyperfunction.
Figure A1.

Examples of two repetitions of the utterance /ugu/ by Participant VH31. (A) The voice onset time (VOT) segment is shaded (duration of 46 ms). (B) VOT could not be determined due to an absent plosive burst as well as continuous voicing throughout the /g/ production, as seen in both the headset microphone and neck-surface accelerometer signals.
Figure A2.

Interaction plots for Plosive Voicing × Plosive Place of Articulation and Plosive Voicing × Vowel for mean voice onset time (VOT) values and 95% confidence interval. All post hoc comparisons were significantly different from one another except for two comparisons: Mean VOTs for voiced alveolar plosives were no different from voiced bilabial and voiced velar plosives (left graph).
Funding Statement
This work was supported by Grants R01DC015570, P50DC015446, T32DC000030, and T32DC013017 from the National Institute on Deafness and Other Communication Disorders.
References
- Altman K. W., Atkinson C., & Lazarus C. (2005). Current and emerging concepts in muscle tension dysphonia: A 30-month review. Journal of Voice, 19(2), 261–267. https://doi.org/10.1016/j.jvoice.2004.03.007 [DOI] [PubMed] [Google Scholar]
- Angsuwarangsee T., & Morrison M. (2002). Extrinsic laryngeal muscular tension in patients with voice disorders. Journal of Voice, 16(3), 333–343. https://doi.org/10.1016/S0892-1997(02)00105-4 [DOI] [PubMed] [Google Scholar]
- Bauer J. J., & Larson C. R. (2003). Audio-vocal responses to repetitive pitch-shift stimulation during a sustained vocalization: Improvements in methodology for the pitch-shifting technique. The Journal of the Acoustical Society of America, 114(2), 1048–1054. https://doi.org/10.1121/1.1592161 [DOI] [PMC free article] [PubMed] [Google Scholar]
- Bauer J. J., Mittal J., Larson C. R., & Hain T. C. (2006). Vocal responses to unanticipated perturbations in voice loudness feedback: An automatic mechanism for stabilizing voice amplitude. The Journal of the Acoustical Society of America, 119(4), 2363–2371. https://doi.org/10.1121/1.2173513 [DOI] [PMC free article] [PubMed] [Google Scholar]
- Baum S. R., & Ryan L. (1993). Rate of speech effects in aphasia: Voice onset time. Brain and Language, 44(4), 431–445. https://doi.org/10.1006/brln.1993.1026 [DOI] [PubMed] [Google Scholar]
- Behroozmand R., & Sangtian S. (2018). Neural bases of sensorimotor adaptation in the vocal motor system. Experimental Brain Research, 236(7), 1881–1895. https://doi.org/10.1007/s00221-018-5272-9 [DOI] [PubMed] [Google Scholar]
- Burnett T. A., Freedland M. B., Larson C. R., & Hain T. C. (1998). Voice F0 responses to manipulations in pitch feedback. The Journal of the Acoustical Society of America, 103(6), 3153–3161. https://doi.org/10.1121/1.423073 [DOI] [PubMed] [Google Scholar]
- Burnett T. A., Senner J. E., & Larson C. R. (1997). Voice F0 responses to pitch-shifted auditory feedback: A preliminary study. Journal of Voice, 11(2), 202–211. https://doi.org/10.1016/S0892-1997(97)80079-3 [DOI] [PubMed] [Google Scholar]
- Coyle S. M., Weinrich B. D., & Stemple J. C. (2001). Shifts in relative prevalence of laryngeal pathology in a treatment-seeking population. Journal of Voice, 15(3), 424–440. https://doi.org/10.1016/S0892-1997(01)00043-1 [DOI] [PubMed] [Google Scholar]
- Davidson L. (2016). Variability in the implementation of voicing in American English obstruents. Journal of Phonetics, 54, 35–50. https://doi.org/10.1016/j.wocn.2015.09.003 [Google Scholar]
- Edgar J. D., Sapienza C. M., Bidus K., & Ludlow C. L. (2001). Acoustic measures of symptoms in abductor spasmodic dysphonia. Journal of Voice, 15(3), 362–372. https://doi.org/10.1016/S0892-1997(01)00038-8 [DOI] [PubMed] [Google Scholar]
- Espinoza V. M., Zañartu M., Van Stan J. H., Mehta D. D., & Hillman R. E. (2017). Glottal aerodynamic measures in women with phonotraumatic and nonphonotraumatic vocal hyperfunction. Journal of Speech, Language, and Hearing Research, 60(8), 2159–2169. https://doi.org/10.1044/2017_JSLHR-S-16-0337 [DOI] [PMC free article] [PubMed] [Google Scholar]
- Fischer E., & Goberman A. M. (2010). Voice onset time in Parkinson disease. Journal of Communication Disorders, 43(1), 21–34. https://doi.org/10.1016/j.jcomdis.2009.07.004 [DOI] [PubMed] [Google Scholar]
- Flint A. J., Black S. E., Campbell-Taylor I., Gailey G. F., & Levinton C. (1992). Acoustic analysis in the differentiation of Parkinson's disease and major depression. Journal of Psycholinguistic Research, 21(5), 383–399. https://doi.org/10.1007/BF01067922 [DOI] [PubMed] [Google Scholar]
- Forrest K., Weismer G., & Turner G. S. (1989). Kinematic, acoustic, and perceptual analyses of connected speech produced by Parkinsonian and normal geriatric adults. The Journal of the Acoustical Society of America, 85(6), 2608–2622. https://doi.org/10.1121/1.397755 [DOI] [PubMed] [Google Scholar]
- Francis A. L., Ciocca V., & Ching Yu J. M. (2003). Accuracy and variability of acoustic measures of voicing onset. The Journal of the Acoustical Society of America, 113(2), 1025–1032. https://doi.org/10.1121/1.1536169 [DOI] [PubMed] [Google Scholar]
- Franken M. K., Acheson D. J., McQueen J. M., Eisner F., & Hagoort P. (2017). Individual variability as a window on production–perception interactions in speech motor control. The Journal of the Acoustical Society of America, 142(4), 2007 https://doi.org/10.1121/1.5006899 [DOI] [PubMed] [Google Scholar]
- Garaycochea O., Navarrete J. M. A., Del Río B., & Fernández S. (2018). Muscle tension dysphonia: Which laryngoscopic features can we rely on for diagnosis. Journal of Voice, 33(5), 812.e15–812.e18. https://doi.org/10.1016/j.jvoice.2018.04.015 [DOI] [PubMed] [Google Scholar]
- Gilbert J. H. V., & Purves B. A. (1977). Temporal constraints on consonant clusters in child speech production. Journal of Child Language, 4(03), 417–432. https://doi.org/10.1017/S030500090000177X [Google Scholar]
- Guenther F. (2016). Neural control of speech. Cambridge, MA: MIT Press. [Google Scholar]
- Harris K. S., Rubin-Spitz J., & McGarr N. S. (1985). The role of production variability in normal and deviant developing speech. ASHA Reports, 15, 50–57. [Google Scholar]
- Hawco C. S., & Jones J. A. (2010). Multiple instances of vocal sensorimotor adaptation to frequency-altered feedback within a single experimental session. The Journal of the Acoustical Society of America, 127(1), EL13–EL18. https://doi.org/10.1121/1.3272633 [DOI] [PMC free article] [PubMed] [Google Scholar]
- Heller Murray E. S., Lien Y.-A. S., Van Stan J. H., Mehta D. D., Hillman R. E., Pieter Noordzij J., & Stepp C. E. (2017). Relative fundamental frequency distinguishes between phonotraumatic and non-phonotraumatic vocal hyperfunction. Journal of Speech, Language, and Hearing Research, 60(6), 1507–1515. https://doi.org/10.1044/2016_JSLHR-S-16-0262 [DOI] [PMC free article] [PubMed] [Google Scholar]
- Hillenbrand J., & Houde R. A. (1996). Acoustic correlates of breathy vocal quality: Dysphonic voices and continuous speech. Journal of Speech and Hearing Research, 39(2), 311–321. https://doi.org/10.1044/jshr.3902.311 [DOI] [PubMed] [Google Scholar]
- Hillman R. E., Heaton J. T., Masaki A., Zeitels S. M., & Cheyne H. A. (2006). Ambulatory monitoring of disordered voices. Annals of Otology, Rhinology & Laryngology, 115(11), 795–801. https://doi.org/10.1177/000348940611501101 [DOI] [PubMed] [Google Scholar]
- Hillman R. E., Holmberg E. B., Perkell J. S., Walsh M., & Vaughan C. (1989). Objective assessment of vocal hyperfunction: An experimental framework and initial results. Journal of Speech and Hearing Research, 32(2), 373–392. https://doi.org/10.1044/jshr.3202.373 [DOI] [PubMed] [Google Scholar]
- Hogikyan N. D., & Sethuraman G. (1999). Validation of an instrument to measure voice-related quality of life (V-RQOL). Journal of Voice, 13(4), 557–569. https://doi.org/10.1016/S0892-1997(01)00041-8 [DOI] [PubMed] [Google Scholar]
- Holmberg E. B., Hillman R. E., Hammarberg B., Södersten M., & Doyle P. (2001). Efficacy of a behaviorally based voice therapy protocol for vocal nodules. Journal of Voice, 15(3), 395–412. https://doi.org/10.1016/S0892-1997(01)00041-8 [DOI] [PubMed] [Google Scholar]
- Karnell M. P., Melton S. D., Childes J. M., Coleman T. C., Dailey S. A., & Hoffman H. T. (2007). Reliability of clinician-based (GRBAS and CAPE-V) and patient-based (V-RQOL and IPVI) documentation of voice disorders. Journal of Voice, 21(5), 576–590. https://doi.org/10.1016/j.jvoice.2006.05.001 [DOI] [PubMed] [Google Scholar]
- Kempster G. B., Gerratt B. R., Verdolini Abbott K., Barkmeier-Kraemer J., & Hillman R. E. (2009). Consensus auditory–perceptual evaluation of voice: Development of a standardized clinical protocol. American Journal of Speech-Language Pathology, 18(2), 124–132. https://doi.org/10.1044/1058-0360(2008/08-0017) [DOI] [PubMed] [Google Scholar]
- Keough D., & Jones J. A. (2009). The sensitivity of auditory–motor representations to subtle changes in auditory feedback while singing. The Journal of the Acoustical Society of America, 126(2), 837–846. https://doi.org/10.1121/1.3158600 [DOI] [PMC free article] [PubMed] [Google Scholar]
- Kessinger R. H., & Blumstein S. E. (1997). Effects of speaking rate on voice-onset time in Thai, French, and English. Journal of Phonetics, 25(2), 143–168. https://doi.org/10.1006/jpho.1996.0039 [Google Scholar]
- Kewley-Port D., & Preston M. S. (1974). Early apical stop production, a voice onset time analysis. Journal of Phonetics, 2(3), 195–210. https://doi.org/10.1016/S0095-4470(19)31270-7 [Google Scholar]
- Klatt D. H. (1973). Aspiration and voice onset time in word-initial consonant clusters in English. The Journal of the Acoustical Society of America, 54(1), 319–319. https://doi.org/10.1121/1.1978269 [Google Scholar]
- Klatt D. H. (1975). Voice onset time, frication, and aspiration in word-initial consonant clusters. Journal of Speech and Hearing Research, 18(4), 686–706. https://doi.org/10.1044/jshr.1804.686 [DOI] [PubMed] [Google Scholar]
- Koo T. K., & Li M. Y. (2016). A Guideline of selecting and reporting intraclass correlation coefficients for reliability research. Journal of Chiropractic Medicine, 15(2), 155–163. https://doi.org/10.1016/j.jcm.2016.02.012 [DOI] [PMC free article] [PubMed] [Google Scholar]
- Lane H., & Perkell J. S. (2005). Control of voice-onset time in the absence of hearing: A review. Journal of Speech, Language, and Hearing Research, 48(6), 1334–1343. https://doi.org/10.1044/1092-4388(2005/093) [DOI] [PubMed] [Google Scholar]
- Lane H., Wozniak J., & Perkell J. (1994). Changes in voice-onset time in speakers with cochlear implants. The Journal of the Acoustical Society of America, 96(1), 56–64. https://doi.org/10.1121/1.410442 [DOI] [PubMed] [Google Scholar]
- Lisker L., & Abramson A. S. (1964). A cross-language study of voicing in initial stops: Acoustical measurements. WORD, 20(3), 384–422. https://doi.org/10.1080/00437956.1964.11659830 [Google Scholar]
- Lowell S. Y., Kelley R. T., Colton R. H., Smith P. B., & Portnoy J. E. (2012). Position of the hyoid and larynx in people with muscle tension dysphonia. The Laryngoscope, 122(2), 370–377. https://doi.org/10.1002/lary.22482 [DOI] [PubMed] [Google Scholar]
- Marciniec S. A. (2009). Voice onset time of women with vocal nodules (Master's thesis). Retrieved from ProQuest. (UMI No. 1466232). [Google Scholar]
- McCrea C. R., & Morris R. J. (2005). The effects of fundamental frequency level on voice onset time in normal adult male speakers. Journal of Speech, Language, and Hearing Research, 48(5), 1013–1024. https://doi.org/10.1044/1092-4388(2005/069) [DOI] [PubMed] [Google Scholar]
- Mehta D. D., Van Stan J. H., Zañartu M., Ghassemi M., Guttag J. V., Espinoza V. M., Cortés J. P., Cheyne H. A. II, & Hillman R. E. (2015). Using ambulatory voice monitoring to investigate common voice disorders: research update. Frontiers in Bioengineering and Biotechnology, 3, 155 https://doi.org/10.3389/fbioe.2015.00155 [DOI] [PMC free article] [PubMed] [Google Scholar]
- Metz D. E., Whitehead R. L., & Whitehead B. H. (1984). Mechanics of vocal fold vibration and laryngeal articulatory gestures produced by hearing-impaired speakers. Journal of Speech and Hearing Research, 27(1), 62–69. https://doi.org/10.1044/jshr.2701.62 [DOI] [PubMed] [Google Scholar]
- Miller J. L., Green K. P., & Reeves A. (1986). Speaking rate and segments: A look at the relation between speech production and speech perception for the voicing contrast. Phonetica, 43(1–3), 106–115. https://doi.org/10.1159/000261764 [Google Scholar]
- Morris R. J., McCrea C. R., & Herring K. D. (2008). Voice onset time differences between adult males and females: Isolated syllables. Journal of Phonetics, 36(2), 308–317. https://doi.org/10.1016/j.wocn.2007.06.003 [Google Scholar]
- Morrison M. (1997). Pattern recognition in muscle misuse voice disorders: How I do it. Journal of Voice, 11(1), 108–114. https://doi.org/10.1016/S0892-1997(97)80031-8 [DOI] [PubMed] [Google Scholar]
- Morrison M., Rammage L. A., Belisle G. M., Pullan C. B., & Nichol H. (1983). Muscular tension dysphonia. The Journal of Otolaryngology, 12(5), 302–306. [PubMed] [Google Scholar]
- Narayan C., & Bowden M. (2013). Pitch affects voice onset time (VOT): A cross-linguistic study. Proceedings of Meetings on Acoustics, 19, 1–6. https://doi.org/10.1121/1.4800681 [Google Scholar]
- Naunheim M. L., Yung K. C., Schneider S. L., Henderson-Sabes J., Kothare H., Mizuiri D., Klein D. J., Houde J. F., Nagarajan S. S., & Cheung S. W. (2019). Vocal motor control and central auditory impairments in unilateral vocal fold paralysis. The Laryngoscope, 129(9), 2112–2117. https://doi.org/10.1002/lary.27680 [DOI] [PubMed] [Google Scholar]
- Neiman G. S., Klich R. J., & Shuey E. M. (1983). Voice onset time in young and 70-year-old women. Journal of Speech and Hearing Research, 26(1), 118–123. https://doi.org/10.1044/jshr.2601.118 [DOI] [PubMed] [Google Scholar]
- Osberger M. J., & McGarr N. S. (1982). Speech production characteristics of the hearing impaired. In Lass N. J. (Ed.), Speech and language (Vol. 8, pp. 221–283). Academic Press; https://doi.org/10.1016/B978-0-12-608608-9.50013-9 [Google Scholar]
- Park Y., Perkell J. S., Matthies M. L., & Stepp C. E. (2019). Categorization in the perception of breathy voice quality and its relation to voice production in healthy speakers. Journal of Speech, Language, and Hearing Research, 62(10), 3655–3666. https://doi.org/10.1044/2019_JSLHR-S-19-0048 [DOI] [PMC free article] [PubMed] [Google Scholar]
- Perju-Dumbrava L., Lau K., Phyland D., Papanikolaou V., Finlay P., Beare R., Bardin P., Stuckey S., Kempster P., & Thyagarajan D. (2017). Arytenoid cartilage movements are hypokinetic in Parkinson's disease: A quantitative dynamic computerised tomographic study. PLOS ONE, 12(11), 1–17. https://doi.org/10.1371/journal.pone.0186611 [DOI] [PMC free article] [PubMed] [Google Scholar]
- Perkell J. S., Guenther F. H., Lane H., Matthies M. L., Stockmann E., Tiede M., & Zandipour M. (2004). The distinctness of speakers' productions of vowel contrasts is related to their discrimination of the contrasts. The Journal of the Acoustical Society of America, 116(4, Pt. 1), 2338–2344. https://doi.org/10.1121/1.1787524 [DOI] [PubMed] [Google Scholar]
- Port R. F., & Rotunno R. (1979). Relation between voice-onset time and vowel duration. The Journal of the Acoustical Society of America, 66(3), 654–662. https://doi.org/10.1121/1.383692 [DOI] [PubMed] [Google Scholar]
- Robb M., Gilbert H., & Lerman J. (2005). Influence of gender and environmental setting on voice onset time. Folia Phoniatrica et Logopaedica, 57(3), 125–133. https://doi.org/10.1159/000084133 [DOI] [PubMed] [Google Scholar]
- Roy N. (2008). Assessment and treatment of musculoskeletal tension in hyperfunctional voice disorders. International Journal of Speech-Language Pathology, 10(4), 195–209. https://doi.org/10.1080/17549500701885577 [DOI] [PubMed] [Google Scholar]
- Roy N., Ford C. N., & Bless D. M. (1996). Muscle tension dysphonia and spasmodic dysphonia: The role of manual laryngeal tension reduction in diagnosis and management. Annals of Otology, Rhinology & Laryngology, 105(11), 851–856. https://doi.org/10.1177/000348949610501102 [DOI] [PubMed] [Google Scholar]
- Roy N., Merrill R. M., Gray S. D., & Smith E. M. (2005). Voice disorders in the general population: Prevalence, risk factors, and occupational impact. The Laryngoscope, 115(11), 1988–1995. https://doi.org/10.1097/01.mlg.0000179174.32345.41 [DOI] [PubMed] [Google Scholar]
- Roy N., Merrill R. M., Thibeault S., Parsa R. A., Gray S. D., & Smith E. M. (2004). Prevalence of voice disorders in teachers and the general population. Journal of Speech, Language, and Hearing Research, 47(2), 281–293. https://doi.org/10.1044/1092-4388(2004/023) [DOI] [PubMed] [Google Scholar]
- Ryalls J., Simon M., & Thomason J. (2004). Voice onset time production in older Caucasian- and African-Americans. Journal of Multilingual Communication Disorders, 2(1), 61–67. https://doi.org/10.1080/1476967031000090980 [Google Scholar]
- Ryalls J., Zipprer A., & Baldauff P. (1997). A preliminary investigation of the effects of gender and race on voice onset time. Journal of Speech, Language, and Hearing Research, 40(3), 642–645. https://doi.org/10.1044/jslhr.4003.642 [DOI] [PubMed] [Google Scholar]
- Scheerer N. E., Jacobson D. S., & Jones J. A. (2016). Sensorimotor learning in children and adults: Exposure to frequency-altered auditory feedback during speech production. Neuroscience, 314, 106–115. https://doi.org/10.1016/j.neuroscience.2015.11.037 [DOI] [PubMed] [Google Scholar]
- Shipp T. (1975). Vertical laryngeal position during continuous and discrete vocal frequency change. Journal of Speech and Hearing Research, 18(4), 707–718. https://doi.org/10.1044/jshr.1804.707 [DOI] [PubMed] [Google Scholar]
- Solomon N. P. (2008). Vocal fatigue and its relation to vocal hyperfunction. International Journal of Speech-Language Pathology, 10(4), 254–266. https://doi.org/10.1080/14417040701730990 [DOI] [PubMed] [Google Scholar]
- Stepp C. E., Hillman R. E., & Heaton J. T. (2010). A virtual trajectory model predicts differences in vocal fold kinematics in individuals with vocal hyperfunction. The Journal of the Acoustical Society of America, 127(5), 3166–3176. https://doi.org/10.1121/1.3365257 [DOI] [PMC free article] [PubMed] [Google Scholar]
- Stepp C. E., Lester-Smith R. A., Abur D., Daliri A., Pieter Noordzij J., & Lupiani A. A. (2017). Evidence for auditory–motor impairment in individuals with hyperfunctional voice disorders. Journal of Speech, Language, and Hearing Research, 60(6), 1545–1550. https://doi.org/10.1044/2017_JSLHR-S-16-0282 [DOI] [PMC free article] [PubMed] [Google Scholar]
- Sweeting P. M., & Baken R. J. (1982). Voice onset time in a normal-aged population. Journal of Speech and Hearing Research, 25(1), 129–134. https://doi.org/10.1044/jshr.2501.129 [DOI] [PubMed] [Google Scholar]
- Tam K. H., Carding P., Heard R., & Madhill C. J. (2018). The relationship between voice quality and pitch descrimination ability in a population with features of mild vocal hyperfunction [Abstract]. Presented at the Voice Foundation's 47th Annual Symposium, Philadelphia, PA, United States. [Google Scholar]
- Ubrig M. T., Goffi-Gomez M. V. S., Weber R., Menezes M. H. M., Nemr N. K., Tsuji D. H., & Tsuji R. K. (2011). Voice analysis of postlingually deaf adults pre- and postcochlear implantation. Journal of Voice, 25(6), 692–699. https://doi.org/10.1016/j.jvoice.2010.07.001 [DOI] [PubMed] [Google Scholar]
- Van Houtte E., Claeys S., D'haeseleer E., Wuyts F., & Van Lierde K. (2013). An examination of surface EMG for the assessment of muscle tension dysphonia. Journal of Voice, 27(2), 177–186. https://doi.org/10.1016/j.jvoice.2011.06.006 [DOI] [PubMed] [Google Scholar]
- Van Houtte E., Van Lierde K., & Claeys S. (2011). Pathophysiology and treatment of muscle tension dysphonia: A review of the current knowledge. Journal of Voice, 25(2), 202–207. https://doi.org/10.1016/j.jvoice.2009.10.009 [DOI] [PubMed] [Google Scholar]
- Volaitis L. E., & Miller J. L. (1992). Phonetic prototypes: Influence of place of articulation and speaking rate on the internal structure of voicing categories. The Journal of the Acoustical Society of America, 92(2), 723–735. https://doi.org/10.1121/1.403997 [DOI] [PubMed] [Google Scholar]
- Wang Y., Liang F., Yang J., Zhang X., Liu J., & Zheng Y. (2017). The acoustic characteristics of the voice in cochlear-implanted children: A longitudinal study. Journal of Voice, 31(6), 773.e21–773.e26. https://doi.org/10.1016/j.jvoice.2017.02.007 [DOI] [PubMed] [Google Scholar]
- Whiteside S. P., & Marshall J. (2001). Developmental trends in voice onset time: Some evidence for sex differences. Phonetica, 58(3), 196–210. https://doi.org/10.1159/000056199 [DOI] [PubMed] [Google Scholar]
- Yanagida S., Nishizawa N., Mizoguchi K., Hatakeyama H., & Fukuda S. (2015). Voice onset time for the word-initial voiceless consonant /t/ in japanese spasmodic dysphonia—A comparison with normal controls. Journal of Voice, 29(4), 450–454. https://doi.org/10.1016/j.jvoice.2014.09.028 [DOI] [PubMed] [Google Scholar]
- Zlatin M. A., & Koenigsknecht R. A. (1976). Development of the voicing contrast: A comparison of voice onset time in stop perception and production. Journal of Speech and Hearing Research, 19(1), 93–111. https://doi.org/10.1044/jshr.1901.93 [DOI] [PubMed] [Google Scholar]