
Fig. 1.
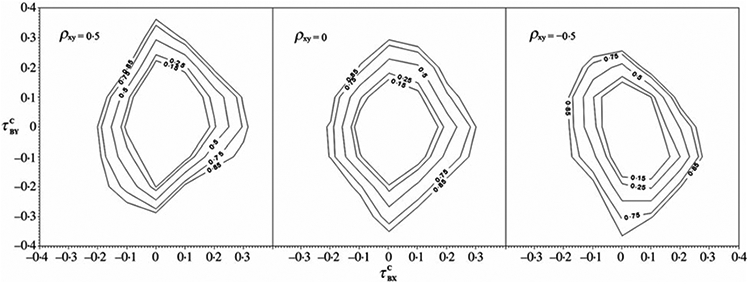
Contour plots of quasi-independence test power versus on the horizontal axis and on the vertical axis. The values of the nuisance parameter ρXY are 0·5, 0 and −0·5 from left to right. The power contours are 0·15, 0·25, 0·50, 0·75 and 0·85 from innermost to outermost.