

Abstract
Quantitating ultra-low concentrations of protein biomarkers is critical for early disease diagnosis and treatment. However, most current point-of-care (POC) assays are limited in sensitivity to meet this clinical need. Herein, we introduce an ultra-sensitive and facile microbubbling digital assay readout method toward POC quantitation of protein biomarkers requiring only bright-field smartphone imaging. Picolitre-sized microwells together with platinum nanoparticle labels enable the discrete “visualization” of protein molecules via immobilized-microbubbling with smartphone. We also use computer vision and machine learning to develop an automated image analysis smartphone application to facilitate accurate and robust counting. Using this method, post-prostatectomy surveillance of prostate specific antigen (PSA) can be achieved with a detection limit of 2.1 fM (0.060 pg/mL), and early pregnancy detection using βhCG with a detection limit of 0.034 mIU/mL (2.84 pg/mL). The results are further validated using clinical serum samples against clinical and research assays. This work provides the proof-of-principle of the microbubbling digital readout as an ultra-sensitive technology with minimal requirement for power and accessories, facilitating future POC applications.
Keywords: digital assay, platinum nanoparticle, microbubbling, protein detection, smartphone
Point-of-care (POC) protein assays provide clinically actionable results of protein biomarkers at the point-of-use, requiring no sample processing or analysis from a remote clinical central laboratory,[1–2] and meet the increasing demand of patient-centered health care.[3–4] They connect the testing and the consultation process for patients and therefore avoid multiple visits to healthcare providers otherwise required by centralized testing.[3] However, most current POC protein assays such as the market-dominating lateral flow assays are limited in sensitivity and precision.[5] On the other hand, the beginning of the 21st century has witnessed significant advances in pursuit of ultra-high sensitivity for protein biomarker detections in the research settings.[6–9] In 2010, the single-molecule enzyme-linked immunosorbent assay (digital ELISA) by Rissin et al. first introduced the revolutionary “digital assay” concept into the field of protein detection.[8] In digital ELISA, individual protein molecules were directly counted via the discrete fluorescent digital signals, achieving PCR-like sensitivity for protein detection. Although sensors in digital assays only need to distinguish between positive and negative signals,[10] digital ELISA mainly relies on fluorescent labels and requires sophisticated and nonportable laboratory based high-resolution fluorescence microscopy system.
Direct visualization as a readout method is more suitable for POC use than fluorescence, since no extra optical system is needed to filter excitation and emission light. Replacing the fluorescent labels in digital ELISA with submillimetre-sized bright field visible labels (such as microparticles) will pave the way to direct visualization. However, unlike nanosized labels, it is challenging to directly label discrete biomolecules with individual microscope-visible particles. For example, Tekin et al. have tried dipole-dipole assisted interactions and well controlled microfluidic drag force to label protein molecules with 2.8 μm magnetic beads.[11] Nam et al. have firstly used 30 nm gold nanoparticles to label the protein molecules and then used nanoparticle-promoted reduction to increase the size of the gold nanoparticle to amplify the signal.[7]
We aim to facilitate the translation of ultra-high sensitivity assay to POC clinical use by introducing a new signaling strategy: immobilized-microbubbling, one distinguishable physical transformation process involving quick volume amplification with minimum mass increase. We envision microbubbling as an ideal “bridge” to connect the “invisible” nano-world to the “visible” micro-world. Herein, we present an approach of using platinum nanoparticle (PtNP) catalyzed immobilized submillimetre-sized microbubbles to visualize protein molecules. We term the first of this kind of application: platinum nanoparticle based microbubbling assay, aiming for the ultra-sensitive detection of protein biomarkers with smartphone enabled bright field imaging as a new readout strategy for POC use, as shown in Figure 1. In the microbubbling digital assay, target protein molecules are captured by the capture antibodies on paramagnetic microbeads (~2.7 μm), and the bound complexes are further labelled with PtNPs. The sandwich complexes are loaded together with hydrogen peroxide solution into an array of square-shaped microwells (14 μm×14 μm, 7 μm depth, 100×100) on the microbubbling microchip via external magnetic field. Microbubbles form as a result of the accumulation of oxygen catalyzed by PtNPs[12] in the microwells, which can be easily seen with mobile microscope (9x) using smart phone camera. When the number of sandwich complexes to the number of microwells is below 1:1, the percentage of sandwich complexes loaded microwells follows Poisson distribution [8], which indicates that the microwells are loaded with a single sandwich complex or none. Therefore, the “yes/no” state of microbubbling digitally represents the “yes/no” state of the existence of a sandwich complex in the microwell. Compared with the analogue signals from PtNPs, such as the ensemble volume or pressure change caused by the PtNPs-catalysed oxygen generation,[13–14] the digital (“yes/no” state) signals in microbubbling assay are less influenced by the environmental temperature and pressure variations. Therefore, the background noise of microbubbling assay is much lower, resulting in the dramatic increase in sensitivity. Furthermore, like the gold nanoparticles used in lateral flow immunoassay, the PtNPs used in microbubbling assay are also stable for long-term storage and transportation.[15] To ensure the assay readout is precise and user-friendly for POC need, we have also developed a machine learning based automated image analysis smartphone application to count the number of microbubbles under a variety of imaging conditions. To prove the concept, we have used microbubbling assay to quantitate two model proteins: prostate-specific antigen (PSA) for post-prostatectomy prostate cancer surveillance and β subunit of human chorionic gonadotropin (βhCG) for early pregnancy detection, as two clinical application examples.
Figure 1.
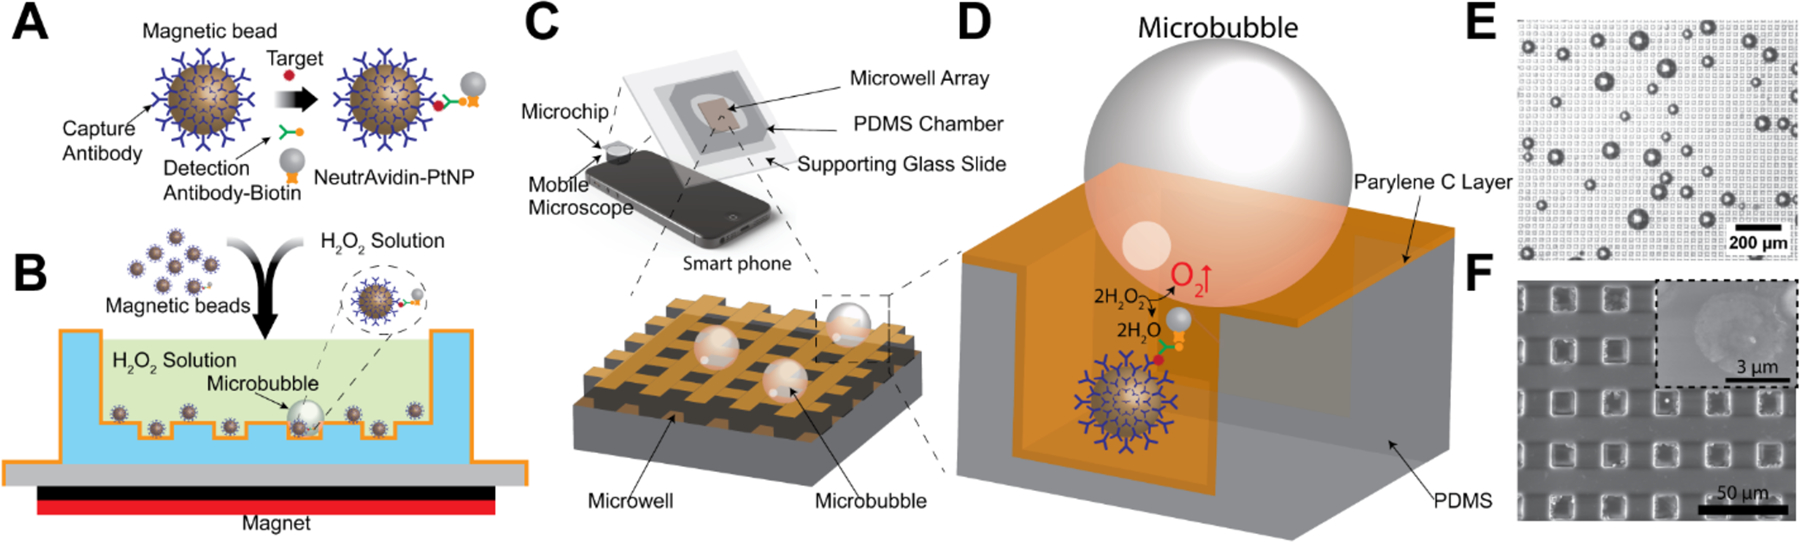
Schematic of platinum nanoparticle based microbubbling assay. (A) Magnetic beads functionalized with capture antibodies are used to capture PtNP-labeled target molecules. (B) Microbubbling signaling strategy. Magnetic beads with/without PtNPs are loaded together with hydrogen peroxide solution into the microbubbling chip. External magnetic field is then used to settle down the magnetic beads to the bottom of the chip. Distinguishable microbubbles can be observed when magnetic bead/target molecule/PtNP sandwich complexes are present in the microwells in the microbubbling chip. (C) Microbubbling microchip with smart phone as readout device. (D) Oxygen microbubbles entrapped in the square micro-well array serve as the visible digital signal. Not to scale. (E) Microscope image of the microbubbles on the microbubbling chip. Scale bar: 200 μm. (F) Scanning electron micrograph of a section of the microbubbling microchip. Scale bar: 50 μm. Inset shows a platinum nanoparticle bound to a paramagnetic bead. Scale bar: 3 μm.
The microbubbling microchip consists of three major parts as shown in Figure 1, C: 1) the sample chamber, 2) the microarray layer and 3) the supporting glass slide. The size of the microarray is designed to be 3 mm×3 mm to fit the field of view of the mobile imaging system. The microwell is designed in square shape to be easily distinguished from the round microbubbles. To fabricate the microwells, we used standard soft lithography to make the polydimethylsiloxane (PDMS) microwells, which were further coated with a 3 μm thick layer of parylene C via physical vapor deposition (PVD) to prevent the diffusion of oxygen into PDMS, as shown in Figure S1. The microbubbling assay procedure is shown in Figure 1A and B. Magnetic beads, functionalized with capture antibodies, are used to capture target molecules, which are further labeled with PtNPs via detection antibodies. All the magnetic beads with/without PtNPs are loaded into the chamber of the microbubbling chip together with hydrogen peroxide solution. External magnetic field (by placing a magnet under the microbubbling chip for 1 min) is used to settle down all the magnetic beads to the bottom of the microbubbling chip. Distinguishable microbubbles can be observed in the microwells of the chip, when magnetic bead/target molecule/PtNP sandwich complexes are present in the corresponding microwells. We found that the formation of microbubbles is microwell-dependent. As shown in Figure S2, microbubbles were only found in the microwell area but not in other area without microwells. We hypothesize that the growth of the microbubbles is facilitated by the rapid local oxygen accumulation in the microwells.To assess the kinetics of the microbubbling process on the microchip, we first used biotinylated bovine serum albumin (bBSA) coated paramagnetic microbeads to capture NeutrAvidin functionalized PtNPs, and then loaded the beads together with hydrogen peroxide solution into the microwell array on a microbubbling microchip via external magnetic field. As shown in Figure 2A and supplemental Movie S1 (recorded by conventional microscope, 100X magnification) and Movie S2 (recorded by 9X magnification mobile microscope with smartphone), the microbubbles increased quickly after the beads were loaded. All the microbubbles became visible under conventional microscope within 8 min. All the microbubbles originated from the centers of corresponding microwells and kept growing with these microwells as centers, indicating the growth of the microbubbles were powered by the gas-generating reaction catalyzed by the PtNPs trapped in the corresponding microwells. This was further confirmed by the fact that after replacing solution in the microchip with fresh hydrogen peroxide solution, new bubbles appeared again in the exact same microwells (Figure S3). As shown in Figure 2B&C, microbubbles started appearing at different time points, indicating the increase of local oxygen concentrations varied in different microwells. This is possibly due to the variations in number, size, mass transfer, shape, and surface coverage of the PtNPs in these bubble-generating microwells. Ambient temperature does not significantly affect the kinetics of bubble growth, as shown in Figure S4. We hypothesize that the formation of microbubbles in microbubbling assay is a composite chemical-physical phenomenon dependent on the balance between the local generation and the diffusion (into the bulk of the liquid phase) of oxygen molecules. When local speed of oxygen generation surpasses the speed of oxygen diffusion into the bulk liquid phase, microbubbles form and grow. This is supported by the finding that microbubbles were only found in microwells where the diffusion of oxygen molecules into bulk liquid phase was restricted by the walls of microwells. When temperature increases, both the generation and the diffusion speed of oxygen molecules increase, resulting in the overall growth speed of microbubbles relatively constant in the range from 4 ◦C to 32 ◦C.
Figure 2.
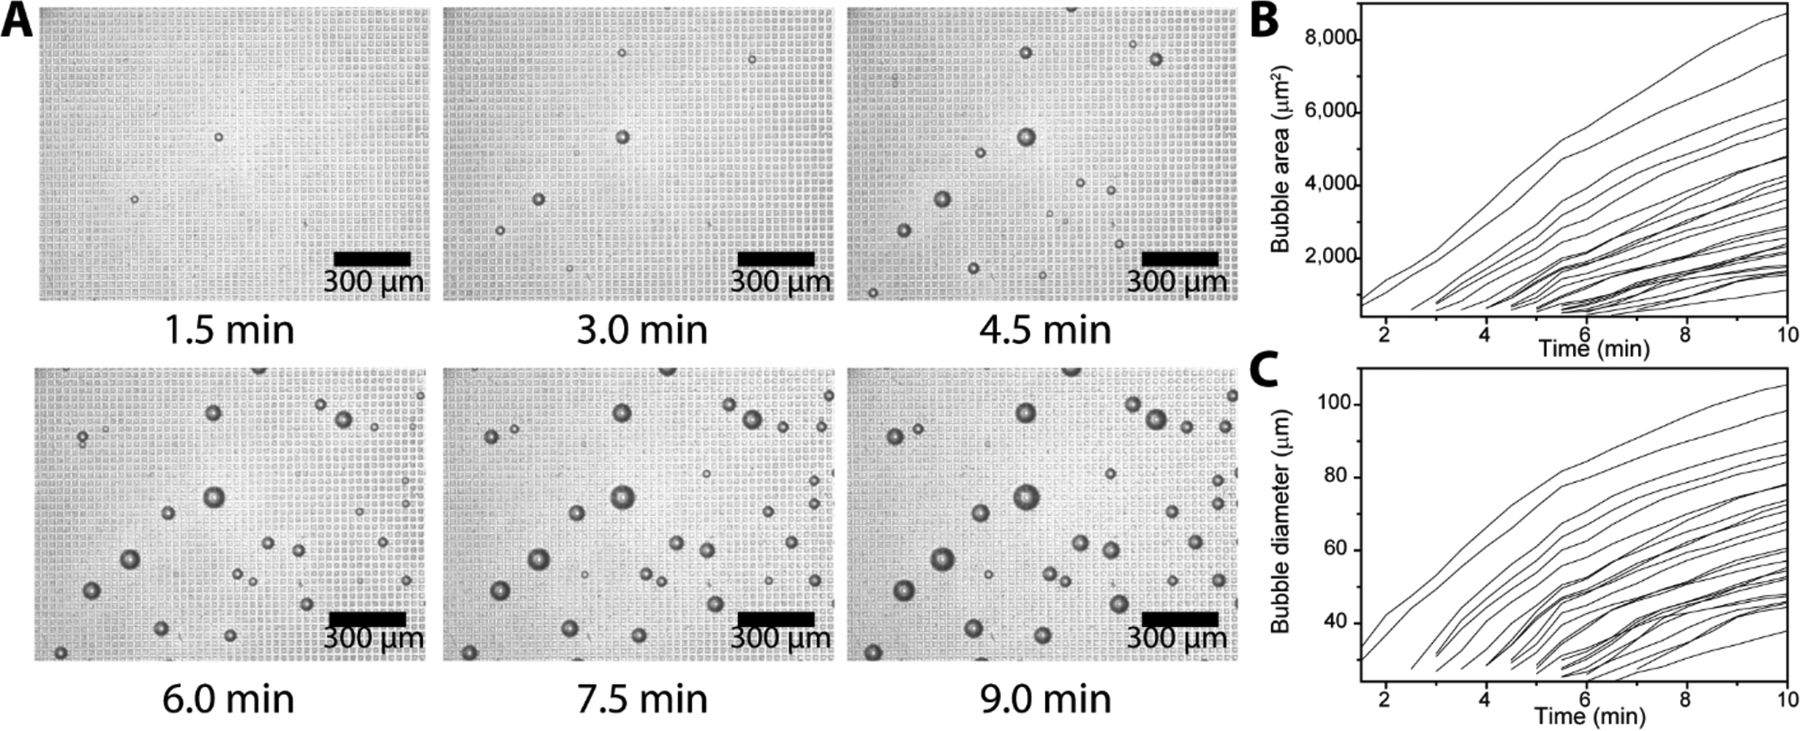
Kinetics of microbubbling. (A) Microscope images of the microbubbles growing on a section of the microchip (scale bars: 300 μm). About 25,000 Neutravidin functionalized platinum nanoparticles were incubated with biotinylated bovine serum albumin (bBSA) functionalized paramagnetic beads and loaded onto the microbubbling chip via external magnetic field. Time 0 was set as the point that the magnetic field was applied. Measurements of the microbubble (B) areas and (C) diameters as a function of time. Each trace represents the growth of one individual microbubble.
To explore the intrinsic sensitivity of the microbubbling assay, we have first optimized the amount of magnetic beads (Figure S5&S6) and concentration of hydrogen peroxide solution (Figure S7). We have optimized the ratio between the number of magnetic beads (~200,000) and the number of microwells (10,000) in the assay to make sure most of the microwells are loaded with magnetic beads in each measurement (Figure S6). We used bBSA coated paramagnetic microbeads to capture a range of numbers of NeutrAvidin functionalized PtNPs, and then loaded the beads together with hydrogen peroxide solution into the microwell arrays on microbubbling microchips via external magnetic field. After 8 minutes, the microbubbles on the microbubbling microchips were imaged using an iPhone 6 plus together with a commercial mobile microscope (9x). As shown in Figure 3, the number of microbubbles correlated linearly with the number of PtNPs, with a limit of detection (LOD) of 894 PtNPs. The LOD was calculated by extrapolating the amount of PtNPs at background plus 3 standard deviations of the background.
Figure 3.
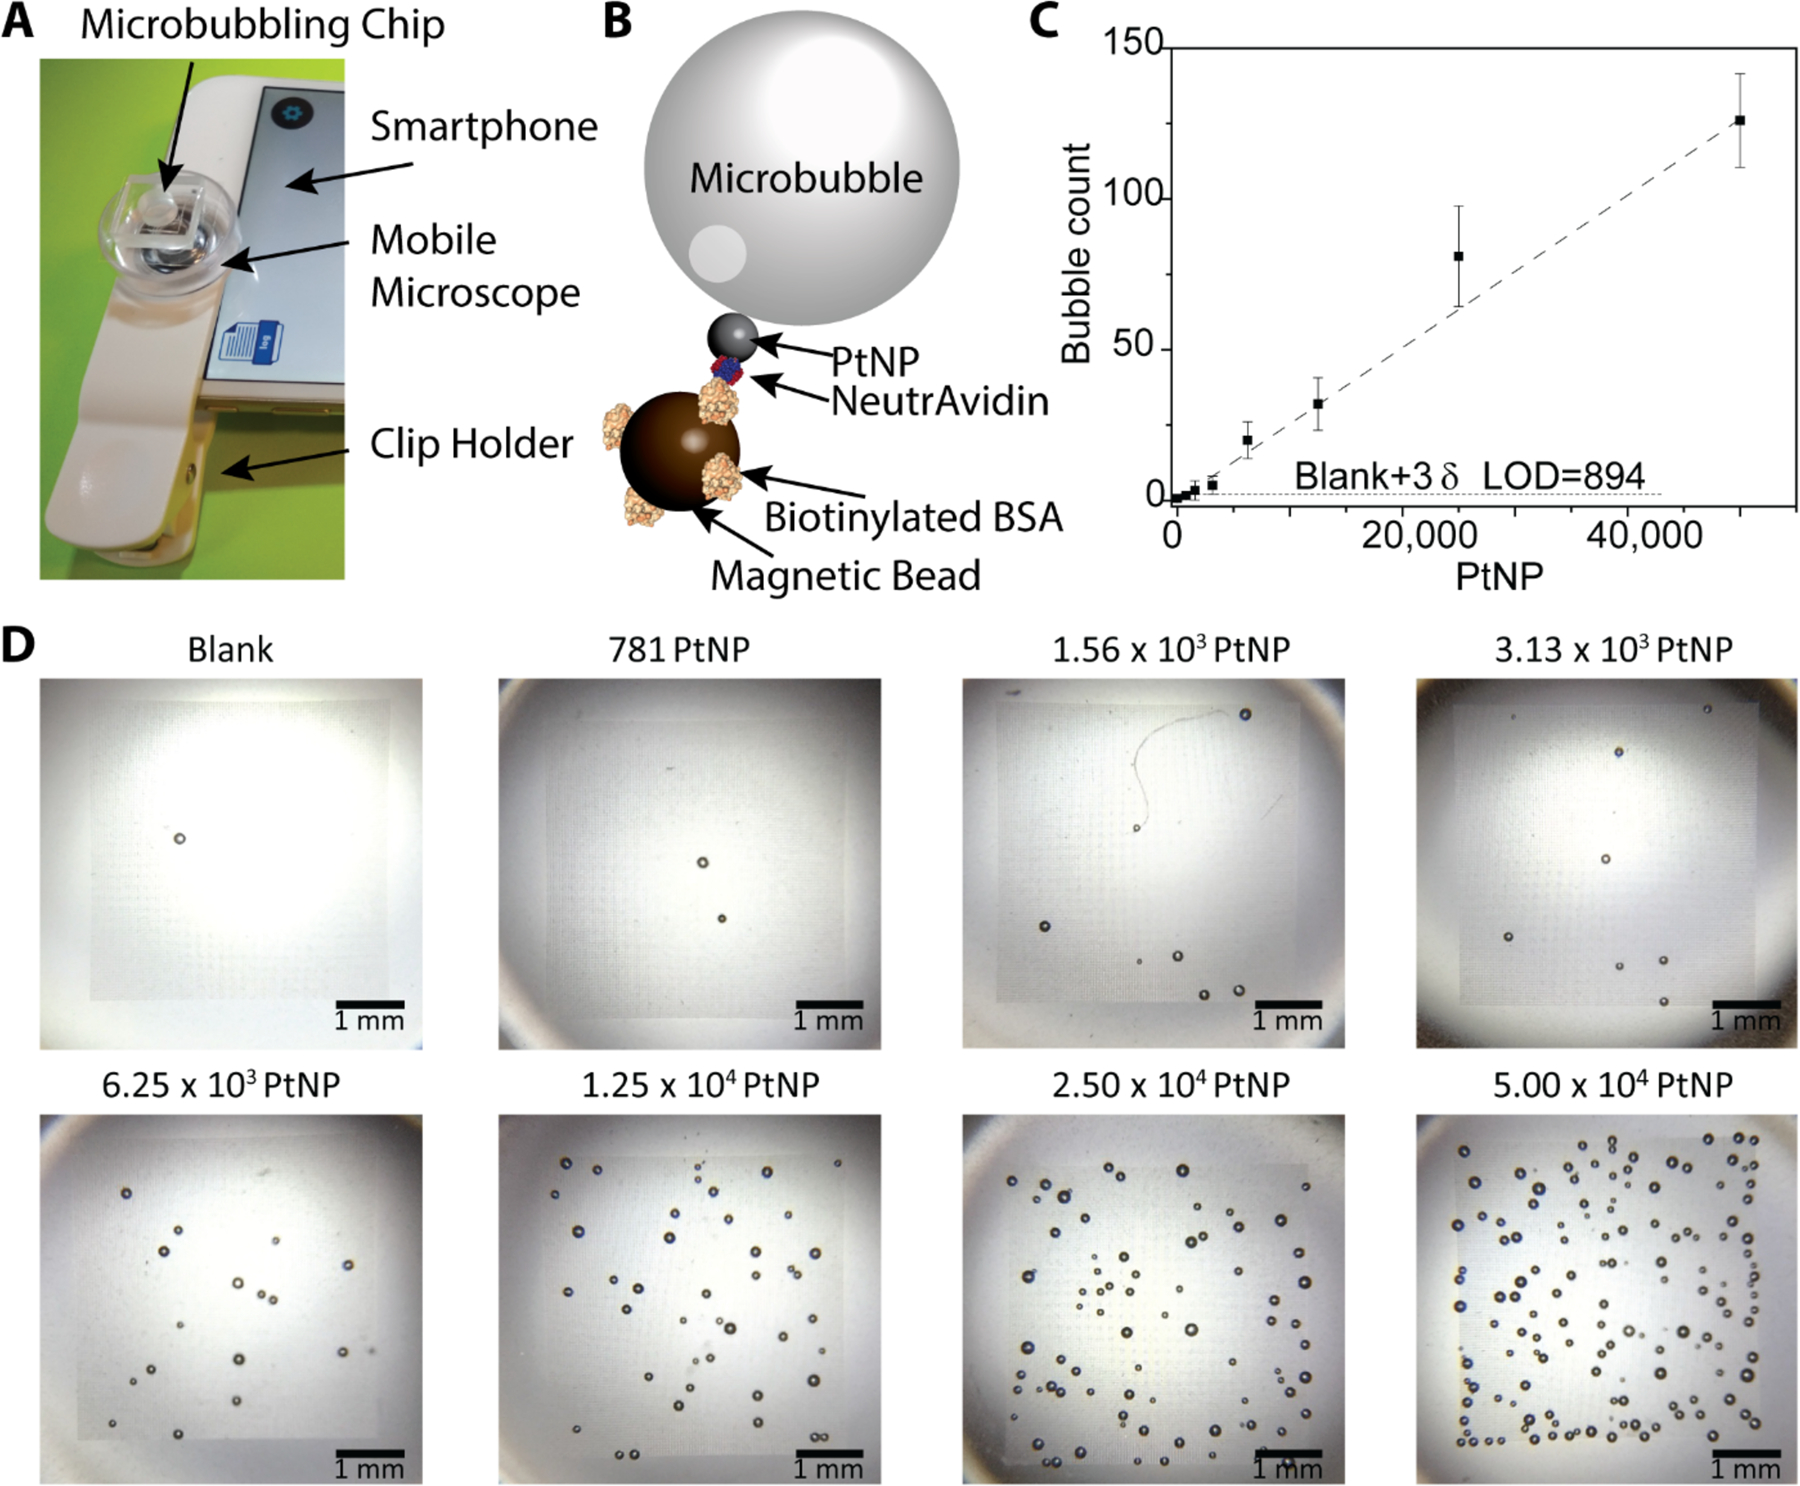
Intrinsic sensitivity assessment of the microbubbling assay. (A) Device setup for imaging microbubbles on microbubbling chip with a commercially available mobile microscope (9x) and a smartphone. (B) Scheme of detecting NeutrAvidin coated PtNP using biotinylated bovine serum albumin (bBSA) functionalized magnetic beads via microbubbling. (C) Dose-response curve generated from experiments in B. The number of microbubbles correlates linearly with the amount of NeutrAvidin functionalized PtNPs. Mean ± standard deviation; n = 3. LOD=894 PtNPs. (D) Smartphone images of the microbubbles that appeared on the microbubbling microchips (scale bars: 1 mm) with different amounts of PtNPs.
Thanks to their unique light scattering properties and shape, the microbubbles can be easily distinguished in the images by human eye or a conventional image processing algorithm. But the color and brightness of microbubbles may vary significantly as shown in Fig. S8, when images are taken under a variety of illumination conditions, which are typical in POC settings. To increase the robustness and accuracy of the image processing algorithm for bubble counting, we took advantage of the convolutional neural network (CNN) to identify and count the number of microbubbles in the images. CNN has been utilized in the past several years in vision tasks, such as image recognition, semantic segmentation and object detection.[16–18] The main advantage of CNN architecture is that it can learn expressive feature representation with high-level semantics for specific tasks, and it is robust to poor image quality due to less-than-ideal imaging conditions. We developed a smartphone application for microbubbling via the CNN, Figure 4A. After training the algorithm with 493 images (detailed training network and process in the supporting information, Figure S8), the application can successfully identify the boundaries of the microarray areas and count the microbubbles in seconds. The application is robust to variations in illumination condition and microbubble size and overlapping cases (Figure S8). Examples of the smartphone application interfaces are as shown in Figure 4B and Movie S3. As shown in Figure 4C, the microbubble counts of 22 test images via the CNN correlate well with ImageJ-assisted manual counts.
Figure 4.
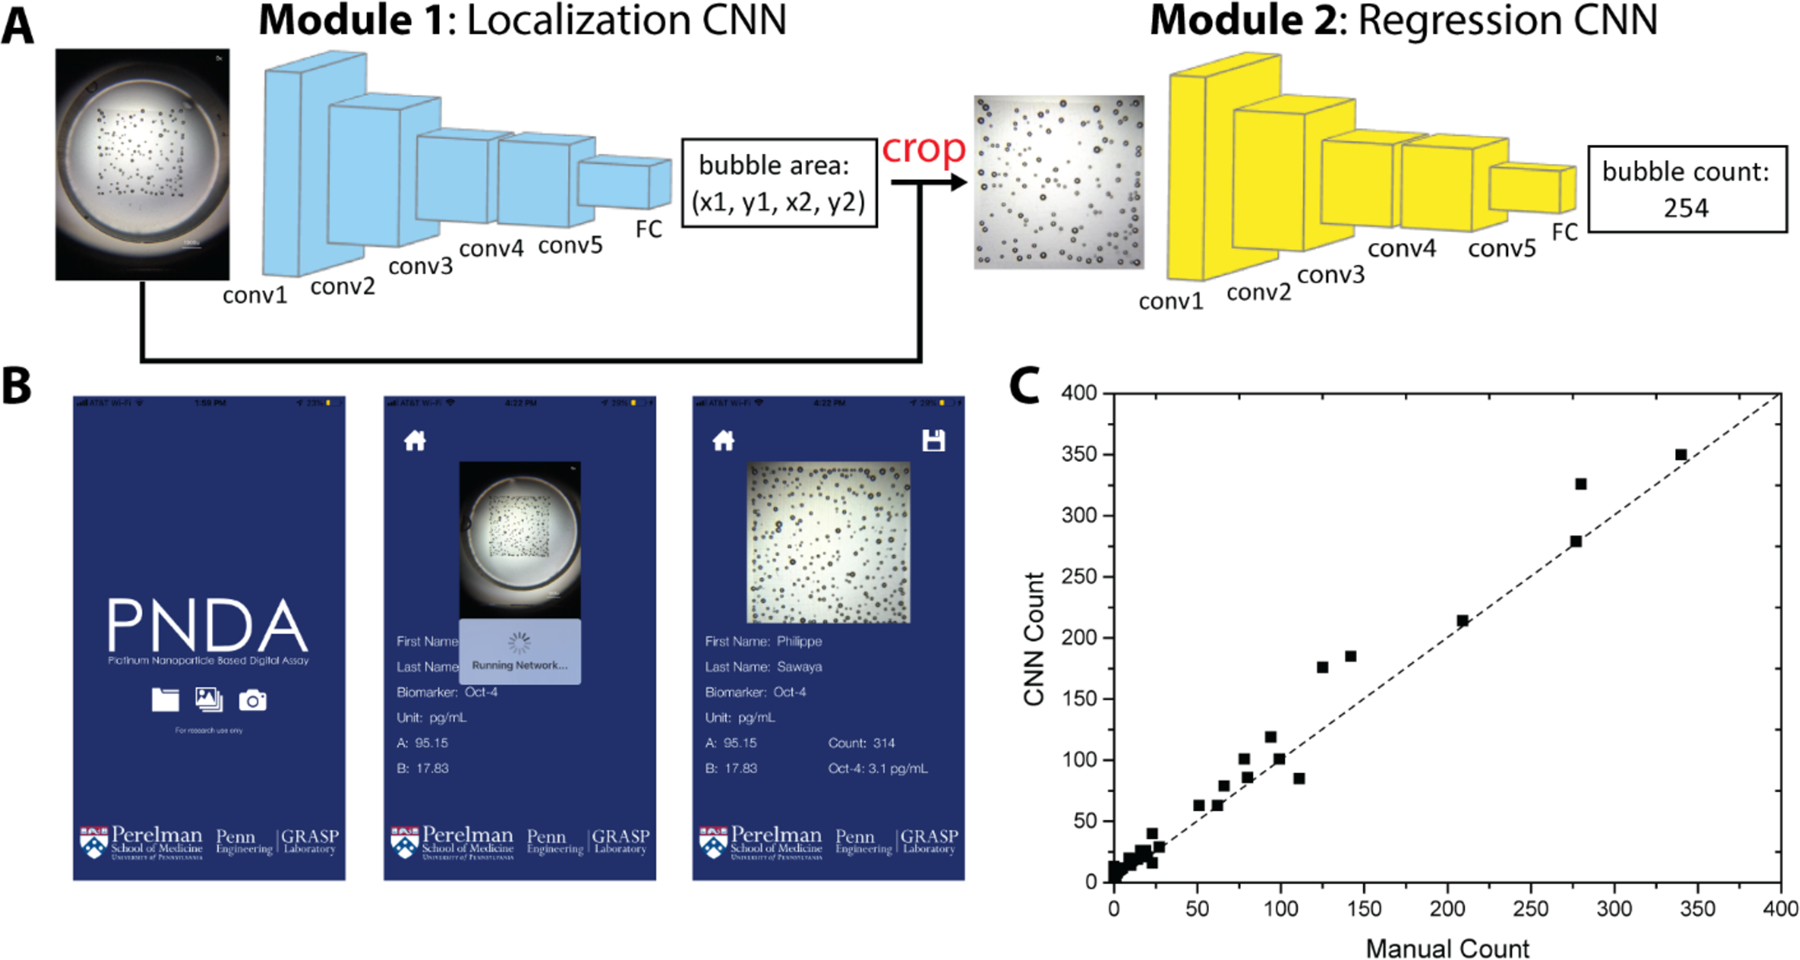
Mobile application via machine learning for counting microbubbles in smartphone images. (A) The localization network takes the raw images as input, and outputs the location of the microwell array region. The cropped images are fed into the regression network that outputs the bubble counts. (B) User interface of the mobile application. (C) The readouts via the CNN approach correlate well with ImageJ-assisted manual approach.
Ultrasensitive PSA assessment in the post-prostatectomy surveillance of prostate cancer patients has utility as a means of risk stratification and counselling of patients on prognosis and treatment decisions.[19–21] Early detection of recurrence offers the possibility of early salvage therapy given at a lower cancer burden and a wider time window for cure.[22–23] Postoperative PSA >0.073 ng/ml at day 30 significantly increased the risk of biochemical recurrence in the presence of positive surgical margins (PSM) after radical prostatectomy, demonstrating that ultrasensitive PSA can aid risk stratification in patients with PSM. Patients not likely to experience biochemical recurrence may be spared from the toxicity of immediate adjuvant radiotherapy.[24] An ultrasensitive POC PSA device would allow urologists to test patients in their offices during follow-up visits after surgery, or eventually allow a telemedicine approach in which patients monitor themselves at home and transmit results to urologists. This would shorten the detection time of recurrence, enable immediate discussion of the result as preferred by the patients[25] and administration of salvage therapy if necessary. Studies have reported salvage radiation therapy given soon after ultra-PSA is detectable substantially reduces the risk of relapse and metastasis [20, 26]. Herein, we developed a microbubbling assay to ultra-sensitively quantitate PSA for the post-prostatectomy surveillance of prostate cancer, in which the smartphone plays an integral role of data collection, analysis, and transmission. In this assay, paramagnetic microbeads were functionalized with monoclonal anti-PSA antibodies to capture the PSA molecules. Biotinylated polyclonal antibodies were used to label the captured PSA molecules with NeutrAvidin functionalized PtNPs at the optimized concentration (Figure S9). As shown in Figure 5A&B and Figure S10, the number of microbubbles increased as the concentration of PSA increased, and reached plateau at around 500 microbubbles, at which time the bubble density became so high that adjacent microbubbles started to fuse, thus leading to a saturated signal. The dynamic range can be expanded by increasing the area or number of the microwell array on the chip. Within the dynamic range (0.060–1 pg/mL), the number of microbubbles correlated linearly with the concentrations of PSA, with a limit of detection (LOD) of 2.1 fM (0.060 pg/mL) PSA. The LOD was calculated by extrapolating the PSA concentration at background plus 3 standard deviations of the background. Compared with the current central clinical laboratory electrochemiluminescence (ECL) assay (Roche Elecsys Cobas Total PSA assay, lower reportable limit 0.01 ng/mL), microbubbling assay is 167 times more sensitive. At current stage, an average coefficient of variation (CV) of 16.5% has been achieved for the detection of PSA with microbubbling assay, as shown in Table S1. The CV of microbubbling assay can be further decreased by integrating the platform with automated microfluidic sample preparation, reaction mixing and washing. To validate the performance of the microbubbling assay in PSA quantitation, we have tested 13 deidentified prostate cancer patients’ serum samples with various PSA concentrations. As shown in Figure 5C, the microbubbling results correlated well with the central clinical laboratory electrochemiluminescence (ECL) results. In the 6 samples with undetectable PSA with the ECL assay, the accuracy of the microbubbling results was validated against the Simoa research assay, as shown in Figure S11.
Figure 5.
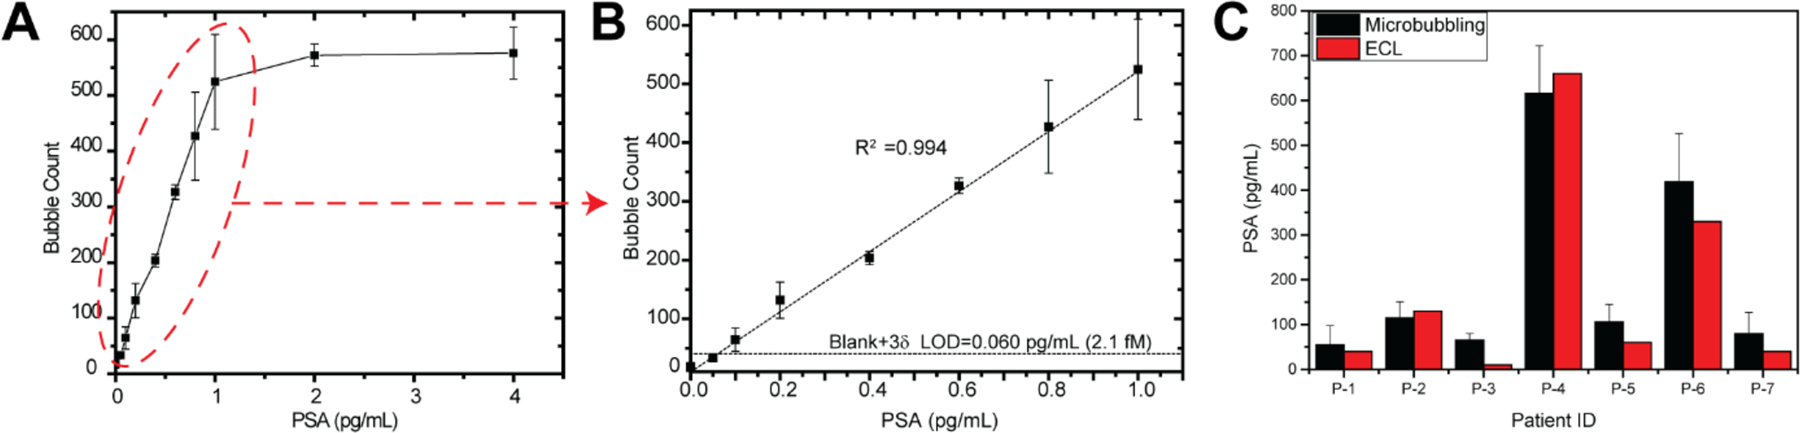
Ultra-sensitive quantitation of prostate specific antigen (PSA) with microbubbling assay for prostate cancer post-prostatectomy surveillance. Anti-PSA monoclonal antibody functionalized paramagnetic beads were used to capture PSA molecules, which were further labelled with the NeutrAvidin functionalized PtNPs via biotinylated anti-PSA polyclonal antibodies. (A) Dose-response curve of microbubbling PSA assay. (B) In the dynamic range, the number of microbubbles correlates linearly with the concentration of PSA. Mean ± standard deviation; n = 4. LOD=0.060 pg/mL (2.1 fM). (C) Validation of the microbubbling assay for ultra-sensitive PSA quantitation using patient serum samples. Comparison of PSA results obtained using microbubbling assay with a central clinical laboratory electrochemiluminescence (ECL) assay (Roche Elecsys Cobas Total PSA assay) Mean ± standard deviation for microbubbling results; n = 3.
To assess the versatility of the microbubbling assay, we have also developed an assay for βhCG, a biomarker for pregnancy. High sensitivity βhCG detection in the POC setting is key to quick rule-in or rule-out of early pregnancy, which is useful for pregnancy screening before diagnostic radiography procedures in the emergency department,[27] and care planning in the home setting. However, the sensitivity and accuracy of most POC βhCG tests are not as good as their central laboratory counterparts, and many are insufficient to detect very early pregnancy.[28–29] In our microbubbling assay, as shown in Figure S12, the number of microbubbles correlated linearly with the concentration of βhCG, with an LOD of 0.034 mIU/mL or 2.84 pg/mL or (background plus 3 standard deviations), with sensitivity significantly higher than current central laboratory (eg. LOD: 0.5 mIU/mL or 42 pg/mL for Beckman Coulter chemiluminescence immunoassay (CLIA)) or POC assays (eg. LOD: 5 mIU/mL or 0.4 ng/mL for Abbott i-STAT Total β-hCG Test).[30]
In summary, we have developed a novel ultra-sensitive microbubbling digital assay readout method toward the clinical POC need of high sensitivity protein quantitation. We have demonstrated for the first time that immobilized-microbubbling can be used as a simple and fast digital assay signaling strategy to bridge the “invisible” nano-world to the “visible” micro-world. Compared with the ensemble volume or pressure analog signals of PtNP labels, the microbubbling assay uses “yes/no” digital signal that is less influenced by variations of environmental temperature and pressure, leading to lower background noises and higher sensitivity.
We envision multiple possibilities to further develop this novel technology platform, after this proof-of-principle study. The microbubbling assay may be adapted to central laboratory instruments with high quality imaging capabilities for either research or diagnostic purposes. As demonstrated here, this technology also has potential to be further developed for POC diagnostic use, as the microbubbles can be easily imaged with smart phone and mobile microscope. We have developed the automated image analysis smartphone application via machine learning to make assay readout more user-friendly, robust and free of potential user bias. At current stage, multiple hands-on steps are still needed to carry out the incubation and washing steps in microbubbling assays. Further integration with automation systems, such as autonomous capillary microfluidic systems[31] disk-like microfluidic systems[32] and programmable electricwetting-based droplet mixing systems,[33] would allow the microbubbling assay to be further simplified and POC-ready. Once integrated, the ultra-sensitive microbubbling assay is a platform that has wide applicability beyond the two model protein biomarkers.
Experimental Section
Experimental, characterization details for all compounds and experiments are given in the supporting information.
Supplementary Material
ACKNOWLEDGMENT
This work was performed in part at the Singh Center for Nanotechnology at the University of Pennsylvania, a member of the National Nanotechnology Coordinated Infrastructure (NNCI) network.
REFERENCES
- [1].Cummins BM, Ligler FS, Walker GM, Biotechnol Adv 2016, 34, 161–176. [DOI] [PMC free article] [PubMed] [Google Scholar]
- [2].Chen H, Liu K, Li Z, Wang P, Clinica Chimica Acta 2019, 493, 138–147. [DOI] [PMC free article] [PubMed] [Google Scholar]
- [3].St John A, Price CP, Clin Biochem Rev 2014, 35, 155–167. [PMC free article] [PubMed] [Google Scholar]
- [4].Wang P, Kricka LJ, Clin Chem 2018, 64, 1439–1452. [DOI] [PubMed] [Google Scholar]
- [5].Gaydos C, Hardick J, Expert Rev Anti Infect Ther 2014, 12, 657–672. [DOI] [PMC free article] [PubMed] [Google Scholar]
- [6].Fredriksson S, Gullberg M, Jarvius J, Olsson C, Pietras K, Gústafsdóttir SM, Östman A, Landegren U, Nature Biotechnology 2002, 20, 473. [DOI] [PubMed] [Google Scholar]
- [7].Nam JM, Thaxton CS, Mirkin CA, Science 2003, 301, 1884–1886. [DOI] [PubMed] [Google Scholar]
- [8].Rissin DM, Kan CW, Campbell TG, Howes SC, Fournier DR, Song L, Piech T, Patel PP, Chang L, Rivnak AJ, Ferrell EP, Randall JD, Provuncher GK, Walt DR, Duffy DC, Nat Biotechnol 2010, 28, 595–599. [DOI] [PMC free article] [PubMed] [Google Scholar]
- [9].Chen H, Crum M, Chavan D, Vu B, Kourentzi K, Willson RC, ACS Appl Mater Interfaces 2018, 10, 31845–31849. [DOI] [PMC free article] [PubMed] [Google Scholar]
- [10].Basu AS, SLAS Technol 2017, 22, 369–386. [DOI] [PubMed] [Google Scholar]
- [11].Tekin HC, Cornaglia M, Gijs MA, Lab Chip 2013, 13, 1053–1059. [DOI] [PubMed] [Google Scholar]
- [12].Paxton WF, Kistler KC, Olmeda CC, Sen A, St Angelo SK, Cao Y, Mallouk TE, Lammert PE, Crespi VH, J Am Chem Soc 2004, 126, 13424–13431. [DOI] [PubMed] [Google Scholar]
- [13].Zhu Z, Guan Z, Liu D, Jia S, Li J, Lei Z, Lin S, Ji T, Tian Z, Yang CJ, Angew Chem Int Ed Engl 2015, 54, 10448–10453. [DOI] [PubMed] [Google Scholar]
- [14].Song Y, Zhang Y, Bernard PE, Reuben JM, Ueno NT, Arlinghaus RB, Zu Y, Qin L, Nat Commun 2012, 3, 1283. [DOI] [PMC free article] [PubMed] [Google Scholar]
- [15].Song Y, Xia X, Wu X, Wang P, Qin L, Angew Chem Int Ed Engl 2014, 53, 12451–12455. [DOI] [PMC free article] [PubMed] [Google Scholar]
- [16].Krizhevsky A, Sutskever I, Hinton GE, Commun Acm 2017, 60, 84–90. [Google Scholar]
- [17].Shelhamer E, Long J, Darrell T, Ieee T Pattern Anal 2017, 39, 640–651. [DOI] [PubMed] [Google Scholar]
- [18].He K, Gkioxari G, Dollar P, Girshick R, IEEE Trans Pattern Anal Mach Intell 2018. [DOI] [PubMed] [Google Scholar]
- [19].Laajala TD, Seikkula H, Seyednasrollah F, Mirtti T, Bostrom PJ, Elo LL, Sci Rep 2016, 6, 36161. [DOI] [PMC free article] [PubMed] [Google Scholar]
- [20].Tilki D, Kim SI, Hu B, Dall’Era MA, Evans CP, J Urol 2015, 193, 1525–1531. [DOI] [PubMed] [Google Scholar]
- [21].Sokoll LJ, Zhang Z, Chan DW, Reese AC, Bivalacqua TJ, Partin AW, Walsh PC, J Urol 2016, 195, 330–336. [DOI] [PubMed] [Google Scholar]
- [22].Stephenson AJ, Scardino PT, Kattan MW, Pisansky TM, Slawin KM, Klein EA, Anscher MS, Michalski JM, Sandler HM, Lin DW, Forman JD, Zelefsky MJ, Kestin LL, Roehrborn CG, Catton CN, DeWeese TL, Liauw SL, Valicenti RK, Kuban DA, Pollack A, J Clin Oncol 2007, 25, 2035–2041. [DOI] [PMC free article] [PubMed] [Google Scholar]
- [23].Shen S, Lepor H, Yaffee R, Taneja SS, J Urol 2005, 173, 777–780. [DOI] [PubMed] [Google Scholar]
- [24].Vesely S, Jarolim L, Duskova K, Schmidt M, Dusek P, Babjuk M, BMC Urol 2014, 14, 79. [DOI] [PMC free article] [PubMed] [Google Scholar]
- [25].Wilkinson S, Warren K, Ramsden A, Matthews A, Chodak G, Urology 2008, 71, 567–572. [DOI] [PubMed] [Google Scholar]
- [26].Tendulkar RD, Agrawal S, Gao T, Efstathiou JA, Pisansky TM, Michalski JM, Koontz BF, Hamstra DA, Feng FY, Liauw SL, Abramowitz MC, Pollack A, Anscher MS, Moghanaki D, Den RB, Stephans KL, Zietman AL, Lee WR, Kattan MW, Stephenson AJ, Journal of Clinical Oncology 2016, 34, 3648–3654. [DOI] [PubMed] [Google Scholar]
- [27].Abushouk AI, Sanei Taheri M, Pooransari P, Mirbaha S, Rouhipour A, Baratloo A, Emerg (Tehran) 2017, 5, e60–e60. [PMC free article] [PubMed] [Google Scholar]
- [28].Greene DN, Schmidt RL, Kamer SM, Grenache DG, Hoke C, Lorey TS, Clinica Chimica Acta 2013, 415, 317–321. [DOI] [PubMed] [Google Scholar]
- [29].Gnoth C, Johnson S, Geburtshilfe Frauenheilkd 2014, 74, 661–669. [DOI] [PMC free article] [PubMed] [Google Scholar]
- [30].Chen CY, Hwu YM, Chen CP, Chang CC, Int J Nanomedicine 2015, 10, 2475–2483. [DOI] [PMC free article] [PubMed] [Google Scholar]
- [31].Safavieh R, Juncker D, Lab on a Chip 2013, 13, 4180–4189. [DOI] [PubMed] [Google Scholar]
- [32].Gilmore J, Islam M, Martinez-Duarte R, Micromachines (Basel) 2016, 7, 52. [DOI] [PMC free article] [PubMed] [Google Scholar]
- [33].Mok J, Mindrinos MN, Davis RW, Javanmard M, Proceedings of the National Academy of Sciences 2014, 111, 2110–2115. [DOI] [PMC free article] [PubMed] [Google Scholar]
Associated Data
This section collects any data citations, data availability statements, or supplementary materials included in this article.