Abstract
Real-time observation and control of particle size and production rate in microfluidic devices are important capabilities for a number of applications, including the production, sorting, and manipulation of microbubbles and droplets. The production of microbubbles from flow-focusing microfluidic devices had been investigated in multiple studies, but each lacked an approach for on-chip measurement and control of microbubble diameter in real time. In this work, we implement a closed-loop feedback control system in a flow-focusing microfluidic device with integrated on-chip electrodes. Using our system, we measure and count microbubbles between 13 and 28 m in diameter and control their diameter using a proportional–integral controller. We validate our measurements against an optical benchmark with and achieve a maximum production rate of /s. Using the feedback control system, the device enabled control in microbubble diameter over the range of 14–24 m.
I. INTRODUCTION
Microbubbles (MBs) have been developed and widely studied in medical ultrasound applications. For example, MBs can be used for contrast enhancement,1,2 therapy,3,4 localized drug and gene delivery,5–7 and sonothrombolysis to promote recanalization in ischemic stroke.8–12 The most widely employed method to produce MBs involves agitation or sonication of gas-saturated surfactant dispersions and results in polydisperse MB populations that must often be size sorted prior to in vivo intravenous administration.1,13–19 However, microfluidic designs such as T-junction,20 coflow,21 and flow-focusing are capable of producing monodisperse populations of microbubbles without the need for size sorting, although at significantly reduced production rates relative to agitation and sonication.22–25 MBs produced by microfluidic devices also have the advantage of real-time tunability in terms of size, production rate, and temporal stability.22,23,25,26 Flow-focusing microfluidic devices (FFMDs), in particular, focus a gas thread between two liquid flows, and monodisperse MBs are released from an outlet port at a production rate that is typically between and MBs/s.8,22
As a practical matter, the limited production rate and the low stability of microfluidic generated MBs have precluded the approach’s adoption for most applications. However, in the context of sonothrombolysis, the combination of large MBs, low production rate, and low stability is advantageous. This combination provides an optimal design in terms of potential efficacy and safety.8,9 However, real-time production of MBs would, logically, require close monitoring of the number and diameter of MBs in order to provide adequate quality control and assurance of clinical efficacy and safety. A measure of MB count, diameter, and conclusive verification of no fault condition(s) being present (e.g., a “blow through”) must be considered.
Additionally, other microfluidic applications may also benefit from real-time control and measurement during the production of on-chip particles. Bubble size determines the ultrasound resonance frequency as well as the selection of imaging frequency. In drug delivery and therapeutic applications, larger MBs are associated with greater bioeffects.27 For reactions and mixing in microfluidic devices, droplet size is significant to the reaction rate.28 In this context, real-time monitoring and control of production parameters is crucial for further adoption of microfluidic devices in various applications.
At high production rates in FFMDs, a feasible way to measure the nonconductive particle size in microfluidics systems is by a resistive method using the Coulter principle.29–32 Coulter counters are widely used in sizing and counting cells and colloidal particles.29,33 The sensor detects the resistance perturbation that is proportional to a particle’s volume while the particle passes through the sensing zone. Miniaturization and integration of the Coulter counter within the microfluidic device result in what is referred to as a micro-Coulter particle counter (CPC),30 enabling real-time particle measurement in a lab-on-a-chip environment.34,35 Previous studies proposed a new FFMD design with integrated CPC that succeeded in offline characterization of MB diameter and production rate.32 This measurement utilized a compensation method that required a priori knowledge of the device’s operating parameters, but the approach can be modified to enable real-time MB diameter control in FFMDs.
A possible control scheme for MB diameter involves real-time measurement of the MB diameter in situ and the use of a feedback controller to adjust flow and/or pressure conditions and thereby produce MB of a desired diameter.36–38 In this method, the input parameters are adjusted by comparing the diameter and production rate of the produced MB to the desired diameter. Miller et al. demonstrated that the implementation of a proportional–integral (PI) control system enabled droplet production of a required size, measured by a high-speed camera, with limited knowledge of the fluid material properties.36 Similarly, Fu et al. verified electrical detection to be effective for droplet size measurements in a T-junction.38 However, the production rates in these systems were less than 50 particles per second,36,38 which is several orders of magnitude less than the MB production rate of FFMDs.
In this study, we propose a real-time measurement method and a closed-loop feedback system to control the diameter of MBs produced at the expanding nozzle of an FFMD with an integrated CPC. In addition to enabling real-time control over the operating parameters of the FFMD, the control system monitors the production of MBs and detects abnormal operational states of the FFMD. Ultimately, this monitoring system provides real-time feedback regarding the operation of the FFMD, which is required to meet the anticipated safety and efficacy requirements of future clinical translation.
II. METHODS
A. Device fabrication and microbubble production
The FFMD was composed of a microfluidic channel and a 500-m thick glass wafer with 11 electrodes. The microfluidic channel was fabricated by a custom SU-8 (3025, MicroChem, Newton, MA, USA) developed mold. The channel pattern was developed to be 20 m in height, and cast with polydimethysiloxane (PDMS) (Sylgard 184, Dow Chemical, Midland, MI, USA), as previously described.26 A glass wafer served as a substrate and standard liftoff techniques were used to fabricate the electrodes.30,32 Photoresists LOR10B and AZ4110 (MicroChem, Newton, MA, USA) were applied on the glass wafer, which was later patterned with a transparent photomask. An electron beam evaporation system was used to sputter 20 nm titanium (Ti)/100 nm platinum (Pt) on the substrate. After deposition, the extraneous metal was removed by a standard lift-off technique. The PDMS microfluidic device channels were aligned with the electrodes patterned on the glass wafer by a custom 3D positioning stage (Thorlabs Inc., Newton, NJ, USA), and the PDMS channel and the borosilicate glass wafer substrate were plasma bonded and immediately heated at 70C for 1 h.
MBs were produced using a liquid phase of bovine serum albumin (4% weight/volume BSA) and dextrose (10% weight/volume) dissolved in isotonic saline (0.9% NaCl) and a dispersed phase of 99.995% purified nitrogen (Praxair Inc., Danbury, CT, USA). The liquid phase was administered by a syringe pump (PhD 2000, Harvard Apparatus, Holliston, MA, USA), and the dispersed phase was supplied by an electronic regulator (PC-series, Alicat Scientific, Tucson, AZ, USA). Both phases were introduced to the FFMD channels by microbore PTFE tubing of 762 m outer diameter. The FFMD was operated within the field of view of an IX51 microscope (Olympus, Center Valley, PA, USA) and continuously observed in real time.
B. Finite element analysis
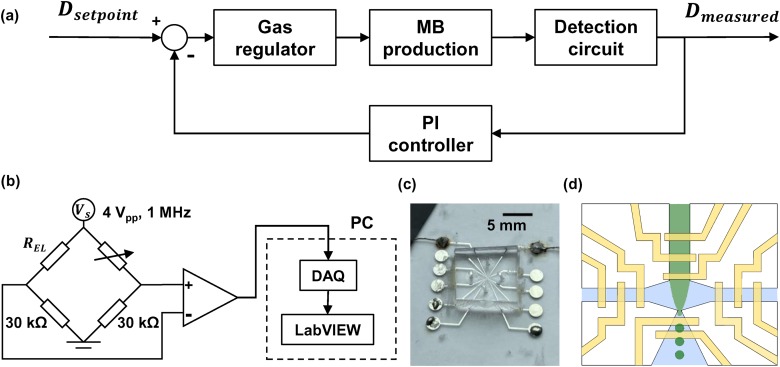
Finite element analysis (FEA) was performed using COMSOL 4.4 (Burlington, MA, USA) to estimate the impedance between electrodes in the expanding nozzle when excited by a 4 , 1 MHz signal. The FEA setup was based on the measured geometry from the FFMD image under the microscope. Figure 1(d) depicts the electrode setting of the device. The proximal electrode was 9 m wide and 18 m away from the expanding nozzle. The distal electrode was 10 m wide and 34 m away from the expanding nozzle. The distance between electrodes was 15 m. The detection region was 20 m tall with an expanding nozzle that expanded with respect to the nozzle. The electrode design was optimized for MBs between 8 and 25 m, so the electrode output was sensitive to MB diameter when using an excitation signal of 1 MHz excitation frequency.30,39 The design was fabricated and verified in a previous study.32
FIG. 1.
Schematic of the closed-loop control FFMD system. (a) Working principle of the control system. A PI controller regulates input gas pressure based on the measured diameter. (b) The output of the Wheatstone bridge is amplified and connected to a data acquisition system. (c) Image of a benchtop FFMD with CPC. (d) Produced MBs traverse the detection region of electrodes. The other electrodes monitor the flooded situation inside the PDMS channel.
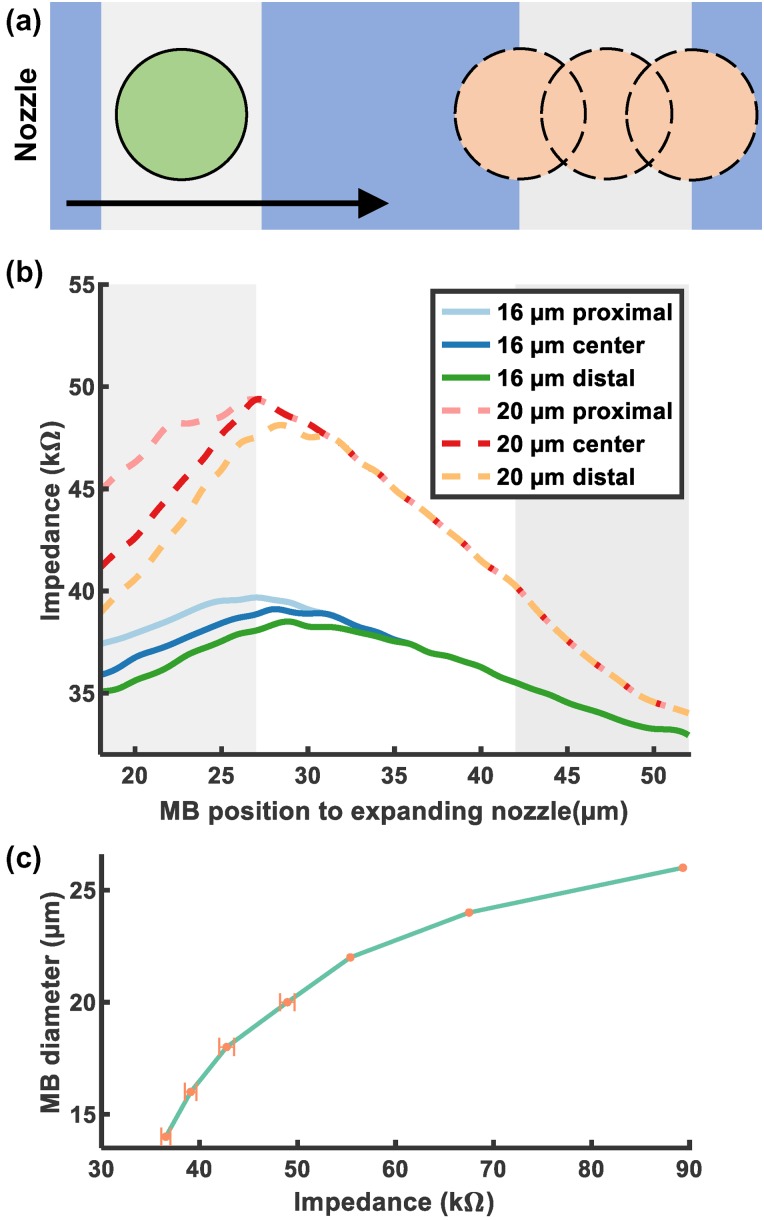
The impedance between electrodes was simulated using the following procedures: (1) the newly produced MBs passed through the detection region, while the adjacent MB stayed still; and (2) the simulation was designed to model MB aggregation as they flowed through the expanding nozzle. MBs were modeled to exit the expanding nozzle at a constant rate. The center of the MB were at 10 m height, the center of the channel. The diameter of MBs was varied from 14 to 26 m, and the location of the center of the adjacent MB was set above both edges and the center of the distal electrode. For MBs of 14–20 m diameter, a newly produced MB traverses the detection region and collides with another MB at three different locations [Fig. 3(a)]. For MBs of diameter, only one MB passage was simulated because MBs of such diameter are larger than the detection region and channel height. The maximum impedance change is associated with the total conductivity in the detection region, so the diameter of the MB dominates this value. The location of the adjacent MB also affects the total nonconductive volume. However, its contribution to the impedance should be less significant than the newly produced MB because it is farther from the proximal electrode.32
FIG. 3.
FEA results of MBs travel through detection electrodes. (a) The traverse of an MB through the detection region and moved close to the adjacent MB at three different locations. (b) The impedance of 16 and 20 m MB passage as previously described. (c) The impedance maxima of 14–26 m MBs were plotted.
C. Signal acquisition and signal processing
The impedance difference between electrodes in the expanding nozzle was detected by a Wheatstone bridge excited by a 4 , 1 MHz sinusoidal waveform. One branch of the Wheatstone bridge included electrodes within the expanding nozzle and a 30 k resistor. The other branch consisted of a potentiometer and a 30 k resistor to balance the impedance ratio. The bridge was prebalanced at each initialization when only the liquid phase passed through the detection region. The output of the bridge was amplified by an LM6171 (Texas Instruments, Dallas, Texas) differential amplifier with a 4-fold gain.
The output of the circuit and the reference excitation signal were sampled using LabVIEW (National Instruments, Austin, TX, USA) by a data acquisition system (ATS460, Alazar Technologies Inc., Pointe-Claire, QC, Canada). The data were acquired at 10M samples/s for a 32 768-sample-point record and coherently demodulated using quadrature demodulation in LabVIEW to extract the impedance signal.30,40,41 This signal was filtered using a 10th-order Butterworth low-pass filter with 300 kHz cutoff. Subsequently, the maximum voltage in each microbubble transit period was selected by a peak detection algorithm written in MATLAB (Mathworks, Natick, MA, USA) and averaged over the record. The voltage after processing was denoted as time-average maximum voltage (). The MB production rate was calculated using the time difference between maxima in each record,
| (1) |
where is the time of the last maximum signal and is the time of the first maximum signal. After collection of both electrical signal and images for five flow rates (), a cubic polynomial function of diameter vs time-averaged maximum voltage was computed in MATLAB to permit future monitoring and control of MB diameter. At the same time, we contend that the MB count is accurate. So long as the signal associated with the MB transit is detectable, there is no plausible error and no ideal reference standard is available. For example, when using optical observation of MB production, the limited frame count in high speed photography (24 frames in our case) is a more serious limitation to accurate counting than exists with continuous Coulter-based measurement of the same production instance.32 The comparison between our electrical method and optical method is included in Fig. S4 in the supplementary material.
D. Closed-loop feedback control
Feedback from the real-time diameter measurements of MBs was used to adjust the input pressure of the dispersed phase [Fig. 1(a)]. A proportional–integral (PI) controller program written in LabVIEW was used to calculate the adjusted amount of pressure based on the difference between the measured diameter and the setpoint diameter. The following equation can be used to parameterize the control schematic:
| (2) |
where is the difference between a setpoint diameter and a measured diameter , is the proportional gain, is the integral time constant, and is the adjustment value. To adjust the parameters of the PI controller, the commonly used Ziegler–Nichols method was applied to determine the PI controller’s proportional gain and integral time .42 A range of values were applied on the proportional-only feedback control system to determine the ultimate gain at which the output started to have a stable oscillation with a oscillation period . After the P-only evaluation, the PI controller parameters can be calculated by
| (3) |
| (4) |
In the feedback control system, the electrical signal responsive to instantaneous MB diameter was sampled and the input gas pressure was adjusted every 200 ms in real-time experiments. The step response of MB electrically determined diameter from 18 to 20 m was recorded using different PI parameters. Another test was performed to ascertain the system response of the feedback control system with different step sizes. MBs stabilized at an electrically determined diameter of 18 m were increased to between 19 and 24 m at an interval of 1 m, repeating three times for each step size.
Finally, MB diameters were adjusted in a stepwise fashion across a large diameter range ( L/min). To assess the precision of our system in specifying MB diameter, diameter was stepped between 18 and 24 m at a step size of 0.5 m every 30 s. To determine the maximum possible range of specified MB diameters, diameter was stepped between 14 and 24 m at a step size of 2 m every 30 s.
III. RESULTS
A. Microbubble production by FFMD
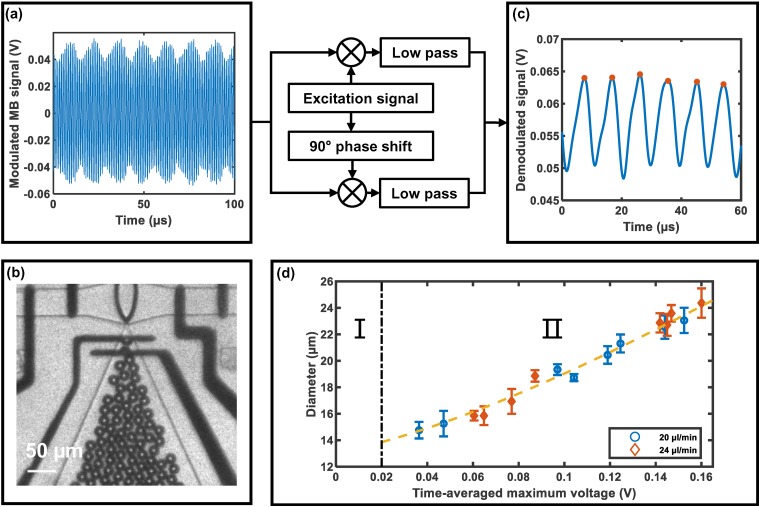
MBs generated by FFMD are shown in Fig. 2(c), and electrical signals collected by the detection circuit are illustrated in Fig. 1(b). The height of the channel in the FFMD was between 20 and 22 m, and the width of the nozzle was approximately 6 m. The input gas pressures and flow rates were varied from 51 to 103 kPa and from 16 to 28 L/min, respectively. The MB diameters ranged between 13.2 and 28 m at production rates between and MBs/s. The MB production rate was limited by (i) the strength of adherence of PDMS to the glass wafer substrate and (ii) the need to produce monodisperse MBs, as significant jumps in pressure would lead to MBs with noticeably polydisperse populations.
FIG. 2.
(a) Modulated MB signal and (b) a high-speed optical image of MBs were captured simultaneously. (c) Demodulated MB signal were acquired by the absolute value of quadrature demodulation. The peaks of the demodulated signal were selected and averaged over the sampling. (d) Optically determined diameter vs time-averaged maximum voltage.
B. FEA results
The schematic of an FEA simulation is illustrated in Fig. 3(a). The FEA results in Fig. 3(b) reveal that the maximum impedance measured for a given MB is affected mostly by the MB diameter and less so by the locations of adjacent MB. The maximum impedance occurs when the center of an MB enters the inner region between the electrodes and matches our previous findings.32 The total conductivity is associated with the addition from the volume of the adjacent MB, but the adjacent MB being far from the proximal electrode reduces its contribution to total conductivity.
The maximum impedance with varying locations of adjacent MB was simulated from a diameter of 14–20 m. MB from 22 to 26 m was simulated without an adjacent MB, since MBs of these dimensions were larger than the detection region. The simulation result was plotted in Fig. 3(c) to display the relation between MB diameter and maximum impedance induced by MB. As depicted in Fig. 3(c), the diameter–impedance relationship is nonlinear. To compute the diameter in real time, a cubic polynomial was used to represent the relation in practical measurements as the change in conductivity is a function of the volume of liquid displaced by the MB.
C. Electrical detection of MB diameter
The electrical signal was collected [Fig. 2(a)] and demodulated [Fig. 2(c)] as described above. The dashed line in Fig. 2(d) depicts the fitting function to be used in monitoring MB diameter. Region I is an unstable zone, where there are no MBs but the demodulated signal is larger than 0 V, whereas region II is the measurable range. A cubic polynomial fit was performed between optically determined diameters and corresponding . The fitting result is illustrated in Fig. 2(d) and is described by the following equation:
| (5) |
where is the MB diameter in m. The equation applies when V.
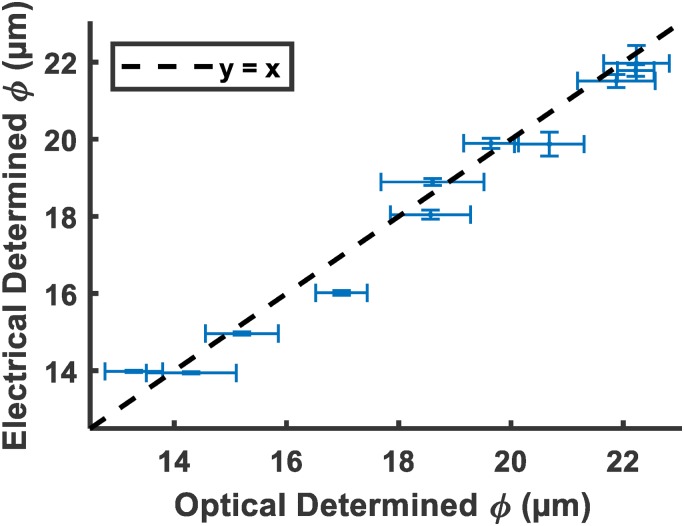
Validation data were also collected to test the accuracy of the model. Eleven high speed images and corresponding electrical signals were collected with the same method as a validation set. The electrically determined diameters calculated by Eq. (5) were compared to the optical diameters in Fig. 4. The root mean squared error of the electrically determined diameters to the optical diameters was 0.53 m, while the value was 0.98.
FIG. 4.
Validation data of electrically determined diameter vs optically determined diameter. .
The model fit of MB diameter vs time-averaged maximum voltage was used to attain an equation relating the electrically determined MB diameter and electrical measurement of impedance change. The system acquired measurements of MB diameter every 0.2 s, enabling real-time implementation of a feedback controller to adjust the setpoint diameter.
D. Characterization of FFMD feedback control system
A PI controller was implemented as in Fig. 1(a). When was increased to 0.1, the system reached ultimate sensitivity42 and oscillated as shown Fig. S1 in the supplementary material, with a period of approximately 4 s. From Eqs. (3) and (4), and were estimated to be: and .
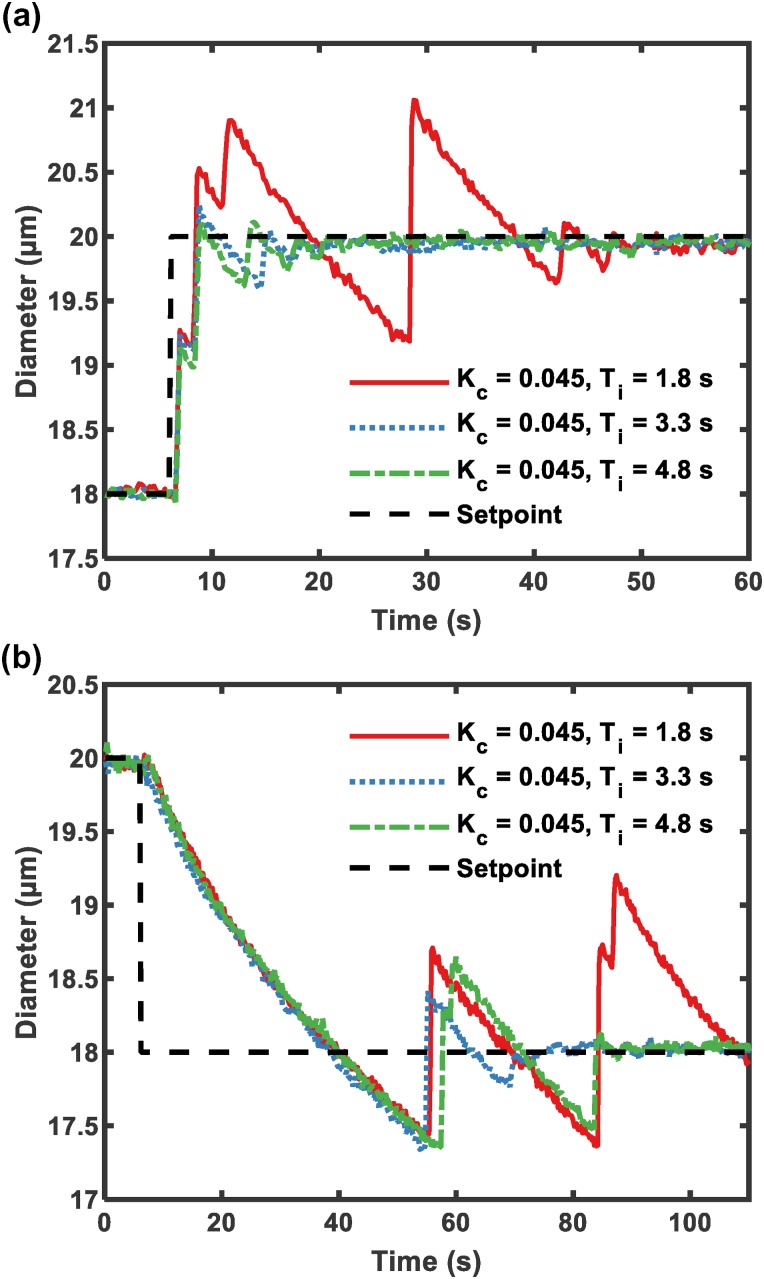
MBs were produced from 18 to 20 m under three sets of parameters in Fig. 5. Initially, the electrically determined MB diameter was stabilized at 18 m and the setpoint diameter was increased to 20 m; therefore, the input gas pressure was adjusted by . With increasing integral time in the PI controller, the overshoot decreased as anticipated and the system settling time was short ( s) in Fig. 5(a). When the integral time constant was too small (1.8 s), the system exhibited a larger oscillation and longer settling time. The result was different when it came to reducing the MB diameter. The time required to reduce MB diameter was shortened by releasing gas pressure of the regulator. The regulation of increasing and decreasing pressure is achieved by different motions of mechanical parts within the regulator, so the control of diameter in Figs. 5(a) and 5(b) behaves differently.43 It takes longer to reduce the inner pressure of the gas channel than it does to inflate the channel by the same pressure. As expected, the rate of pressure loss in Fig. 5(b) using different parameters was basically the same.
FIG. 5.
Step responses of closed-loop control FFMD system with three different sets of parameters. (a) Increase from 18 to 20 m. (b) Decrease from 20 to 18 m.
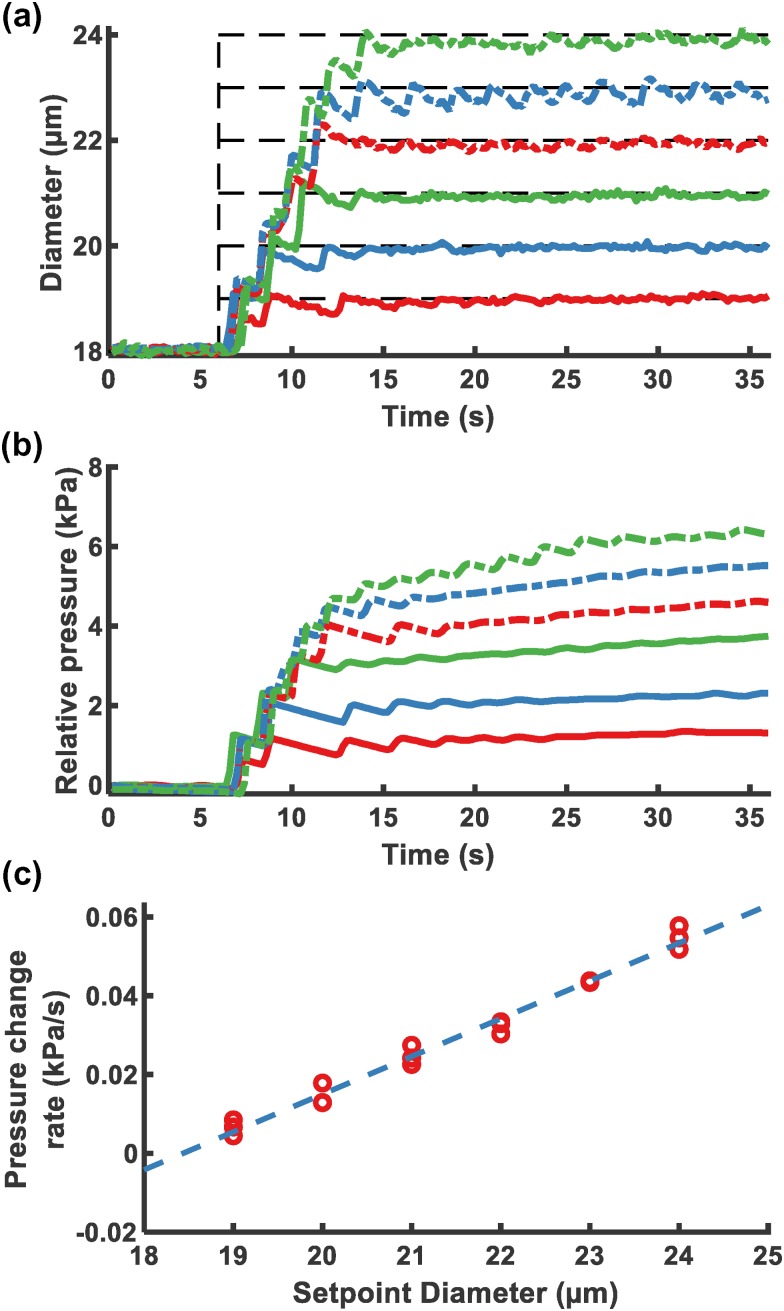
Figure 6(a) demonstrates the response of the system at varying setpoints. The difference between the original and the destination setpoint diameter determined the requisite gas pressure change and the settling time. The destination setpoint diameter was associated with the pressure that was needed to maintain the MB diameter. As observed, when the MB diameter was changed from 18 to 24 m, the electrically determined diameter took longer to settle and demonstrated more obvious fluctuations than cases in which the destination diameter was closer to the setpoint diameter.
FIG. 6.
Step responses of feedback control FFMD with various destination setpoints at a flow rate of 22 L/min with and s. (a) Measured diameter of different setpoint diameters from 18 m. The dashed line is the setpoint diameter. (b) Relative measured input gas pressure over time. The lines correspond to the process with the same line type and color in (a). (c) Change rate of relative pressure 15–36 s vs setpoint diameter.
The relative input gas pressure to the initial pressure at s was recorded in Fig. 6(b). The change in pressure was related to the destination setpoint. A linear fit was performed for pressure vs time when the electrically determined diameter became stabilized ( s). The rate of pressure change was linear with respect to the setpoint diameter (). This suggests that to maintain a stable diameter in an FFMD, the input pressure should change with a constant rate for a fixed flow rate.
E. Multiple step changes of diameter
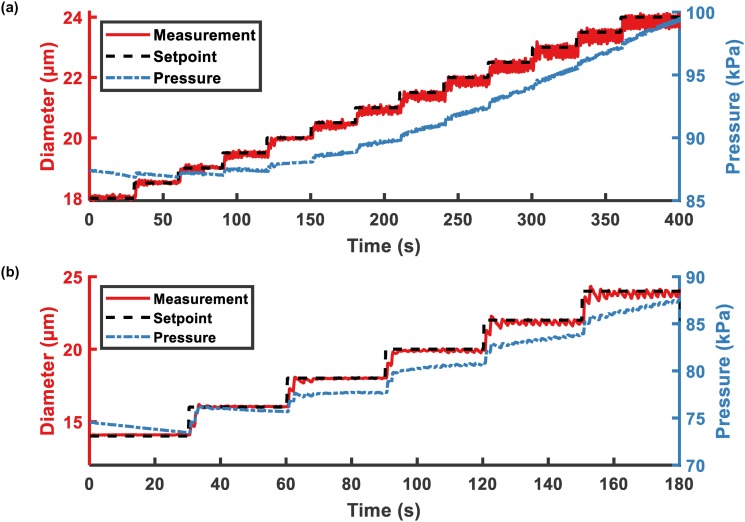
The multiple setpoint experiments used a PI controller with and s. Electrically determined diameters of MBs and corresponding input gas pressure were recorded, in Fig. 7(a), with an increment of 0.5 m and also in Fig. 7(b), with an increment of 2 m. The video of Fig. 7(b) is provided in the supplementary material.
FIG. 7.
Feedback control with multiple steps of electrically determined diameter. (a) MB electrically determined diameters were increased from 18 to 24 m by increments of 0.5 m every 30 s. (b) MB electrically determined diameters were increased from 14 to 24 m by increments of 2 m every 30 s.
With different step sizes, when the MB diameters were large (), the variation of the electrically determined diameters was significantly higher than those of smaller MBs. The oscillation in larger MBs was caused by the oscillation in input pressure. As discussed before, the pressure rate of change for larger MB was greater than for smaller MBs.
IV. DISCUSSION
The FFMD was designed to optimize the detection of impedance changes induced by the passage of large MBs (10–25 m) through the Coulter sensing zone. The electrode spacing and excitation frequency was optimized in silico for peak sensitivity when sensing MBs of diameter between 8 and 25 m, permitting real-time control of MB diameter using a closed-loop feedback control system. Remote monitoring and control of MB diameter within these ranges was successfully demonstrated across MB setpoint values between 14 and 24 m with effective settling times of less than 10 s.
The use of a control system to maintain a constant MB diameter is essential. As suggested in Figs. S2 and S3 in the supplementary material, when the input pressure of the gas regulator remained constant after disabling the controller, the production of MBs drifted to the steady state and the oscillation of MB diameter tended to increase. These undesirable effects were mitigated by the introduction of the controller, which actively adjusted the input gas pressure to maintain a constant MB diameter.
Unexpectedly, the gas pressure and the liquid flow rate required to maintain a specific MB diameter are not static parameters, but rather must be modified dynamically to maintain stable MB production. In the FFMD design studied, maintaining MB production at large diameters () required a continuously increasing gas pressure. This may be due to material compliance along the length of the gas tubing and the gas channel within the FFMD, in addition to a pressure drop when the electronic regulator delivers gas into the microfluidic device’s gas orifice. As a result, while MB diameter remained fixed, the MB production rate varied with increasing gas pressure, suggesting that both MB diameter and MB production rate cannot be controlled by only modulating the gas pressure. A potential consequence of continuously rising pressure is that it may lead to either the failure of the FFMD or the inability to exert input gas pressure beyond regulator’s range. When designing these systems, the material properties are critical factors to consider. The bond strength of the PDMS and glass wafer is weakest near the metalized electrodes, which can result in bond failure and leakage of liquid and gas near the electrodes. To improve the robustness of the design and to potentially mitigate the need to continually adjust the gas pressure in order to maintain a stable MB diameter, it may be worthwhile to consider alternative materials for liquid/gas phase delivery and FFMD construction. In particular, fused silica capillary tubing exhibits minimal elastic deformation in response to increased pressure, as has been used as conduit in high-pressure FFMD applications.9 Similarly, the FFMD channels may be etched in glass or silica to yield a rigid, noncompliant design with high bond strength.
Another noticeable phenomenon observed when modifying the MB diameter was the difference in the system’s step response when enlarging or shrinking the MB diameter. When using a step of same size (2 m), the settling time when enlarging the MB diameter was approximately three times less than when reducing the MB diameter. The observed difference in settling time is due to the working principle of the pressure regulator, which depressurizes much slower than it pressurizes. To rapidly reduce the MB diameter, a quick drop in pressure is required. Therefore, it is possible to insert an electronically controlled pressure-relief valve to accelerate depressurization. However, this scheme requires the coordination of two actuators, and the pressure-relief valve should only be activated when the setpoint diameter is lower than the previous setpoint. This is a feasible extension of the system studied in this work and may be required for some applications.
During MB production, a large change of input gas pressure led to instability of the system. An immediate jump in gas pressure larger than 2 kPa or multiple jumps of pressure larger than 5 kPa resulted in the production of polydisperse microbubbles or gas thread blowing through the nozzle. To avoid the production of polydisperse MBs or gas blow-through, multiple small step increases or decreases in MB diameter (Fig. 7) were implemented to address the problem. A more sophisticated control method, not implemented here, could be a ramped transition of MB diameter, rather than a stepped transition. A feasible way to achieve this is to linearly update the setpoint diameter at each measurement. Notably, the demodulated signal is an appropriate indicator of abnormal FFMD operation. The value and its deviation are useful to determine whether the FFMD is producing monodisperse, polydisperse or no MBs. If the FFMD enters into an abnormal state, one possible recovery method would be to constrain the gas and liquid supply and reinitialize the system.
Alternative on-chip measurement approaches exist for detecting and measuring particle size, including optical techniques based on light-scattering or light-blocking in the detection region of an FFMD.44,45 However, the advantages of using an electrical method are that it enables: (1) miniaturization beyond that which is possible for optical-based approaches, (2) robust operation without dependence on precise optical alignment, and (3) facile integration into medical catheters to enable remote operation for intravascular treatment. Additionally, Coulter-based methods are likely lower-cost and more reliably manufactured than optical-based approaches.
We elected to use an electronic gas regulator as the actuator of the feedback control system. Feedback by adjusting the liquid flow rate is an alternative method that was not studied in this work, but is likely equally as effective. Although the motivation for the development of a feedback control system stems from our target application of sonothrombolysis, the method can be implemented in any on-chip setting that requires real-time monitoring and control over microfluidic particle production.
V. CONCLUSION
In the present study, a closed-loop feedback control system was implemented in a benchtop FFMD with an integrated CPC. The device was fabricated using micro-fabrication methods and demonstrated production of MBs between 13 and 28 m. The CPC detected the passage of MBs and the electrical signal was captured simultaneously with optical images. Simulation informed the relation of the MB diameter and the maximum impedance, so that the time-averaged maximum voltage was extracted from the electrical signal and fit into a cubic polynomial with an optically determined diameter. The empirical relationship between electrically and optically determined diameters was measured and validated, enabling the real-time measurement of MB diameter. A PI feedback controller was incorporated into the system and adjusted the input gas pressure to control the MB diameter. Different parameters were implemented and the responses were characterized. The recorded pressure indicated that the MB diameter from the FFMD design was associated with the change rate of pressure. Further, by a multiple setpoint scheme, MB diameters were varied from 14 to 24 m. The implementation of this method provides the advantage of blind operation without a microscope.
SUPPLEMENTARY MATERIAL
See the supplementary material for the system response with a proportional controller (Fig. S1), without a controller (Figs. S2 and S3), and an example of the optical and electronic methods utilized for counting MBs (Fig. S4).
ACKNOWLEDGMENTS
This work was supported in part by the National Institutes of Health (NIH, Grant Nos. S10RR025594 and R01 HL141752) to J.A.H. The content in this work are the authors’ own views and does not necessarily represent the official views of the NIH and NSF.
The University of Virginia owns a patent disclosure related to this work.
DATA AVAILABILITY
The data that support the findings of this study are available within the article and its supplementary material.
REFERENCES
- 1.Keller M. W., Feinstein S. B., and Watson D. D., “Successful left ventricular opacification following peripheral venous injection of sonicated contrast agent: An experimental evaluation,” Am. Heart. J. 114, 570–575 (1987). 10.1016/0002-8703(87)90754-X [DOI] [PubMed] [Google Scholar]
- 2.Wei K., Jayaweera A. R., Firoozan S., Linka A., Skyba D. M., and Kaul S., “Quantification of myocardial blood flow with ultrasound-induced destruction of microbubbles administered as a constant venous infusion,” Circulation 97, 473–483 (1998). 10.1161/01.CIR.97.5.473 [DOI] [PubMed] [Google Scholar]
- 3.Bardin D., Martz T. D., Sheeran P. S., Shih R., Dayton P. A., and Lee A. P., “High-speed, clinical-scale microfluidic generation of stable phase-change droplets for gas embolotherapy,” Lab Chip 11, 3990–3998 (2011). 10.1039/C1LC20615J [DOI] [PMC free article] [PubMed] [Google Scholar]
- 4.Martz T. D., Sheeran P. S., Bardin D., Lee A. P., and Dayton P. A., “Precision manufacture of phase-change perfluorocarbon droplets using microfluidics,” Ultrasound Med. Biol. 37, 1952–1957 (2011). 10.1016/j.ultrasmedbio.2011.08.012 [DOI] [PMC free article] [PubMed] [Google Scholar]
- 5.Prentice P., Cuschieri A., Dholakia K., Prausnitz M., and Campbell P., “Membrane disruption by optically controlled microbubble cavitation,” Nat. Phys. 1, 107–110 (2005). 10.1038/nphys148 [DOI] [Google Scholar]
- 6.van Wamel A., Kooiman K., Harteveld M., Emmer M., ten Cate F. J., Versluis M., and de Jong N., “Vibrating microbubbles poking individual cells: Drug transfer into cells via sonoporation,” J. Control. Release 112, 149–155 (2006). 10.1016/j.jconrel.2006.02.007 [DOI] [PubMed] [Google Scholar]
- 7.Dixon A. J., Dhanaliwala A. H., Chen J. L., and Hossack J. A., “Enhanced intracellular delivery of a model drug using microbubbles produced by a microfluidic device,” Ultrasound Med. Biol. 39, 1267–1276 (2013). 10.1016/j.ultrasmedbio.2013.01.023 [DOI] [PMC free article] [PubMed] [Google Scholar]
- 8.Dixon A. J., Rickel J. M. R., Shin B. D., Klibanov A. L., and Hossack J. A., “In vitro sonothrombolysis enhancement by transiently stable microbubbles produced by a flow-focusing microfluidic device,” Ann. Biomed. Eng. 46, 222–232 (2018). 10.1007/s10439-017-1965-7 [DOI] [PMC free article] [PubMed] [Google Scholar]
- 9.Dixon A. J., Li J., Rickel J.-M. R., Klibanov A. L., Zuo Z., and Hossack J. A., “Efficacy of sonothrombolysis using microbubbles produced by a catheter-based microfluidic device in a rat model of ischemic stroke,” Ann. Biomed. Eng. 47, 1012–1022 (2019). 10.1007/s10439-019-02209-0 [DOI] [PMC free article] [PubMed] [Google Scholar]
- 10.Alexandrov A. V., Garami Z., Montaner J., and Moyé L. A., “Ultrasound-enhanced systemic thrombolysis for acute ischemic stroke,” New Engl. J. Med. 351, 2170–2178 (2004). [DOI] [PubMed] [Google Scholar]
- 11.Molina C. A., Ribo M., Rubiera M., Montaner J., Santamarina E., Delgado-Mederos R., Arenillas J. F., Huertas R., Purroy F., Delgado P., and Alvarez-Sabín J., “Microbubble administration accelerates clot lysis during continuous 2-MHz ultrasound monitoring in stroke patients treated with intravenous tissue plasminogen activator,” Stroke 37, 425–429 (2006). 10.1161/01.STR.0000199064.94588.39 [DOI] [PubMed] [Google Scholar]
- 12.Berkhemer O. A., Fransen P. S., Beumer D., van den Berg L. A., Lingsma H. F., Yoo A. J., Schonewille W. J., Vos J. A., Nederkoorn P. J., Wermer M. J., van Walderveen M. A., Staals J., Hofmeijer J., van Oostayen J. A., Lycklama à Nijeholt G. J., Boiten J., Brouwer P. A., Emmer B. J., de Bruijn S. F., van Dijk L. C., Kappelle L. J., Lo R. H., van Dijk E. J., de Vries J., de Kort P. L., van Rooij W. J. J., van den Berg J. S., van Hasselt B. A., Aerden L. A., Dallinga R. J., Visser M. C., Bot J. C., Vroomen P. C., Eshghi O., Schreuder T. H., Heijboer R. J., Keizer K., Tielbeek A. V., den Hertog H. M., Gerrits D. G., van den Berg-Vos R. M., Karas G. B., Steyerberg E. W., Flach H. Z., Marquering H. A., Sprengers M. E., Jenniskens S. F., Beenen L. F., van den Berg R., Koudstaal P. J., van Zwam W. H., Roos Y. B., van der Lugt A., van Oostenbrugge R. J., Majoie C. B., and Dippel D. W., “A randomized trial of intraarterial treatment for acute ischemic stroke,” New Engl. J. Med. 372, 11–20 (2015). 10.1056/NEJMoa1411587 [DOI] [PubMed] [Google Scholar]
- 13.Fritz T., Unger E., Sutherland G., and Sahn D., “Phase I clinical trials of MRX-115: A new ultrasound contrast agent,” Invest. Radiol. 32, 735–740 (1997). 10.1097/00004424-199712000-00003 [DOI] [PubMed] [Google Scholar]
- 14.Klibanov A. L., “Ultrasound Contrast Agents: Development of the Field and Current Status,” in Contrast Agents II: Optical, Ultrasound, X-Ray and Radiopharmaceutical Imaging, Topics in Current Chemistry, edited by W. Krause (Springer, Berlin, Heidelberg, 2002), pp. 73–106. 10.1007/3-540-46009-8_3 [DOI]
- 15.Emmer M., Vos H. J., Goertz D. E., van Wamel A., Versluis M., and de Jong N., “Pressure-dependent attenuation and scattering of phospholipid-coated microbubbles at low acoustic pressures,” Ultrasound Med. Biol. 35, 102–111 (2009). 10.1016/j.ultrasmedbio.2008.07.005 [DOI] [PubMed] [Google Scholar]
- 16.Goertz D. E., de Jong N., and van der Steen A. F. W., “Attenuation and size distribution measurements of definityTM and manipulated definityTM populations,” Ultrasound Med. Biol. 33, 1376–1388 (2007). 10.1016/j.ultrasmedbio.2007.03.009 [DOI] [PubMed] [Google Scholar]
- 17.Feshitan J. A., Chen C. C., Kwan J. J., and Borden M. A., “Microbubble size isolation by differential centrifugation,” J. Colloid Interface Sci. 329, 316–324 (2009). 10.1016/j.jcis.2008.09.066 [DOI] [PubMed] [Google Scholar]
- 18.Kok M. P., Segers T., and Versluis M., “Bubble sorting in pinched microchannels for ultrasound contrast agent enrichment,” Lab Chip 15, 3716–3722 (2015). 10.1039/C5LC00370A [DOI] [PubMed] [Google Scholar]
- 19.Segers T. and Versluis M., “Acoustic bubble sorting for ultrasound contrast agent enrichment,” Lab Chip 14, 1705–1714 (2014). 10.1039/C3LC51296G [DOI] [PubMed] [Google Scholar]
- 20.Garstecki P., Fuerstman M. J., Stone H. A., and Whitesides G. M., “Formation of droplets and bubbles in a microfluidic T-junction-scaling and mechanism of break-up,” Lab Chip 6, 437–446 (2006). 10.1039/b510841a [DOI] [PubMed] [Google Scholar]
- 21.Gañán-Calvo A. M. and Gordillo J. M., “Perfectly monodisperse microbubbling by capillary flow focusing,” Phys. Rev. Lett. 87, 274501 (2001). 10.1103/PhysRevLett.87.274501 [DOI] [PubMed] [Google Scholar]
- 22.Hettiarachchi K., Talu E., Longo M. L., Dayton P. A., and Lee A. P., “On-chip generation of microbubbles as a practical technology for manufacturing contrast agents for ultrasonic imaging,” Lab Chip 7, 463–468 (2007). 10.1039/B701481N [DOI] [PMC free article] [PubMed] [Google Scholar]
- 23.Castro-Hernández E., Hoeve W. v., Lohse D., and Gordillo J. M., “Microbubble generation in a co-flow device operated in a new regime,” Lab Chip 11, 2023–2029 (2011). 10.1039/C0LC00731E [DOI] [PubMed] [Google Scholar]
- 24.Garstecki P., Gitlin I., DiLuzio W., Whitesides G. M., Kumacheva E., and Stone H. A., “Formation of monodisperse bubbles in a microfluidic flow-focusing device,” Appl. Phys. Lett. 85, 2649–2651 (2004). 10.1063/1.1796526 [DOI] [Google Scholar]
- 25.Talu E., Hettiarachchi K., Powell R. L., Lee A. P., Dayton P. A., and Longo M. L., “Maintaining monodispersity in a microbubble population formed by flow-focusing,” Langmuir 24, 1745–1749 (2008). 10.1021/la703065v [DOI] [PMC free article] [PubMed] [Google Scholar]
- 26.Dhanaliwala A. H., Chen J. L., Wang S., and Hossack J. A., “Liquid flooded flow-focusing microfluidic device for in situ generation of monodisperse microbubbles,” Microfluid. Nanofluidics. 14, 457–467 (2013). 10.1007/s10404-012-1064-x [DOI] [PMC free article] [PubMed] [Google Scholar]
- 27.Choi J. J., Feshitan J. A., Baseri B., Wang S., Tung Y.-S., Borden M. A., and Konofagou E. E., “Microbubble-size dependence of focused ultrasound-induced blood–brain barrier opening in mice in vivo,” IEEE Trans. Biomed. Eng. 57, 145–154 (2010). 10.1109/TBME.2009.2034533 [DOI] [PMC free article] [PubMed] [Google Scholar]
- 28.Al-Mutairi S. H., Nasr-El-Din H. A., Hill A. D., and Al-Aamri A., “Effect of droplet size on the reaction kinetics of emulsified acid with calcite,” SPE J. 14, 606–616 (2009). 10.2118/112454-PA [DOI] [Google Scholar]
- 29.Coulter W. H., “Means for counting particles suspended in a fluid,” U.S. patent 2656508A (October 20, 1953).
- 30.Gawad S., Schild L., and Renaud P., “Micromachined impedance spectroscopy flow cytometer for cell analysis and particle sizing,” Lab Chip 1, 76–82 (2001). 10.1039/B103933B [DOI] [PubMed] [Google Scholar]
- 31.Jagtiani A. V., Carletta J., and Zhe J., “An impedimetric approach for accurate particle sizing using a microfluidic coulter counter,” J. Micromech. Microeng. 21, 045036 (2011). 10.1088/0960-1317/21/4/045036 [DOI] [Google Scholar]
- 32.Rickel J. M. R., Dixon A. J., Klibanov A. L., and Hossack J. A., “A flow focusing microfluidic device with an integrated coulter particle counter for production, counting and size characterization of monodisperse microbubbles,” Lab Chip 18, 2653–2664 (2018). 10.1039/C8LC00496J [DOI] [PMC free article] [PubMed] [Google Scholar]
- 33.DeBlois R. W. and Bean C. P., “Counting and sizing of submicron particles by the resistive pulse technique,” Rev. Sci. Instrum. 41, 909–916 (1970). 10.1063/1.1684724 [DOI] [Google Scholar]
- 34.Saleh O. A. and Sohn L. L., “Quantitative sensing of nanoscale colloids using a microchip coulter counter,” Rev. Sci. Instrum. 72, 4449–4451 (2001). 10.1063/1.1419224 [DOI] [Google Scholar]
- 35.Lee G.-B., Lin C.-H., and Chang G.-L., “Micro flow cytometers with buried SU-8/SOG optical waveguides,” Sensor Actuat. A 103, 165–170 (2003). 10.1016/S0924-4247(02)00305-9 [DOI] [Google Scholar]
- 36.Miller E., Rotea M., and Rothstein J. P., “Microfluidic device incorporating closed loop feedback control for uniform and tunable production of micro-droplets,” Lab Chip 10, 1293–1301 (2010). 10.1039/B925497H [DOI] [PubMed] [Google Scholar]
- 37.Zeng W., Li S., and Wang Z., “Closed-loop feedback control of droplet formation in a T-junction microdroplet generator,” Sensor Actuat. A 233, 542–547 (2015). 10.1016/j.sna.2015.08.002 [DOI] [Google Scholar]
- 38.Fu H., Zeng W., Li S., and Yuan S., “Electrical-detection droplet microfluidic closed-loop control system for precise droplet production,” Sensor Actuat. A 267, 142–149 (2017). 10.1016/j.sna.2017.09.043 [DOI] [Google Scholar]
- 39.Gawad S., Cheung K., Seger U., Bertsch A., and Renaud P., “Dielectric spectroscopy in a micromachined flow cytometer: Theoretical and practical considerations,” Lab Chip 4, 241–251 (2004). 10.1039/b313761a [DOI] [PubMed] [Google Scholar]
- 40.Hoffman R. A. and Britt W. B., “Flow-system measurement of cell impedance properties,” J. Histochem. Cytochem. 27, 234–240 (1979). 10.1177/27.1.374580 [DOI] [PubMed] [Google Scholar]
- 41.Cheung K., Gawad S., and Renaud P., “Impedance spectroscopy flow cytometry: On-chip label-free cell differentiation,” Cytom. Part A: J. Int. Soc. Anal. Cytol. 65, 124–132 (2005). 10.1002/cyto.a.20141 [DOI] [PubMed] [Google Scholar]
- 42.Ziegler J. G. and Nichols N. B., “Optimum settings for automatic controllers,” ASME J. Dyn. Sys., Meas., Control 115(2B), 220–222 (1993). 10.1115/1.2899060 [DOI] [Google Scholar]
- 43.Roulet D. R., “Pneumatic pressure regulator,” U.S. patent 5,694,965 (December 9, 1997).
- 44.Pamme N., Koyama R., and Manz A., “Counting and sizing of particles and particle agglomerates in a microfluidic device using laser light scattering: Application to a particle-enhanced immunoassay,” Lab Chip 3, 187–192 (2003). 10.1039/B300876B [DOI] [PubMed] [Google Scholar]
- 45.Xiang Q., Xuan X., Xu B., and Li D., “Multi-functional particle detection with embedded optical fibers in a poly(dimethylsiloxane) chip,” Instrum. Sci. Technol. 33, 597–607 (2005). 10.1080/10739140500226858 [DOI] [Google Scholar]
Associated Data
This section collects any data citations, data availability statements, or supplementary materials included in this article.
Supplementary Materials
See the supplementary material for the system response with a proportional controller (Fig. S1), without a controller (Figs. S2 and S3), and an example of the optical and electronic methods utilized for counting MBs (Fig. S4).
Data Availability Statement
The data that support the findings of this study are available within the article and its supplementary material.


