

Abstract
Continuously elevated levels of growth hormone (GH) during life in mice are associated with hepatomegaly due to hepatocytes hypertrophy and hyperplasia, chronic liver inflammation, elevated levels of arachidonic acid (AA) at young ages and liver tumors development at old ages. In this work, the hepatic expression of enzymes involved in AA metabolism, cPLA2α, COX1 and COX2 enzymes, was evaluated in young and old GH-transgenic mice. Mice overexpressing GH exhibited higher hepatic expression of cPLA2α, COX1 and COX2 in comparison to controls at young and old ages and in both sexes. In old mice, when tumoral and non-tumoral tissue were compared, elevated expression of COX2 was observed in tumors. In contrast, exposure to continuous lower levels of hormone for a short period affected only COX1 expression in males. Considering the role of inflammation during liver tumorigenesis, these findings support a role of alterations in AA metabolism in GH-driven liver tumorigenesis.
Keywords: growth hormone, cyclooxygenase, phospholipase A2, liver cancer
1. Introduction
Growth hormone (GH) has a prominent role in the stimulation of body growth and metabolism. It also influences cardiovascular, renal, reproductive and immune functions and regulates body composition (Chhabra et al., 2011, Chia, 2014, Guevara-Aguirre et al., 2018). Accordingly, GH therapy restores growth velocity in GH-deficient children and improves body composition, exercise capacity, skeletal integrity and quality of life in GH-deficient adults (Chia, 2014, Pekic et al., 2017). It exerts its actions on different tissues through its membrane receptor, which triggers multiple intracellular signaling pathways and induces the expression of different genes. Insulin-like growth factor-1 (IGF-1) is a key transcriptional target of GH in liver and other tissues and is the principal mediator of many GH actions (Chhabra et al., 2011, Chia, 2014, Guevara-Aguirre et al., 2018).
Elevated levels of GH and IGF-1 promote hyperplasia, hypertrophy and alterations in metabolism that may lead to different pathologies. In particular, the potential role of GH and IGF-1 in the genesis and progression of cancer was recognized several years ago and has been the focus of interest in recent years (Jenkins et al., 2006, Perry et al., 2013, Pekic et al., 2017, Guevara-Aguirre et al., 2018, Boguszewski et al., 2019). As these peptides promote cell proliferation, cell movement and angiogenesis and have anti-apoptotic effects, dysregulation of GH/IGF-1 axis may be linked to cancer occurrence or promotion (Chhabra et al., 2011, Pekic et al., 2017). Indeed, evidence from epidemiologic, animal and in vitro studies support the notion that the state of the GH/IGF-1 axis influences carcinogenesis (Chhabra et al., 2011, Pekic et al., 2017, Boguszewski et al., 2019). In patients with hepatocellular carcinoma (HCC), increased GH expression was observed in tumors in comparison to non-tumoral surrounding tissue and GH levels were significantly associated with tumor size, higher histological grade and poor patient survival (Kong et al., 2016). Moreover, these authors have shown in vivo that autocrine expression of GH promoted oncogenicity and HCC xenograft growth (Kong et al., 2016).
Liver is a major target for GH action, where GH signaling is necessary for normal hepatocyte proliferation and liver regeneration (Chia, 2014). In rodents, a role for GH in liver tumorigenesis is particularly evident. GH deficiency was reported to suppress carcinogen-induced liver tumor development in mice (Bugni et al., 2001). In contrast, transgenic mice overexpressing GH are more susceptible to hepatocarcinogenesis. These mice exhibit hepatomegaly associated with hypertrophy and hyperplasia of hepatocytes since young ages (Snibson et al., 1999, Miquet et al., 2013, Martinez et al., 2016). A state of sustained increase in hepatocyte turnover and chronic inflammation precedes the development of liver tumors, including HCC, which are most commonly observed within a year (Quaife et al., 1989, Orian et al., 1990, Snibson et al., 1999, Bartke, 2003, Kopchick et al., 2014). The hepatocarcinogenesis observed in GH-transgenic mice seems to be a direct consequence of elevated GH levels, since IGF-1-transgenic mice do not develop liver tumors (Quaife et al., 1989, Bartke, 2003, Kopchick et al., 2014). Moreover, the liver pathology would not be due to the expression of the transgene in the liver or to the abnormal actions of heterologous GH, since transgenic mice for GH releasing-hormone present similar liver abnormalities (Bartke, 2003). Importantly, we have reported the dysregulation of several oncogenic pathways in young adult GH-transgenic mice (Miquet et al., 2008, Miquet et al., 2013, Bacigalupo et al., 2019), some of which are altered since early ages (Martinez et al., 2016). The molecular alterations and the preneoplastic liver pathology observed in these animals are similar to those present in patients at high risk of developing hepatic cancer (Snibson et al., 1999, Snibson, 2002, Miquet et al., 2013).
The process of hepatic carcinogenesis involves sequential events including chronic inflammation, hyperplasia of hepatocytes, dysplasia and, finally, malignant transformation (Snibson et al., 1999, Wu, 2006, Schlageter et al., 2014, Llovet et al., 2016). Several lines of evidence point to an important role of mediators of inflammation, such as prostaglandins (PGs), in liver carcinogenesis (Wu, 2006, Wang et al., 2010, Zang et al., 2017, Kim et al., 2018).
In a study using transgenic mice overexpressing ovine GH under the control of the metallothionein promoter (Mt-oGH), the long-term exposure to GH was associated with elevated levels of arachidonic acid (AA) in the liver and of one of its metabolites, prostaglandin E2 (PGE2), in serum (Oberbauer et al., 2011). AA is the long chain polyunsaturated fatty acid most abundant in biological membranes. Its release from membrane-bound phospholipids for subsequent prostaglandin synthesis is primarily catalyzed by the cytosolic phospholipase A2α (cPLA2α). AA is then transformed to eicosanoids by the action of cyclooxygenases COX1 and COX2 (Niknami et al., 2009, Dennis et al., 2011, Kim et al., 2018). Higher hepatic mRNA levels of COX enzymes have also been described in Mt-oGH mice (Oberbauer et al., 2011).
Altered metabolism of AA and lipid mediators have been associated with pathogenesis of cancers, including HCC (Subbaramaiah et al., 2003, Chi-Man Tang et al., 2005, Cervello et al., 2006, Nakanishi et al., 2006, Wu, 2006, Breinig et al., 2007, Martín-Sanz et al., 2010, Wang et al., 2010, Kim et al., 2018). Therefore, the enhanced AA metabolism reported in Mt-oGH transgenic mice may constitute an unrecognized molecular mechanism implicated in the liver pathology that develops in mice overexpressing GH. However, in that report (Oberbauer et al., 2011) no histopathological study of the liver was performed and the possible association of these findings with the hepatocarcinogenesis process was not explored.
In order to investigate if alterations in AA metabolism may be associated with the process of liver carcinogenesis observed in GH-transgenic mice, we used transgenic mice overexpressing bovine GH, in which we have already described that several signaling mediators involved in cell proliferation are exacerbated in young animals (Miquet et al., 2008, Miquet et al., 2013, Martinez et al., 2016). In the present work, we have determined the expression of key enzymes involved in AA metabolism and production of PGs, namely, cPLA2α, COX1 and COX2, in the liver of young adult GH-transgenic mice, which exhibit preneoplastic liver pathology, and in old animals, which display marked hepatic alterations and frequently develop tumors. In addition, we assessed if a short-term continuous administration of GH could induce changes in cyclooxygenases liver expression.
The results of the present study contribute to better characterize the molecular alterations associated with sustained exposure to high GH levels that may play a prominent role in the process of liver carcinogenesis. The elucidation of the molecular mechanisms underlying GH action may have important implications in understanding human health and disease (Chia, 2014).
2. Materials and methods
2.1. Transgenic mice overexpressing growth hormone
Transgenic PEPCK-bGH mice used express the bovine GH gene linked to control sequences of the rat phosphoenolpyruvate carboxykinase (Pepck). These mice exhibit accelerated postweaning growth that lead to a significant increase in body weight and organomegaly. Normal-sized siblings were used as controls. Breeding system, animal housing and feeding conditions have been previously described (McGrane et al., 1988, Miquet et al., 2013).
Young (2 months old) and old (10–13 months old) animals were used. Mice were fasted for 5h and anesthetized with isofluorane. Blood samples were collected by intracardiac puncture and animals were immediately sacrificed by cervical dislocation to remove the liver. Serum was separated by standard procedures and kept at −70°C until use together with liver. In old GH-transgenic mice, liver tumor and non-tumor areas were dissected, processed in parallel, and stored as described above. A piece of liver from each animal was fixed and paraffinized following standard procedures for histopathological analysis.
The appropriateness of the experimental procedure followed NIH Guidelines for the Care and Use of Experimental Animals and protocols were approved by the Laboratory Animal Care and Use Committee of Southern Illinois University (Springfield, IL, USA).
2.2. Swiss-Webster mice treated with growth hormone
Adult (3–4 months old) Swiss-Webster female and male mice were used. Animal housing and feeding conditions have been previously described (Bacigalupo et al., 2019). Highly purified porcine GH (Zamira Life Sciences Pty Ldt, Knoxfield, VIC, Australia) was continuously administered to these mice by subcutaneous implantation of osmotic minipumps (model 1007D, Alzet, Cupertino, CA, USA) that deliver hormone at a dose of 1mg/kg of body weight per day, as previously described (Díaz et al., 2014). Saline solution was administered to control animals in a similar fashion. After five days of treatment, animals were fasted for 6h and sacrificed by cervical dislocation. Livers were removed and stored at −70°C.
Experiments were conducted following institutional regulations and protocols approved by the Laboratory Animal Care Committee of the School of Pharmacy and Biochemistry of the University of Buenos Aires.
2.3. Serum alanine transaminase (ALT) determination
Serum alanine transaminase (ALT) enzymatic activity was measured by a commercial kit (Transaminasas 200, Wiener lab Group, Rosario, Santa Fe, Argentina) based on the reaction catalyzed by ALT between L-alanine and α-ketoglutarate, coupled to a colorimetric reaction.
2.4. Histology and immunohistochemical staining
Liver sections were stained with hematoxylin and eosin (H&E) following standard procedures for histomorphological evaluation. For immunostaining, procedures previously described were used (Bacigalupo et al., 2019) and sections were incubated with anti-PCNA (proliferating cell nuclear antigen, 1:100, sc-7907, Santa Cruz Biotechnology, Dallas, TX, USA), anti-GHR (1:100, kindly provided by Dr. S.J. Frank) (Zhang et al., 2001), anti-IGF-1R (1:100, sc-713, Santa Cruz Biotechnology), anti-COX1 (1:200, Ab109025, Abcam, Cambridge, UK) or anti-COX2 (1:200, Ab15191, Abcam) antibodies. Negative controls were performed in parallel by replacing primary antibody with PBS.
H&E and immunostained sections were observed using a light microscope (DM2000, Leica Microsystems, Wetzlar, Germany); representative photomicrographs were obtained by a Leica DFC400 digital camera and Leica Application Suite software (Leica Microsystems). At least 20 optical fields were examined.
Cell and nuclear size of hepatocytes were estimated by counting the number of hepatocytes per field and measuring the nuclear area, respectively. Hepatocyte proliferation was determined by immunostaining for proliferating cell nuclear antigen (PCNA) and expressed as the percentage of PCNA-positive (brown stained) nuclei. Measurements were performed using ImageJ 1.45s software. At least 10 fields were analyzed, and all hepatocytes within the field were counted.
2.5. Immunoblotting
Liver extracts were obtained and subjected to SDS-polyacrilamide electrophoresis and immunoblotting as previously described (Miquet et al., 2013, Bacigalupo et al., 2019). The following primary antibodies were used: anti-COX1 (1:1000, Ab109025, Abcam), anti-COX2 (1:1000, 160106, Cayman Chemical, Ann Arbor, MI, USA), anti-phospho-cPLA2 Ser505 (1:500, 2831, Cell Signaling Technology, Danvers, MA, USA) or anti-cPLA2 (1:500, 2832, Cell Signaling Technology). After detection of immunoreactive bands by chemiluminiscence, membranes were stained with Coomassie Blue to control for total protein load and blotting efficiency (Welinder et al., 2011, Bacigalupo et al., 2019) instead of immunoblotting of standard proteins since hepatic protein abundance of actin and tubulin exhibits genotype-dependent variations (Miquet et al., 2013, Martinez et al., 2015). Intensity of the bands detected after chemiluminescence reaction and Coomassie Blue staining was quantified using Gel-Pro Analyzer software (Media Cybernetics).
2.6. Quantitative Real-time reverse transcriptase PCR (RT-qPCR)
Total RNA was extracted from liver tissue and retrotranscribed to cDNA as previously described and following standard procedures (Bacigalupo et al., 2019). Primers were designed for specific amplification of GHR, IGF-1R, cPLA2α and Cyclophilin A as reference gene, following general recommendations. Primers were obtained from Invitrogen™ with sequences (5’→3’): GHR F: CCAACTCGCCTCTACACC, GHR R: GGGAAAGGACTACACCACCTG, IGF-1R F: TGCCAGTGAGGTTGAAGTAA, IGF-1R R: CGAGCCTTTTGACTTTTGTT, cPLA2α F: TCAAGGACCCAAAGGCACCGA, cPLA2α R: CGGCACGTCCTTCTCGGGTA, Cyclophilin A F: GCGTCTCCTTGAGCTGTT, Cyclophilin A R: TCAGCCTGGTCAAAGGTGAT. Relative gene expression levels were calculated by the comparative cycle threshold (Ct) method (Pfaffl, 2001).
2.7. Statistical analysis
GraphPad Prism statistical program (GraphPad Software, San Diego, CA, USA) was used for statistical analysis. Results are expressed as the mean ± SEM of the indicated number (n) of different individuals per group. Two-way ANOVA and Bonferroni post-test were used to assess genotype and sex differences. Unpaired Student’s t-test was used to compare young and old animals of the same sex and genotype and control and GH-transgenic old mice (non–tumoral zone) of the same sex. To compare expression levels between tumoral and non-tumoral zone of the same old GH-transgenic mouse, paired Student’s t-test was applied. Differences between control and GH-treated Swiss-Webster mice of the same sex and age were assessed by unpaired Student’s t-test. Data were considered significantly different if P<0.05.
3. Results
3.1. Liver macroscopic analysis
Exposure to high GH levels in mice promotes hypertrophy and hyperplasia of hepatocytes that lead to hepatomegaly and, frequently, to liver tumor development (Orian et al., 1990, Snibson et al., 1999, Snibson, 2002). The disproportional growth of liver is evidenced even in absence of preneoplastic liver lesions (Martinez et al., 2016). In accordance with previous reports, young adult GH-transgenic mice used in this work exhibited hepatomegaly, manifested by a higher liver to body weight ratio (LW/BW) than normal mice, which was also observed in advanced age transgenic mice (Table 1). Higher LW/BW values were obtained in old GH-transgenic males in comparison to age-matched GH-overexpressing females. Besides, GH-transgenic males of advanced age exhibited a higher LW/BW ratio than young animals, while no age-related differences were found for the other groups analyzed.
Table 1.
Body and liver weight in young and old male and female GH-overexpressing transgenic mice and normal controls.
| Age | Genotype and sex | Body weight (g) | Liver weight (g) | Liver weight/body weight (%) |
|---|---|---|---|---|
| Young adult (n=8) | Normal females | 20.2 ± 0.6 a | 0.91 ± 0.04 a | 4.5 ± 0.2 a |
| Normal males | 24.4 ± 1.0 b | 1.10 ± 0.07 a | 4.5 ± 0.2 a | |
| Transgenic females | 36.1 ± 1.1 c | 2.7 ± 0.1 b | 7.4 ± 0.2 b | |
| Transgenic males | 37.6 ± 0.8 c | 2.8 ± 0.1 b | 7.4 ± 0.2 b | |
| Old (n=18–23) | Normal females | 33.9 ± 1.5 a **** | 1.27 ± 0.08 a ** | 3.9 ± 0.2 a |
| Normal males | 35.1 ± 1.5 a *** | 1.66 ± 0.07 a *** | 4.9 ± 0.2 a | |
| Transgenic females | 46.5 ± 1.0 b **** | 3.7 ± 0.1 b **** | 8.0 ± 0.2 b | |
| Transgenic males | 49.1 ± 2.2 b ** | 4.7 ± 0.3 c *** | 9.9 ± 0.6 c * |
Data are the mean ± SEM of the indicated number (n) of different individuals per group. Different letters denote significant differences between normal and GH-transgenic, male and female mice, assessed by two-way ANOVA (P<0.05). Asterisks indicate significant differences between young and old animals of the same sex and genotype by unpaired Student’s t-test.
P<0.05,
P<0.01,
P<0.001,
P<0.0001.
Liver examination revealed the presence of hepatic lesions in old GH-transgenic mice. In most cases, distinguishable tumors were found and were extracted to analyze and compare to adjacent tissue. In some cases, small nodules were also observed which could not be dissected to obtain enough tissue to perform the experiments. No macroscopic liver lesions were observed in young transgenic mice, the same as in young and old controls, according to previous reports (Miquet et al., 2013).
3.2. Serum alanine transaminase (ALT) determination
In order to assess liver damage, serum alanine transaminase (ALT) levels were determined (Table 2). Accompanying disproportional liver growth, overexpression of GH was associated with higher serum ALT levels than control mice, both in young and old animals. High levels of this enzyme in blood are indicative of liver injury or disease and are often found before any other symptom (Kim et al., 2008). When mice of different ages were compared, an increment in ALT levels with age was observed only in GH-transgenic mice. Similar genotype and age-related changes were observed for males and females. However, GH-transgenic male mice reached higher ALT levels than females at advanced ages.
Table 2.
Serum alanine transaminase (ALT) levels in young and old male and female GH-overexpressing transgenic mice and normal controls.
| Plasma ALT (U/L) | Young adult (n=17–21) | Old (n=27–31) |
|---|---|---|
| Normal females | 16 ± 3 a | 15 ± 2 a |
| Normal males | 14 ± 2 a | 16 ± 2 a |
| Transgenic females | 39 ± 3 b | 61 ± 5 b * |
| Transgenic males | 47 ± 4 b | 86 ± 5 c ** |
Data are the mean ± SEM of the indicated number (n) of different individuals per group. Different letters denote significant differences between normal and GH-transgenic, male and female mice, assessed by two-way ANOVA (P<0.05). Asterisks indicate significant differences between young and old animals of the same sex and genotype by unpaired Student’s t-test.
P<0.05,
P<0.01.
3.3. Liver histological analysis and evaluation of hepatocellular proliferation
Histological analysis of liver sections obtained from young mice overexpressing GH confirmed the preneoplastic morphological alterations previously described (Miquet et al., 2013, Martinez et al., 2016). Young GH-transgenic mice exhibited areas of cell dysplasia, predominantly at the centrolobular level, with hepatocytes presenting cellular and nuclear polymorphism (Supplementary Fig. 1 A–D). At advanced ages, overexpression of GH was associated with extensive areas of cell dysplasia in the entire hepatic lobule with distortion of histological architecture (Supplementary Fig. 1 E–I).
According to previous reports from our group, in young GH-transgenic mice these areas of dysplasia were characterized by hepatocytes presenting large cellular and nuclear size, together with exacerbated hepatocellular proliferation (Miquet et al., 2013). In this work, hepatocytes from old mice were analyzed. For GH-transgenic mice presenting liver tumors, tumoral and non-tumoral adjacent tissues were evaluated separately. Representative microphotographs from H&E sections are shown in Fig. 1A, 1I. Both female and male transgenic mice exhibited a significant decrease in the number of hepatocytes per microscope field in comparison to controls, indicative of hepatocyte enlargement (Fig. 1B, 1J). Transgenic mice also displayed significantly higher mean nuclear size than normal mice (Fig. 1D, 1L).
Figure 1. Microscopic analysis of livers from old male and female GH-overexpressing transgenic mice (T) and normal controls (N).

Liver sections from old female (A) and male (I), normal and GH-transgenic mice were stained with hematoxylin and eosin (H&E) and representative photomicrographs are shown (original magnification 400X). The number of hepatocytes per field, indicative of cell size, was analyzed in non-tumoral tissue from normal and GH-transgenic females (B) and males (J), and the comparison between tumoral and non-tumoral tissue was also performed in GH-transgenic females (C) and males (K). The mean hepatocyte nuclear area was measured in non-tumoral tissue from normal and GH-transgenic females (D) and males (L), and the comparison between tumoral and non-tumoral tissue was also performed in GH-transgenic females (E) and males (M). Hepatocellular proliferation was assessed by measuring the expression of the proliferating cell nuclear antigen (PCNA) by immunostaining in liver sections from old female (F) and male (N), normal and GH-transgenic mice and representative photomicrographs are shown (original magnification 400X). The percentage of positive PCNA nuclei was analyzed in non-tumoral tissue from normal and GH-transgenic females (G) and males (O), and the comparison between tumoral and non-tumoral tissue was also performed in GH-transgenic females (H) and males (P). Data are the mean ± SEM of the indicated number (n) of different individuals per group. Unpaired Student’s t-test was used to assess differences between normal and GH-transgenic mice, and paired Student’s t-test was used to assess differences between tumoral and non-tumoral tissue. ns stands for non-significant.
Comparison of tumoral and non-tumoral tissue was also performed and a higher number of hepatocytes per field was found in liver tumors both from male and female transgenic mice (Fig. 1C, 1K). When nuclear area was evaluated, tumoral tissue in females displayed hepatocytes with smaller nucleus than those from the adjacent non-tumoral tissue (Fig. 1E). In contrast, no significant differences in the nuclear area were found in hepatocytes from the liver of male transgenic mice (Fig. 1M).
Cell proliferation was evaluated in old mice by the analysis of the S-phase-related proliferating nuclear antigen (PCNA). Representative microphotographs are shown in Fig. 1F, 1N. The percentage of PCNA positive nuclei was higher in female and male mice overexpressing GH in comparison to controls (Fig. 1G, 1O). When PCNA staining was assessed to compare the tumoral and non-tumoral zone, lower levels were found in the tumoral zone in female mice, while non-significant differences were observed in males (Fig. 1H, 1P). Negative controls demonstrated reaction specificity (Supplementary Fig. 2A).
These results indicate that GH-overexpression is associated with dysplastic lesions and an exacerbated proliferation of liver cells in old animals, similar to what was previously reported for young GH-transgenic mice (Miquet et al., 2013, Martinez et al., 2016).
GH action at the cellular level begins with its binding to its membrane receptor, GHR, which in turns activates several signaling mediators. Among these, the JAK2/STAT5 signaling pathways is considered the most important as it induces IGF-1 synthesis, which is the main mediator of GH action in different tissues. In normal situations, IGF-1 produced in the liver acts predominantly in other tissues since hepatocytes do not significantly express its receptor, IGF-1R. On the contrary, on chronic liver disease, elevated production of IGF-1R has been described, from the beginning of preneoplastic changes up to the established HCC stage (Wu et al., 2011, Pivonello et al., 2014, Adamek et al., 2018). Consequently, the expression of both receptors, GHR and IGF-1R, was analyzed by qPCR in the liver of old GH-transgenic mice (Fig. 2). GHR mRNA was shown to be higher in both male and female GH-transgenic mice in comparison to normal animals (Fig. 2A), in line with previous reports using younger animals where higher GHR mRNA and protein levels were detected in GH-transgenic mice (Martinez et al., 2015) and in accordance with the well-known up-regulation of hepatic GHR expression by continuous exposure to GH (Maiter et al., 1988, Iida et al., 2004, González et al., 2007). When tumoral and non-tumoral liver tissue was compared, lower levels were observed in tumors, only in females (Fig. 2B). A similar pattern was obtained when IGF-1R mRNA was determined (Fig. 2C, 2D).
Figure 2. GHR and IGF-1R expression in the liver of female and male old GH-transgenic mice.
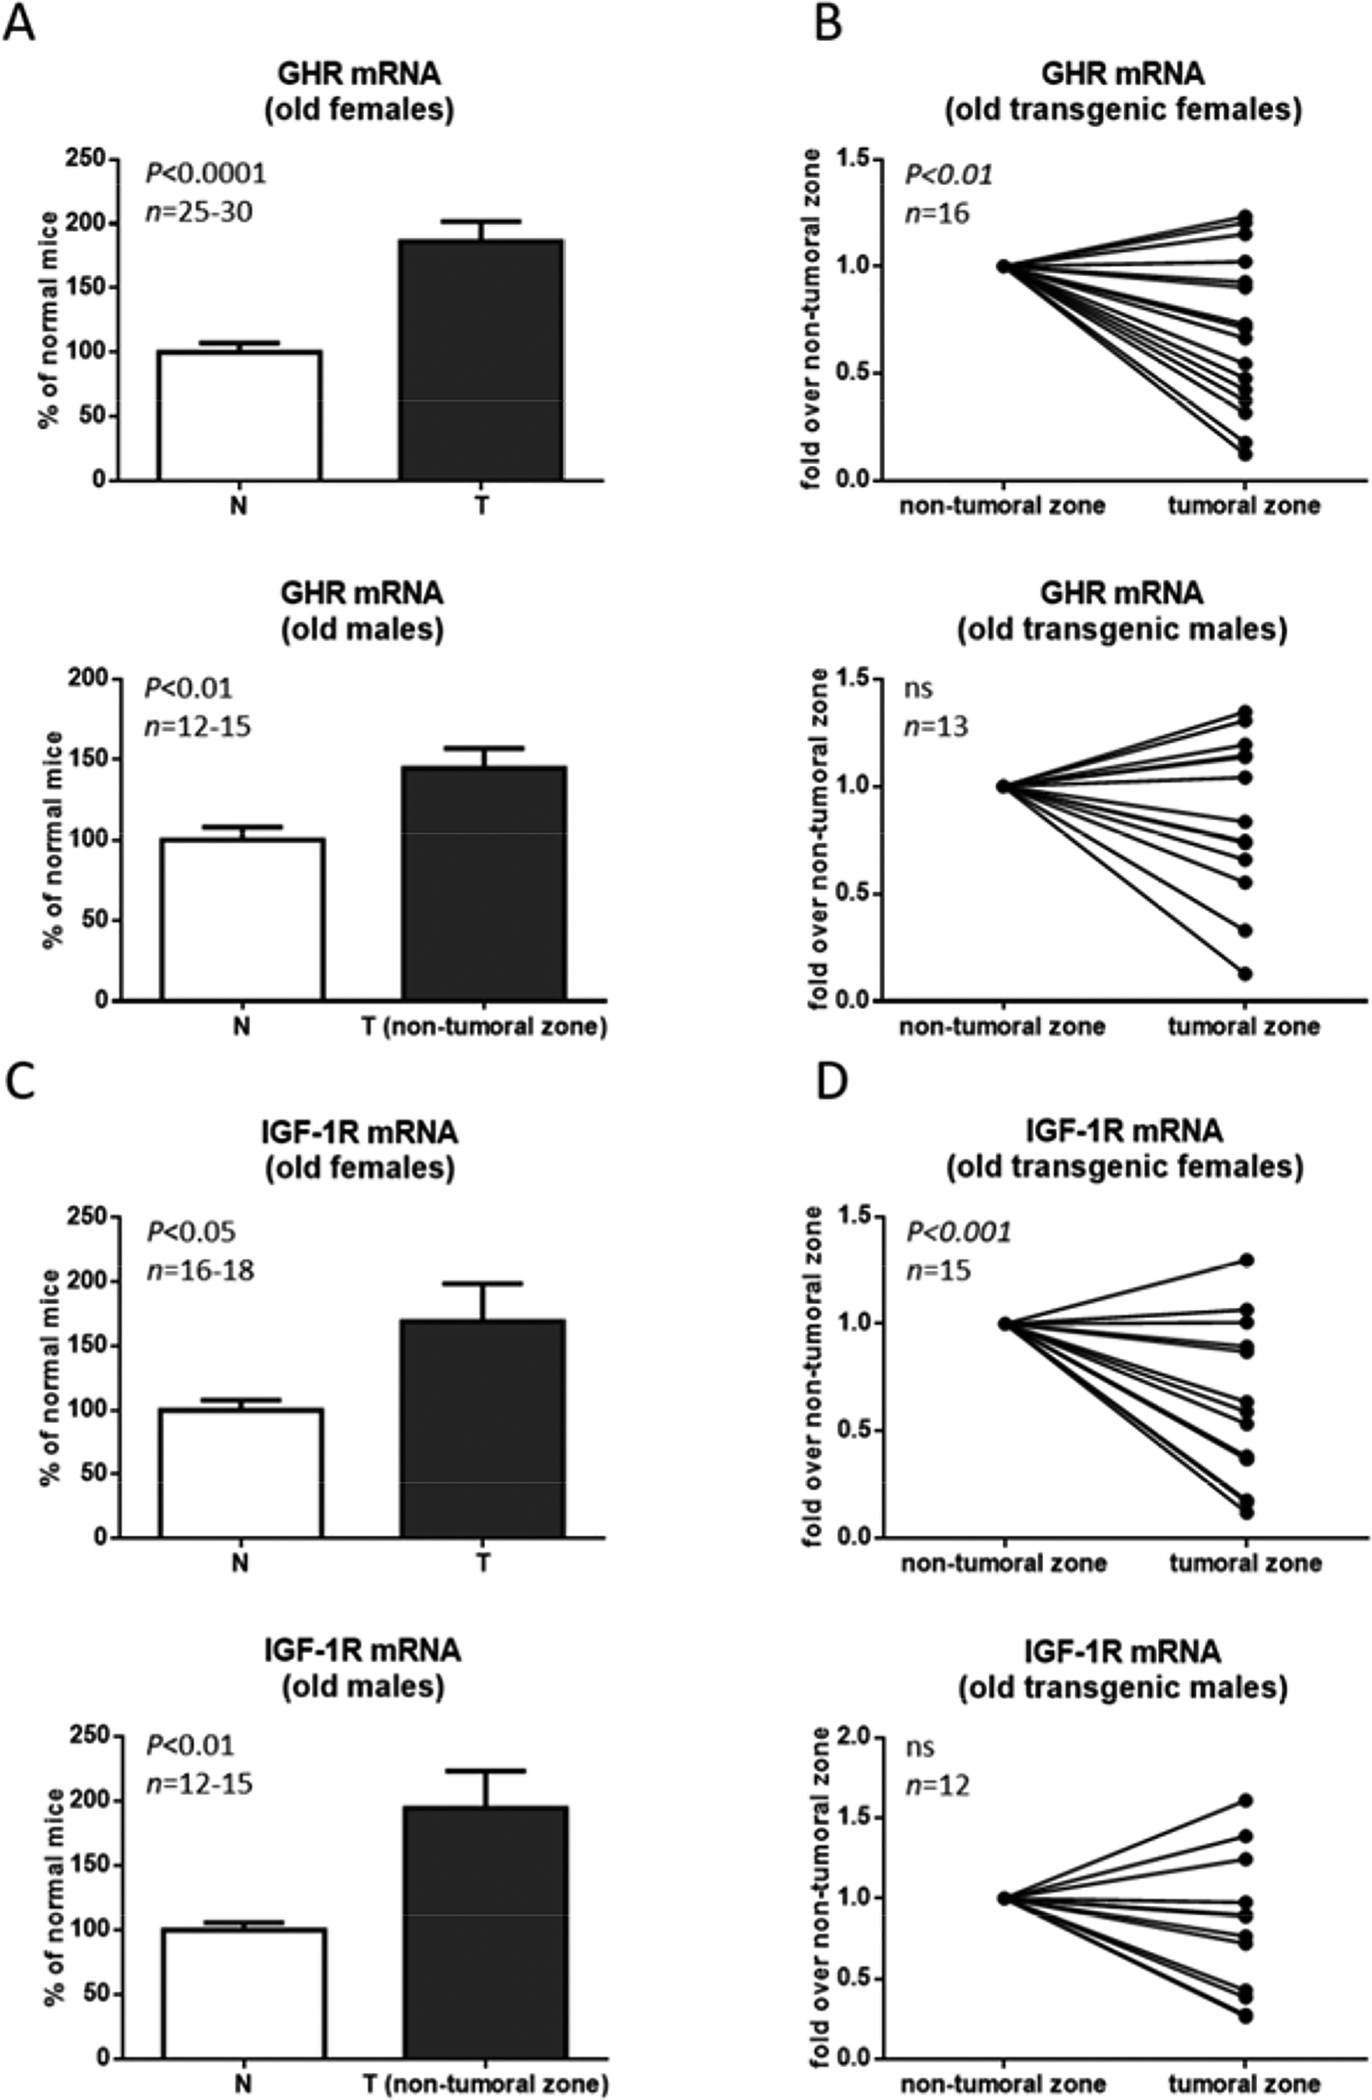
Liver extracts from female (F) and male (M), normal (N) and GH-transgenic (T) old mice were evaluated for GHR and IGF-1R expression by the determination of mRNA levels relative to Cyclophilin A by RT-qPCR analysis. Results obtained in non-tumoral tissue from normal and GH-transgenic, female and male mice are displayed in (A) and (C) and the comparison between tumoral and non-tumoral tissue from GH-transgenic males and females is shown in (B) and (D). Data are the mean ± SEM of the indicated number of samples per group (n), each one representing a different animal. Unpaired Student’s t-test was used to assess differences between normal and GH-transgenic mice, and paired Student’s t-test was used to assess differences between tumoral and non-tumoral tissue. ns stands for non-significant.
The expression of GHR and IGF-1R was also evaluated by immunohistochemical assays (Supplementary Fig. 3) in the liver of old mice, demonstrating that both receptors were expressed in hepatocytes.
3.4. Cytosolic phospholipase A2 alpha (cPLA2α) expression
Alterations in the metabolism of membrane phospholipids and lipidic mediators have been associated with tumorigenesis (Wang et al., 2010). Higher activity of the 85-kDa cPLA2α enzyme has been observed in many tumors, including HCC (Niknami et al., 2009, Dennis et al., 2011, Yarla et al., 2016, Kim et al., 2018). Consequently, its expression in young and old normal and GH-transgenic mice was evaluated.
In young animals, higher cPLA2α protein and mRNA levels were observed in male and female GH-transgenic mice in comparison to normal mice (Fig. 3A, 3B). Phosphorylated cPLA2α at Ser505, the activated form of this enzyme, exhibited a similar profile (Fig. 3C). When animals of advanced age were analyzed, elevated cPLA2α protein and mRNA abundance was also observed in mice overexpressing GH in comparison to controls (Fig. 4A, 4B and 4D). For transgenic mice bearing liver tumors, relative expression of cPLA2α in the tumoral zone was compared to its expression in the non-tumoral zone of the same liver and no differences in cPLA2α protein and mRNA levels were found (Fig. 4A, 4C and 4E). Similar results were obtained for males and females. Protein loading control was performed by Coomassie blue staining (CBS) of PVDF membranes. Data are the mean ± SEM of the indicated number of samples per group (n), each one representing a different animal. Different letters denote significant differences between normal and GH-transgenic, male and female mice, assessed by two-way ANOVA (P<0.05).
Figure 3. cPLA2α expression and phosphorylation in the liver of female and male young GH-transgenic mice.
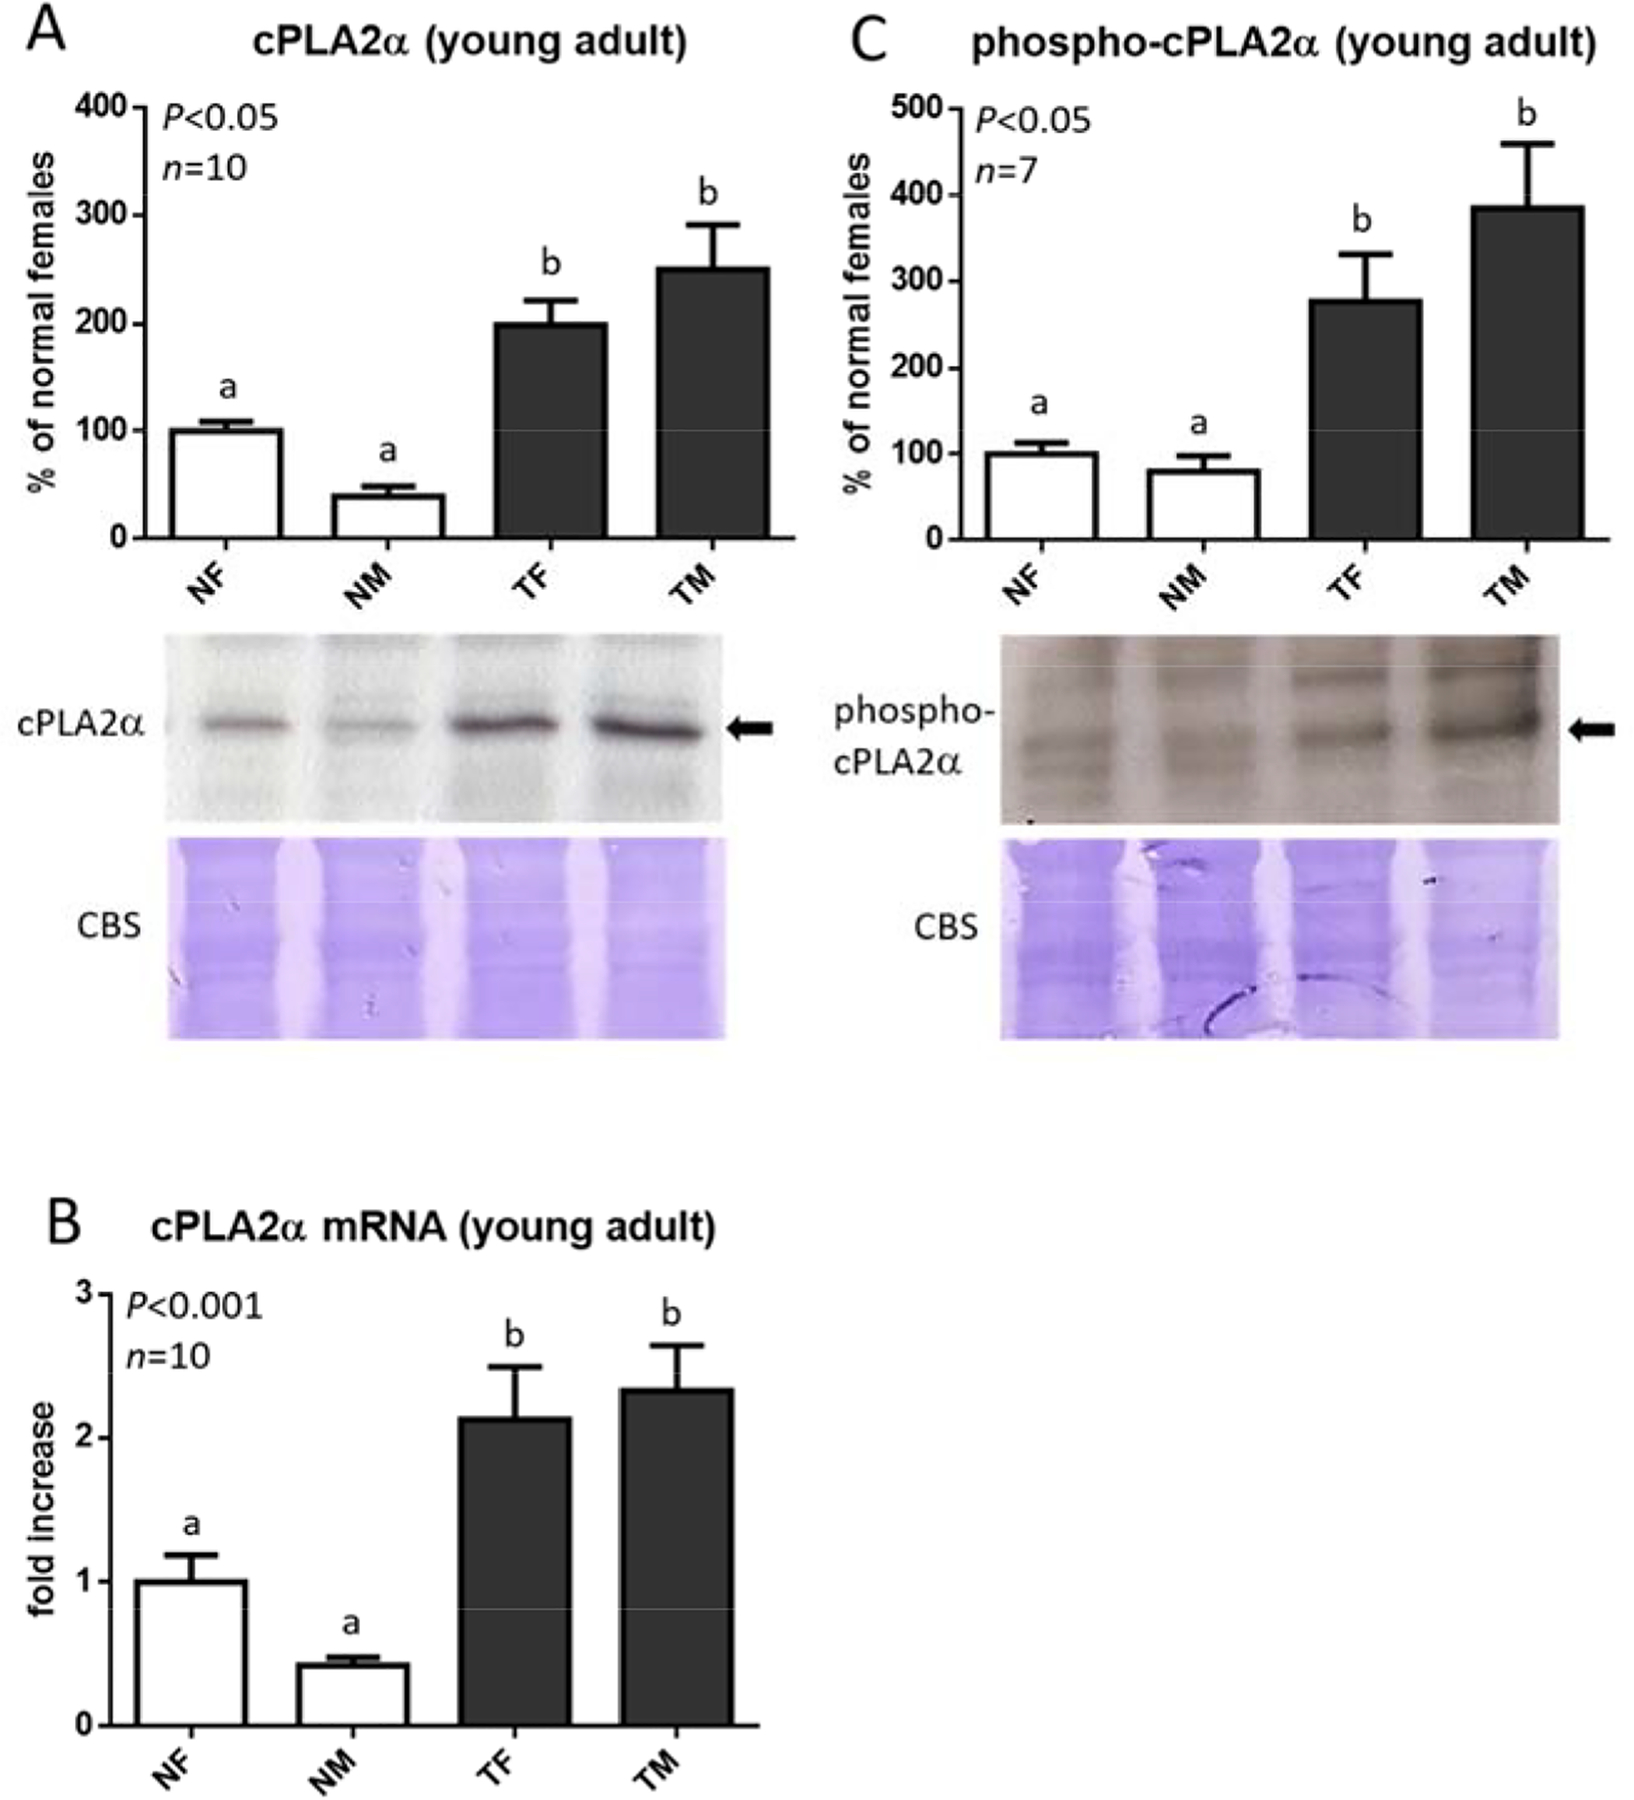
Liver extracts from female (F) and male (M), normal (N) and GH-transgenic (T) young mice were evaluated for cPLA2α protein expression by immunoblotting and densitometric analysis (A). Liver cPLA2α expression was also evaluated by the determination of mRNA levels relative to Cyclophilin A by RT-qPCR analysis (B). The activated form of this enzyme was assessed by immunoblotting using anti phospho-PLA2α Ser505 antibody (C). Representative immunoblots are shown.
Figure 4. cPLA2α expression in the liver of old female and male GH-transgenic mice.

Liver extracts from female (F) and male (M) normal (N) and GH-transgenic (T) old mice were evaluated for cPLA2α protein expression by immunoblotting and densitometric analysis, and for mRNA levels relative to Cyclophilin A by RT-qPCR analysis. Representative immunoblots are shown (A). Results obtained in non-tumoral tissue from normal and GH-transgenic, female and male mice are displayed in (B) and (D) and the comparison between tumoral and non-tumoral tissue from GH-transgenic males and females is shown in (C) and (E). Protein loading control was performed by Coomassie blue staining (CBS) of PVDF membranes. Data are the mean ± SEM of the indicated number of samples per group (n), each one representing a different animal. Unpaired Student’s t-test was used to assess differences between normal and GH-transgenic mice, and paired Student’s t-test was used to assess differences between tumoral and non-tumoral tissue. ns stands for non-significant.
3.5. COX1 and COX2 expression
Cyclooxygenases 1 and 2 enzymes are involved in the synthesis of molecules that could act as mediators of inflammation, survival and proliferation. Higher expression of these enzymes was suggested to be involved in carcinogenic processes (Chi-Man Tang et al., 2005, Cervello et al., 2006, Wu, 2006, Breinig et al., 2007, Wang et al., 2010, Kim et al., 2018). Therefore, the potential role of COX1 and COX2 in liver tumorigenesis in GH-transgenic mice was analyzed.
Elevated COX1 and COX2 protein content was observed in young male and female GH-transgenic mice in comparison to corresponding control (Fig. 5A and 5C). To further confirm these results and assess for cellular distribution of COX enzymes, immunohistochemistry assays were performed. Representative microphotographs are shown in Fig. 5B, 5D. COX1 and COX2 staining was stronger in liver sections obtained from GH-transgenic males and females, particularly at the cytoplasm of hepatocytes. Negative controls demonstrated reaction specificity (Supplementary Fig. 2B, 2C).
Figure 5. COX1 and COX2 expression in the liver of young GH-transgenic mice.

Liver extracts from female (F) and male (M), normal (N) and GH-transgenic (T) mice were evaluated for COX1 and COX2 protein expression by immunoblotting and densitometric analysis (A, C). Protein loading control was performed by Coomassie blue staining (CBS) of PVDF membranes. A composite image of lanes taken from the same gel is shown in (A). Data are the mean ± SEM of the indicated number of samples per group (n), each one representing a different animal. Different letters denote significant differences between normal and GH-transgenic, female and male mice, assessed by two-way ANOVA (P<0.05). Liver COX1 and COX2 expression was also evaluated by immunostaining of liver sections and representative photomicrographs are shown (original magnification 400X) (B, D).
COX1 and COX2 expression was also assessed in the liver of old mice (Fig. 6). Similar to what was observed in young animals, expression of both enzymes was higher in the liver of GH-transgenic mice in comparison to controls (Fig. 6A, 6B, 6D and 6E). COX1 and COX2 levels were also compared between non-tumoral and tumoral tissue from GH-transgenic mice (Fig. 6C and 6F). No significant differences were observed in COX1 abundance. On the contrary, higher levels of COX2 expression were evidenced in the tumoral tissue, both in males and females.
Figure 6. COX1 and COX2 expression in the liver of old GH-transgenic mice.

Liver extracts from female (F) and male (M), normal (N) and GH-transgenic (T) mice were evaluated for COX1 and COX2 protein expression by immunoblotting and densitometric analysis. Representative immunoblots are shown (A, D). Results obtained in non-tumoral tissue from normal and GH-transgenic males and females are displayed in (B) and (E) and the comparison between tumoral and non-tumoral tissue from transgenic males and females is shown in (C) and (F). Protein loading control was performed by Coomassie blue staining (CBS) of PVDF membranes. Data are the mean ± SEM of the indicated number of samples per group (n), each one representing a different animal. Unpaired Student’s t-test was used to assess differences between normal and GH-transgenic mice, and paired Student’s t-test was used to assess differences between tumoral and non-tumoral tissue. ns stands for non-significant.
COX1 and COX2 expression was also analyzed by immunohistochemistry in liver sections of old female mice. COX1 and COX2 staining was higher in GH-transgenic mice in comparison to controls and was mainly observed in the cytoplasm of hepatocytes (Fig. 7A, 7B). A similar pattern was detected between tumoral and non-tumoral tissue derived from GH-transgenic mice.
Figure 7. COX1 and COX2 immunostaining in the liver of old female GH-transgenic mice.

The expression of these enzymes was analyzed in liver sections from old female GH-overexpressing transgenic mice (T) and normal controls (N). From GH-transgenic mice, microphotographs from both non-tumoral and tumoral tissue are shown (original magnification 400X).
3.6. COX1 and COX2 expression in mice after a limited exposure to continuous GH levels
The increment in COX1 and COX2 expression observed in this line of GH-transgenic mice could be directly associated with continuously elevated GH levels, but it also could be consequence of the preneoplastic pathology these animals develop since young ages (Martinez et al., 2015, Martinez et al., 2016). In order to elucidate this, osmotic minipumps delivering GH at a dose of 1 mg /kg body weight per day were implanted in the subcutaneous space of Swiss-Webster mice. Livers were obtained after five days of treatment and COX1 and COX2 levels were analyzed by immunoblotting. In females, GH administration did not induce changes in COX1 or COX2 expression in comparison to controls (Fig. 8A, 8B, 8D and 8E). In contrast, GH-treated male mice exhibited higher levels of COX1 than control animals, but a similar expression of COX2 was observed between treated and non-treated male mice (Fig. 8A, 8C, 8D and 8F).
Figure 8. COX1 and COX2 expression in the liver of GH-treated Swiss-Webster mice.

Liver extracts of female and male mice treated for 5 days with GH (1mg/kg of body weight per day) by continuous infusion with an osmotic minipump (GH) or their respective controls were evaluated for COX1 (B, C) and COX2 (E, F) protein expression by immunoblotting and analyzed by densitometry. Representative immunoblots are shown (A, D). Protein loading control was performed by Coomassie blue staining (CBS) of PVDF membranes. A composite image of lanes taken from the same gel is shown for males in (A). Data are the mean ± SEM of the indicated number of samples per group (n), each one representing a different animal. Unpaired Student’s t-test was used to assess differences between control and GH-treated mice. ns stands for non-significant.
4. Discussion
GH is currently administered to children with retarded growth, related or not to GH deficiency. In adults, it is also prescribed due to its beneficial effects over metabolism and neuronal and reproductive function. GH abuse has also been reported since it modifies body composition, increasing muscle mass and decreasing fat depots (Kemp et al., 2011, Laron, 2011). In humans, there are no conclusive studies that directly link GH treatment with tumor development. In fact, GH replacement therapy in GH deficient adult and children is regarded as safe when no other risk factors for malignancy are present (Pekic et al., 2017, Boguszewski et al., 2019). In acromegalic patients, prolonged GH excess appears to marginally increase cancer incidence (Boguszewski et al., 2019).
Evidence in animals suggests that exposure to GH could provide a protumorigenic environment, favoring survival of genetically damaged cells (Chhabra et al., 2011, Perry et al., 2013, Pekic et al., 2017, Boguszewski et al., 2019). Mice continuously exposed to elevated GH levels display hepatomegaly since young ages and frequently develop liver tumors, including HCC, by the first year of life (Orian et al., 1990, Snibson et al., 1999, Martinez et al., 2016). This progression is accompanied by dysregulation of GH signaling pathways, including those related to oncogenic processes, which starts prior to the appearance of liver damage (Miquet et al., 2008, Miquet et al., 2013, Martinez et al., 2016).
In a previous work in young GH-transgenic mice, we described that hepatomegaly was associated with hepatocytes of greater size with larger nuclei and a higher proliferation rate, but no macroscopic alterations were observed (Miquet et al., 2013). In the current work, we expanded our analysis to older GH-overexpressing mice. These animals displayed similar alterations in hepatocyte size and its proliferative state, but histological architecture was now distorted and liver macroscopic lesions were evident, with tumors found in most of the transgenic animals under study. Although hepatocarcinogenesis in GH-transgenic mice was described as directly associated to GH action in the liver, as mice overexpressing IGF-1 do not exhibit hepatic tumors (Quaife et al., 1989, Bartke, 2003, Kopchick et al., 2014), IGF-1 signaling could also be involved in this process since mRNA expression of its receptor, IGF-1R, and GH receptor, GHR, are augmented in the liver of these mice.
Liver tumoral tissue displayed hepatocytes of lower size, which, in females, exhibited smaller nuclei and a lower proliferation rate. These alterations observed in tumors from GH-transgenic females were accompanied by a lower expression of GHR and IGF-1R mRNA. In males, hepatocytes from tumors were also smaller, but exhibited no differences in nuclei size, proliferative state and GHR and IGF-1R mRNA expression in comparison to non-tumoral tissue.
These results suggest a direct association between hepatocyte growth and proliferation and GHR and IGF-1R expression in mice continuously exposed to elevated levels of GH since birth, which are in line with the previously described role of these receptors in hepatocytes growth, proliferation and differentiation (Chhabra et al., 2011, Pivonello et al., 2014).
This process, associated with elevated levels of GH, is accompanied by an increment in circulating ALT levels in young animals before the development of liver tumors, which then exacerbates with age. Serum ALT activity has been regarded as a reliable and sensitive marker of liver disease: upon hepatocellular injury or death, it is released from damaged liver cells, increasing its serum activity (Kim et al., 2008). Our results showing higher ALT levels in old GH-transgenic males than in females are in line with the notion that levels of this enzyme differ with gender, with higher values in men than in women (Kim et al., 2008).
HCC usually develops in the presence of continuous inflammation and hepatocyte regeneration, with mediators of inflammation such as PGs being important actors in hepatocarcinogenesis (Wu, 2006, Wang et al., 2010, Zang et al., 2017). High levels of AA, a precursor of PGs synthesis, have been described in the phosphatidyl choline phospholipid pool of hepatic membranes of another GH-transgenic mouse line (Murray et al., 1994, Oberbauer et al., 2011). Consequently, we analyzed the expression of enzymes involved in AA metabolism in our GH-transgenic mice to assess its potential role in the liver pathology these animals develop.
Mice overexpressing GH exhibited an increment in the hepatic expression of cPLA2α in comparison to control animals. This effect was observed in young and old, male and female mice; however, no significant differences were found between tumors and the adjacent tissue. Dysregulation of cPLA2α was reported in transformed cells and it is believed to play an important role in the pathogenesis of many human cancers (Nakanishi et al., 2006, Niknami et al., 2009, Dennis et al., 2011, Kim et al., 2018). In fact, the use of PLA2s inhibitors for various inflammatory and oncologic diseases is under clinical trials (Yarla et al., 2016).
Male and female GH-transgenic mice also displayed higher hepatic levels of COX1 and COX2 than normal animals, both during young adulthood and at advanced ages. When the expression of these enzymes was evaluated in tumoral and non-tumoral tissue, elevated levels of COX2 were observed in tumors. On the contrary, our findings show that COX1 expression was similar in the tumors and the surrounding tissue.
While COX2 expression is undetectable in most normal tissues, it is rapidly induced by mitogenic and inflammatory stimuli (Cervello et al., 2006, Breinig et al., 2007, Wang et al., 2010, Kim et al., 2018). In the adult liver, the rapid expression of COX2 upon proinflammatory stimuli is almost restricted to the non-hepatocyte cell population, but hepatocytes express this isoenzyme under chronic pro-inflammatory conditions and during liver regeneration after partial hepatectomy (Martín-Sanz et al., 2010). It is well-established that COX2 is overexpressed in a multitude of premalignant, malignant and metastatic cancers, including hepatocellular carcinoma (HCC) (Chi-Man Tang et al., 2005, Cervello et al., 2006, Wu, 2006, Breinig et al., 2007). A role for COX1 in oncogenesis has also been postulated, since this enzyme is up-regulated in some human cancers, including HCC. Both COX1 and COX2 expression was reported to be higher in well-differentiated HCC than in the poorly-differentiated tissues, suggesting that these enzymes may be involved in the early stages of hepatocarcinogenesis (Chi-Man Tang et al., 2005, Cervello et al., 2006, Wu, 2006, Breinig et al., 2007). As a consequence of COX overexpression, prostaglandin levels increase, which may affect many mechanisms involved in oncogenesis, including stimulation of cell growth, inhibition of apoptosis, angiogenesis, invasiveness and metastatic potential of tumor cells (Cervello et al., 2006, Wu, 2006, Wang et al., 2010, Kim et al., 2018).
GH-transgenic mice exhibit signs of morphological alterations since early ages, product of the exposure to GH since birth. It should be noticed that these changes may be induced by the pathological context generated by elevated circulating levels of this hormone, rather than being a direct consequence of GH action in the liver. Therefore, the expression of COX enzymes was evaluated in mice exposed to continuously elevated levels of GH but for a limited period and at lower concentrations.
Opposite to what was observed in GH-transgenic mice, which displayed up-regulation of COX1 and COX2 in both sexes, exposure to lower levels of hormone for a short period seems to only affect COX1 levels in males. Considering the physiological profile of GH concentration in blood, which is markedly pulsatile in males, a more pronounced effect of GH continuous treatment could be expected in this sex, in line with what was observed for the expression of other proteins (Díaz et al., 2014, Bacigalupo et al., 2019). In females, where GH release is also pulsatile but with more frequent peaks and thus is commonly considered as “continuous”, sustained exposure to GH is less effective. In GH-transgenic mice the extremely high levels of GH since birth often produce similar changes in both sexes (Miquet et al., 2013, Bacigalupo et al., 2019). In order to fully elucidate the effects of continuous GH administration on the expression of COX enzymes, further investigation involving different GH doses and treatment periods should be performed.
Although the precise mechanisms underlying GH-induced cPLA2 and COX enzymes expression are yet to be elucidated, considering the role of inflammation in liver tumorigenesis, our findings suggest that alterations in AA metabolism could be involved in GH-driven tumorigenesis.
Supplementary Material
GH-transgenic mice frequently develop chronic liver inflammation and then HCC.
Altered metabolism of AA have been associated with pathogenesis of HCC.
GH-transgenic mice exhibited higher liver expression of cPLA2α and COX enzymes.
Elevated expression of COX2 was observed in liver tumors.
Limited exposure to GH is associated to higher COX1 levels only in males.
Acknowledgements
We thank Samuel A McFadden (Southern Illinois University School of Medicine) for his laboratory assistance.
Funding
This work was supported by the Universidad de Buenos Aires (grant numbers 20020120200122BA to JGM, 20020170100551BA to AIS); the Agencia Nacional de Promoción Científica y Tecnológica (grant number PICT-2015-1100 to JGM) and the National Institute on Aging of the National Institutes of Health (grant number R01AG019899 to AB).
Abbreviations
- AA
arachidonic acid
- ALT
alanine transaminase
- COX1
cyclooxygenase 1
- COX2
cyclooxygenase 2
- cPLA2α
cytosolic phospholipase A2α
- GH
growth hormone
- GHR
growth hormone receptor
- HCC
hepatocellular carcinoma
- IGF-1
insulin-like growth factor-1
- IGF-1R
insulin-like growth factor-1 receptor
- Mt
Metallothionein
- PCNA
proliferating cell nuclear antigen
- Pepck
phosphoenolpyruvate carboxykinase
- PGE2
prostaglandin E2
- PGs
Prostaglandins
Footnotes
Publisher's Disclaimer: This is a PDF file of an unedited manuscript that has been accepted for publication. As a service to our customers we are providing this early version of the manuscript. The manuscript will undergo copyediting, typesetting, and review of the resulting proof before it is published in its final form. Please note that during the production process errors may be discovered which could affect the content, and all legal disclaimers that apply to the journal pertain.
Declaration of interest
All the authors declare no conflict of interest.
References
- Adamek A & Kasprzak A 2018. Insulin-Like Growth Factor (IGF) System in Liver Diseases. International journal of molecular sciences 19 1308. [DOI] [PMC free article] [PubMed] [Google Scholar]
- Bacigalupo ML, Piazza VG, Cicconi NS, Carabias P, Bartke A, Fang Y, Sotelo AI, Rabinovich GA, Troncoso MF & Miquet JG 2019. Growth hormone upregulates the pro-tumorigenic galectin 1 in mouse liver. Endocrine connections 8 1108–1117. [DOI] [PMC free article] [PubMed] [Google Scholar]
- Bartke A 2003. Can Growth Hormone (GH) Accelerate Aging? Evidence from GH-Transgenic Mice. Neuroendocrinology 78 210–216. [DOI] [PubMed] [Google Scholar]
- Boguszewski CL & Boguszewski MCDS 2019. Growth Hormone’s Links to Cancer. Endocrine Reviews 40 558–574. [DOI] [PubMed] [Google Scholar]
- Breinig M, Schirmacher P & Kern MA 2007. Cyclooxygenase-2 (COX-2) - A Therapeutic Target in Liver Cancer? Current Pharmaceutical Design 13 3305–3315. [DOI] [PubMed] [Google Scholar]
- Bugni JM, Poole TM & Drinkwater NR 2001. The little mutation suppresses DEN-induced hepatocarcinogenesis in mice and abrogates genetic and hormonal modulation of susceptibility. Carcinogenesis 22 1853–1862. [DOI] [PubMed] [Google Scholar]
- Cervello M & Montalto G 2006. Cyclooxygenases in hepatocellular carcinoma. World journal of gastroenterology 12 5113–5121. [DOI] [PMC free article] [PubMed] [Google Scholar]
- Chhabra Y, Waters M & Brooks A 2011. Role of the growth hormone-IGF-1 axis in cancer. Expert Review of Endocrinology & Metabolism 6 71–84. [DOI] [PubMed] [Google Scholar]
- Chia DJ 2014. Minireview: mechanisms of growth hormone-mediated gene regulation. Molecular Endocrinology 28 1012–1025. [DOI] [PMC free article] [PubMed] [Google Scholar]
- Chi-Man Tang T, Tung-Ping Poon R & Fan ST 2005. The significance of cyclooxygenase-2 expression in human hepatocellular carcinoma. Biomedicine & Pharmacotherapy 59 S311–S316. [DOI] [PubMed] [Google Scholar]
- Dennis EA, Cao J, Hsu Y-H, Magrioti V & Kokotos G 2011. Phospholipase A2 enzymes: physical structure, biological function, disease implication, chemical inhibition, and therapeutic intervention. Chemical reviews 111 6130–6185. [DOI] [PMC free article] [PubMed] [Google Scholar]
- Díaz ME, Miquet JG, Rossi SP, Irene PE, Sotelo AI, Frungieri MB, Turyn D & González L 2014. GH administration patterns differently regulate epidermal growth factor signaling. The Journal of Endocrinology 221 309. [DOI] [PubMed] [Google Scholar]
- González L, Curto LM, Miquet JG, Bartke A, Turyn D & Sotelo AI 2007. Differential regulation of membrane associated-growth hormone binding protein (MA-GHBP) and growth hormone receptor (GHR) expression by growth hormone (GH) in mouse liver. Growth Hormone & IGF Research 17 104–112. [DOI] [PubMed] [Google Scholar]
- Guevara-Aguirre J, Guevara A, Palacios I, Pérez M, Prócel P & Terán E 2018. GH and GHR signaling in human disease. Growth Hormone & IGF Research 38 34–38. [DOI] [PubMed] [Google Scholar]
- Iida K, Del Rincon JP, Kim D-S, Itoh E, Coschigano KT, Kopchick JJ & Thorner MO 2004. Regulation of full-length and truncated growth hormone (GH) receptor by GH in tissues of lit/lit or bovine GH transgenic mice. American Journal of Physiology-Endocrinology and Metabolism 287 E566–E573. [DOI] [PubMed] [Google Scholar]
- Jenkins PJ, Mukherjee A & Shalet SM 2006. Does growth hormone cause cancer? Clinical Endocrinology 64 115–121. [DOI] [PubMed] [Google Scholar]
- Kemp SF & Frindik JP 2011. Emerging options in growth hormone therapy: an update. Drug design, development and therapy 5 411–419. [DOI] [PMC free article] [PubMed] [Google Scholar]
- Kim W, Son B, Lee S, Do H & Youn B 2018. Targeting the enzymes involved in arachidonic acid metabolism to improve radiotherapy. Cancer and Metastasis Reviews 37 213–225. [DOI] [PubMed] [Google Scholar]
- Kim WR, Flamm SL, Di Bisceglie AM & Bodenheimer HC 2008. Serum activity of alanine aminotransferase (ALT) as an indicator of health and disease. Hepatology 47 1363–1370. [DOI] [PubMed] [Google Scholar]
- Kong X, Wu W, Yuan Y, Pandey V, Wu Z, Lu X, Zhang W, Chen Y, Wu M, Zhang M, et al. 2016. Human growth hormone and human prolactin function as autocrine/paracrine promoters of progression of hepatocellular carcinoma. Oncotarget 7 29465–29479. [DOI] [PMC free article] [PubMed] [Google Scholar]
- Kopchick JJ, List EO, Kelder B, Gosney ES & Berryman DE 2014. Evaluation of growth hormone (GH) action in mice: discovery of GH receptor antagonists and clinical indications. Molecular and Cellular Endocrinology 386 34–45. [DOI] [PMC free article] [PubMed] [Google Scholar]
- Laron Z 2011. Growth hormone therapy: emerging dilemmas. Pediatric Endocrinology Reviews 8 10. [PubMed] [Google Scholar]
- Llovet JM, Zucman-Rossi J, Pikarsky E, Sangro B, Schwartz M, Sherman M & Gores G 2016. Hepatocellular carcinoma. Nature Reviews Disease Primers 2 16018. [DOI] [PubMed] [Google Scholar]
- Maiter D, Underwood LE, Maes M, Davenport ML & Ketelslegers JM 1988. Different Effects of Intermittent and Continuous Growth Hormone (GH) Administration on Serum Somatomedin-C/Insulin-Like Growth Factor I and Liver GH Receptors in Hypophysectomized Rats*. Endocrinology 123 1053–1059. [DOI] [PubMed] [Google Scholar]
- Martinez CS, Piazza VG, Díaz ME, Boparai RK, Arum O, Ramírez MC, González L, Becú-Villalobos D, Bartke A, Turyn D, et al. 2015. GH/STAT5 signaling during the growth period in livers of mice overexpressing GH. Journal of Molecular Endocrinology 54 171–184. [DOI] [PMC free article] [PubMed] [Google Scholar]
- Martinez CS, Piazza VG, González L, Fang Y, Bartke A, Turyn D, Miquet JG & Sotelo AI 2016. Mitogenic signaling pathways in the liver of growth hormone (GH)-overexpressing mice during the growth period. Cell cycle 15 748–759. [DOI] [PMC free article] [PubMed] [Google Scholar]
- Martín-Sanz P, Mayoral R, Casado M & Boscá L 2010. COX-2 in liver, from regeneration to hepatocarcinogenesis: what we have learned from animal models? World journal of gastroenterology 16 1430–1435. [DOI] [PMC free article] [PubMed] [Google Scholar]
- Mcgrane MM, De Vente J, Yun J, Bloom J, Park E, Wynshaw-Boris A, Wagner T, Rottman FM & Hanson RW 1988. Tissue-specific expression and dietary regulation of a chimeric phosphoenolpyruvate carboxykinase/bovine growth hormone gene in transgenic mice. Journal of Biological Chemistry 263 11443–11451. [PubMed] [Google Scholar]
- Miquet JG, Freund T, Martinez CS, González L, Díaz ME, Micucci GP, Zotta E, Boparai RK, Bartke A, Turyn D, et al. 2013. Hepatocellular alterations and dysregulation of oncogenic pathways in the liver of transgenic mice overexpressing growth hormone. Cell Cycle 12 1042–1057. [DOI] [PMC free article] [PubMed] [Google Scholar]
- Miquet JG, González L, Matos MN, Hansen CE, Louis A, Bartke A, Turyn D & Sotelo AI 2008. Transgenic mice overexpressing GH exhibit hepatic upregulation of GH-signaling mediators involved in cell proliferation. The Journal of Endocrinology 198 317. [DOI] [PubMed] [Google Scholar]
- Murray JD, Oberbauer AM, Sharp KR & German JB 1994. Expression of an ovine growth hormone transgene in mice increases arachidonic acid in cellular membranes. Transgenic Research 3 8. [DOI] [PubMed] [Google Scholar]
- Nakanishi M & Rosenberg DW 2006. Roles of cPLA2alpha and arachidonic acid in cancer. Biochimica et biophysica acta 1761 1335–1343. [DOI] [PMC free article] [PubMed] [Google Scholar]
- Niknami M, Patel M, Witting PK & Dong Q 2009. Molecules in focus: Cytosolic phospholipase A2-α. The International Journal of Biochemistry & Cell Biology 41 994–997. [DOI] [PubMed] [Google Scholar]
- Oberbauer AM, German JB & Murray JD 2011. Growth hormone enhances arachidonic acid metabolites in a growth hormone transgenic mouse. Lipids 46 495–504. [DOI] [PMC free article] [PubMed] [Google Scholar]
- Orian JM, Tamakoshi K, Mackay IR & Brandon MR 1990. New murine model for hepatocellular carcinoma: transgenic mice expressing metallothioneinovine growth hormone fusion gene. Journal of the National Cancer Institute 82 393–398. [DOI] [PubMed] [Google Scholar]
- Pekic S, Stojanovic M & Popovic V 2017. Controversies in the risk of neoplasia in GH deficiency. Best Practice & Research Clinical Endocrinology & Metabolism 31 35–47. [DOI] [PubMed] [Google Scholar]
- Perry JK, Liu D-X, Wu Z-S, Zhu T & Lobie PE 2013. Growth hormone and cancer: an update on progress. Current Opinion in Endocrinology, Diabetes and Obesity 20 307–313. [DOI] [PubMed] [Google Scholar]
- Pfaffl MW 2001. A new mathematical model for relative quantification in real-time RT-PCR. Nucleic acids research 29 e45–e45. [DOI] [PMC free article] [PubMed] [Google Scholar]
- Pivonello C, De Martino MC, Negri M, Cuomo G, Cariati F, Izzo F, Colao A & Pivonello R 2014. The GH-IGF-SST system in hepatocellular carcinoma: biological and molecular pathogenetic mechanisms and therapeutic targets. Infectious agents and cancer 9 27–27. [DOI] [PMC free article] [PubMed] [Google Scholar]
- Quaife CJ, Mathews LS, Pinkert CA, Hammer RE, Brinster RL & Palmiter RD 1989. Histopathology associated with elevated levels of growth hormone and insulin-like growth factor I in transgenic mice. Endocrinology 124 40–48. [DOI] [PubMed] [Google Scholar]
- Schlageter M, Terracciano LM, D’angelo S & Sorrentino P 2014. Histopathology of hepatocellular carcinoma. World journal of gastroenterology 20 15955–15964. [DOI] [PMC free article] [PubMed] [Google Scholar]
- Snibson KJ 2002. Hepatocellular kinetics and the expression of growth hormone (GH) in the livers and liver tumours of GH-transgenic mice. Tissue and Cell 34 88–97. [DOI] [PubMed] [Google Scholar]
- Snibson KJ, Bhathal PS, Hardy CL, Brandon MR & Adams TE 1999. High, persistent hepatocellular proliferation and apoptosis precede hepatocarcinogenesis in growth hormone transgenic mice. Liver 19 242–252. [DOI] [PubMed] [Google Scholar]
- Subbaramaiah K & Dannenberg AJ 2003. Cyclooxygenase 2: a molecular target for cancer prevention and treatment. Trends in Pharmacological Sciences 24 96–102. [DOI] [PubMed] [Google Scholar]
- Wang D & Dubois RN 2010. Eicosanoids and cancer. Nature reviews. Cancer 10 181–193. [DOI] [PMC free article] [PubMed] [Google Scholar]
- Welinder C & Ekblad L 2011. Coomassie staining as loading control in Western Blot analysis. Journal of Proteome Research 10 1416–1419. [DOI] [PubMed] [Google Scholar]
- Wu J & Zhu AX 2011. Targeting insulin-like growth factor axis in hepatocellular carcinoma. Journal of hematology & oncology 4 30–30. [DOI] [PMC free article] [PubMed] [Google Scholar]
- Wu T 2006. Cyclooxygenase-2 in hepatocellular carcinoma. Cancer Treatment Reviews 32 28–44. [DOI] [PubMed] [Google Scholar]
- Yarla NS, Bishayee A, Sethi G, Reddanna P, Kalle AM, Dhananjaya BL, Dowluru KSVGK, Chintala R & Duddukuri GR 2016. Targeting arachidonic acid pathway by natural products for cancer prevention and therapy. Seminars in Cancer Biology 40–41 48–81. [DOI] [PubMed] [Google Scholar]
- Zang S, Ma X, Wu Y, Liu W, Cheng H, Li J, Liu J & Huang A 2017. PGE2 synthesis and signaling in malignant transformation and progression of human hepatocellular carcinoma. Human Pathology 63 120–127. [DOI] [PubMed] [Google Scholar]
- Zhang Y, Guan R, Jiang J, Kopchick JJ, Black RA, Baumann G & Frank SJ 2001. Growth Hormone (GH)-induced Dimerization Inhibits Phorbol Ester-stimulated GH Receptor Proteolysis. Journal of Biological Chemistry 276 24565–24573. [DOI] [PubMed] [Google Scholar]
Associated Data
This section collects any data citations, data availability statements, or supplementary materials included in this article.