Abstract
Purpose:
To assess the frequency and impact of abnormal foveal avascular zone (FAZ) topography (i.e., a fragmented FAZ) on visual acuity and foveal anatomic features.
Design:
Prospective, cross-sectional study from March 2018 through July 2019.
Participants:
Two-hundred fifty participants were screened from a normative OCT angiography database. Of those, 12 participants were found to have at least 1 eye with a fragmented FAZ. Eight returned for follow-up imaging, along with an additional 3 participants with ocular disease (amblyopia, autosomal recessive bestrophinopathy, premature birth) having a similar FAZ phenotype.
Methods:
Follow-up OCT imaging and monocular best-corrected visual acuity (BCVA) were performed for these 11 participants. Twenty-four participants with a clearly defined FAZ were recruited for comparison. A normative database was created measuring parafoveal intercapillary area (PICA) to determine of an FAZ was fragmented.
Main Outcome Measures:
Monocular BCVA, foveal pit depth, foveal pit area, PICA, outer nuclear layer thickness, foveal inner retinal area, and peak cone density.
Results:
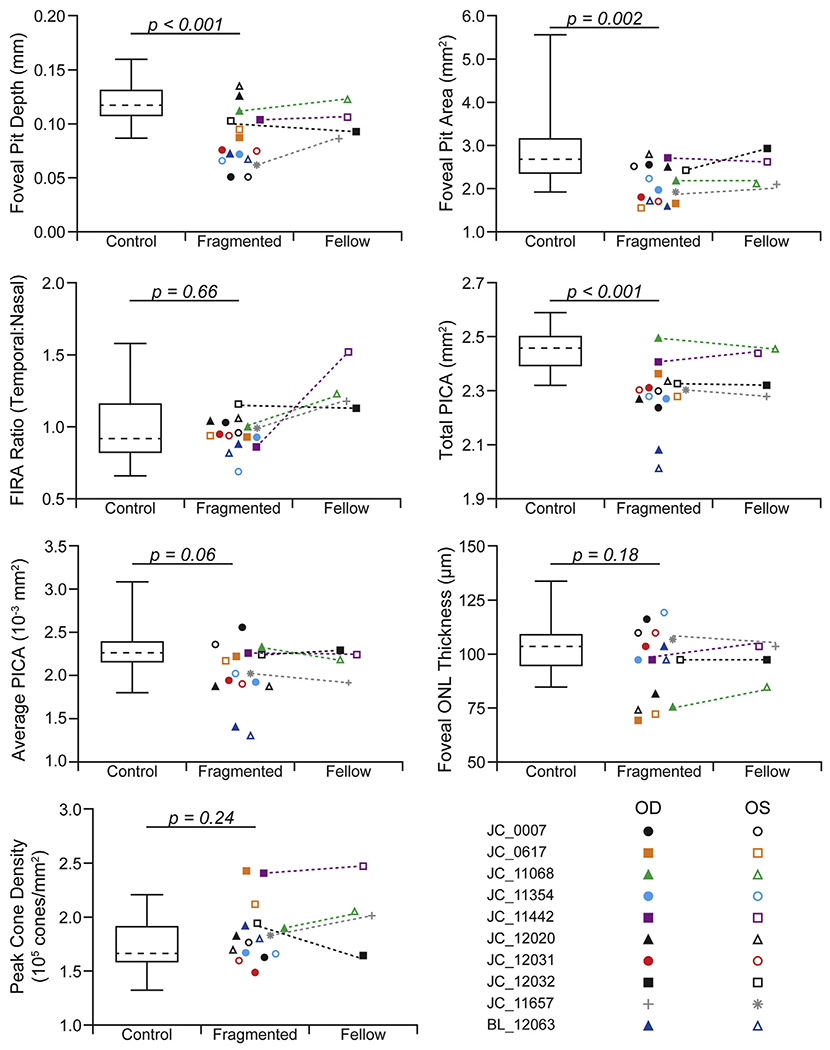
The frequency of a fragmented FAZ was 4.8% of individuals (12 of 250) or 3.6% of eyes (18 of 500 eyes). A significant difference was found between the control eyes and eyes with fragmented FAZs for foveal pit depth, pit area, and total PICA (P < 0.001, P = 0.002, and P < 0.001, respectively). The presence of a fragmented FAZ did not affect visual acuity.
Conclusions:
The presence of a fragmented FAZ seems not to be a rare phenotype in individuals with normal vision. The presence of altered FAZ topography in patients with retinal or systemic disease could impact negatively the accuracy and sensitivity of biomarkers dependent on FAZ identification.
A lack of inner retinal vasculature is a prominent feature associated with normal foveal specialization. This area, accordingly termed the foveal avascular zone (FAZ), is the first specialization of the fovea seen with histologic examination during early retinal development and is thought never to be vascularized.1 A FAZ is believed to be required for the subsequent excavation of the inner retinal layers (i.e., creation of a foveal pit).2 With the emergence of OCT angiography (OCTA), the structure of the FAZ routinely can be assessed noninvasively. The FAZ and surrounding microvasculature have been shown to be altered in a wide range of retinal and systemic diseases, including diabetic retinopathy,3 macular telangiectasia,4 Stickler syndrome,5 Parkinson’s disease,6 and Alzheimer’s disease.7 As such, measures associated with the FAZ are becoming attractive candidate biomarkers in a number of research studies and clinical trials.8
A number of important factors can impact the usefulness of these biomarkers. For example, individual differences in axial length alter the lateral scale of the OCTA image, and thus impact the accuracy of direct measures of FAZ size.9 This is important because axial length is known to differ between males and females,10 and emmetropization is known to be impaired in many pathologic conditions.11,12 In addition, the FAZ is known to be larger in black individuals compared with white individuals13,14; thus, using race-matched groups is critical, especially when using normative or reference databases. Although these issues affect measurements of FAZ size, Additional metrics rely on accurate delineation of the FAZ contour that also must be used with caution.15 For exathe method of FAZ segmentation can influence the quality of the segmentation,9 and segmentation accuracy can improve with the use of averaged images with higher signal-to-noise ratio.16 Beyond segmentation issues, a growing number of studies have reported anatomic abnormalities that interfere with identification of the FAZ in otherwise healthy individuals, as well as some with pathologic features.16–23 These have been described as macular—foveal capillaries or an ambiguous, undefined, or unmeasurable FAZ.
The inability to define a FAZ accurately obviates the use of most FAZ-based metrics. However, classifying a patient as having an ambiguous FAZ currently is a subjective determination. In this study, we described a method for detecting the presence of an ambiguous (i.e., fragmented) FAZ in OCTA images of the superficial capillary plexus. In addition, we further characterized a larger series of these eyes to examine whether this altered FAZ topography affects visual acuity or any aspects of foveal anatomic features (i.e., foveal morphologic features, foveal outer nuclear layer thickness, parafoveal intercapillary area, or foveal cone density).
Methods
Participants
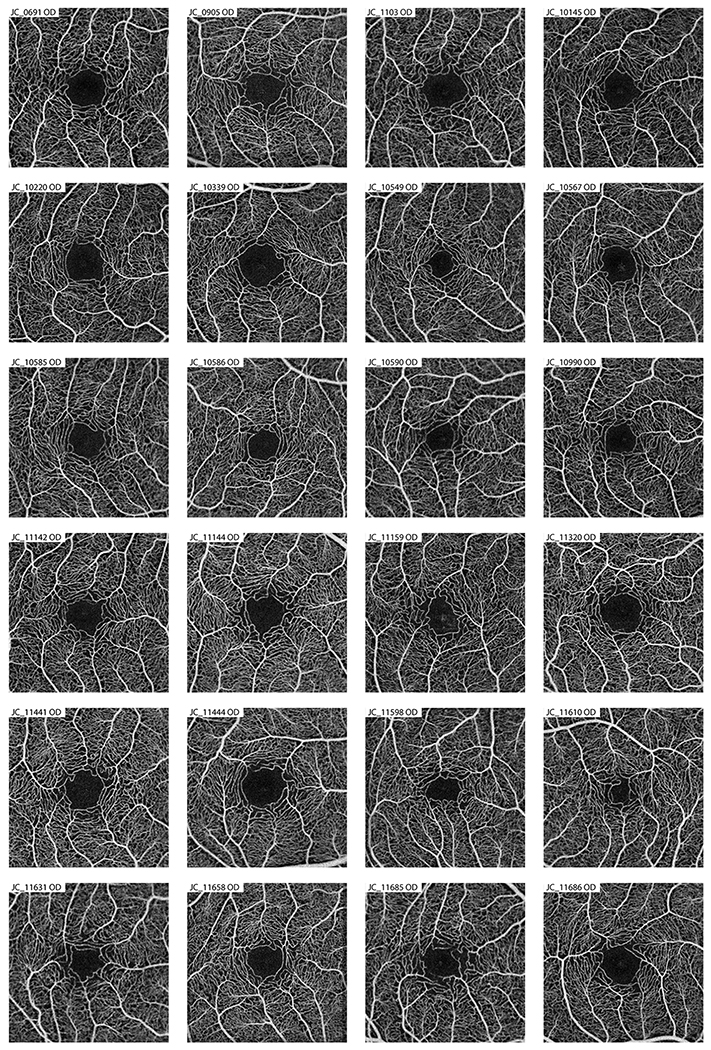
The study was approved by the institutional review board of the Medical College of Wisconsin (identifier, PRO 23999) and was conducted in accordance with the tenets of the Declaration of Helsinki. Informed consent was obtained from all participants after the nature and risks of the study were explained. An ocular health questionnaire was used to collect self-reported ocular history. Of 250 individuals with no reported history of ocular or systemic disease and no obvious abnormalities on OCT, 12 participants were found to have microvessels running through the presumed FAZ in at least 1 eye when imaged on OCTA. Eight participants (of the possible 12) returned for follow-up imaging (OCT, adaptive optics scanning light ophthalmoscopy [AOSLO], and OCTA) and best-corrected visual acuity (BCVA) measurements in both eyes. One participant with amblyopia and another patient with autosomal recessive bestrophinopathy (previously reported24,25) were found to have similar ambiguous FAZs in the left eyes and underwent similar phenotyping. Finally, 1 participant with a history of being born premature was recruited at Oregon Health & Science University and underwent imaging at the Medical College of Wisconsin. In addition, 24 individuals with no ocular or systemic pathologic features and a single FAZ (defined subjectively) had 1 eye assessed for comparison (Fig 1, available at www.ophthalmologyretina.org). These participants were selected based on gender, age, and the availability of OCT and OCTA images. Axial length was acquired in all participants using an IOLMaster (Carl Zeiss Meditec, Dublin, CA). This was used to estimate the lateral scale of the various retinal images as previously described.26 Before retinal imaging, eyes were dilated and accommodation was suspended using 1 drop each of phenylephrine hydrochloride (2.5%) and tropicamide (1%).
Figure 1.
Averaged OCT-A images of the contorl subjects used in the creation of the parafoveal intercapillary area normative database. Eyes within the control group were used as a comparison against the eyes with a “fragmented” FAZ to see if there were any difference in other foveal morphology measurements.
Spectral-Domain OCT Imaging
Using a Cirrus HD-OCT (Carl Zeiss Meditec), a single volumetric scan (6 × 6-mm nominal area; 512 A-scans/B-scan, 128 B-scans) was acquired in each eye to assess foveal pit morphologic features including foveal pit depth and foveal pit area using a previously described custom MATLAB script (MathWorks, Natick, MA).27 Directional OCT images were acquired as described previously to enable visualization of the Henle fiber layer—outer nuclear layer (ONL) boundary, thus permitting accurate measurements of ONL thickness.28 The 3 horizontally oriented directional OCT images (acquired using nasal, central, and temporal pupil entry) were aligned using the previously described custom MATLAB software,28 and the maximum intensity projection was generated with ImageJ software (National Institutes of Health, Bethesda, MD).29 The foveal ONL was measured at the deepest part of the foveal pit using a longitudinal reflectivity profile method (OCT Reflectivity Analytics, Milwaukee, WI; https://github.com/whytestalyon/ORA ).30
Additionally, high-density line scans (7-mm nominal length; 1000 A-scans/B-scan, 80 repeated B-scans) were acquired through the foveal center using the Bioptigen Envisu R2200 SD-OCT system (Leica Microsystems, Wetzlar, Germany). A substack of 15 to 20 B-scans then were aligned using ImageJ’s StackReg plugin.29,31 The aligned scans then were averaged to improve the signal-to-noise ratio. Foveal inner retinal area2 was measured as the area between the internal limiting membrane and outer plexiform layer (segmented using the Duke OCT Retinal Analysis Program32) from the foveal center to 500 μm in the temporal and nasal directions. A ratio of the nasal-to-temporal foveal inner retinal area was used to assess for asymmetry in foveal inner retinal layer topography.
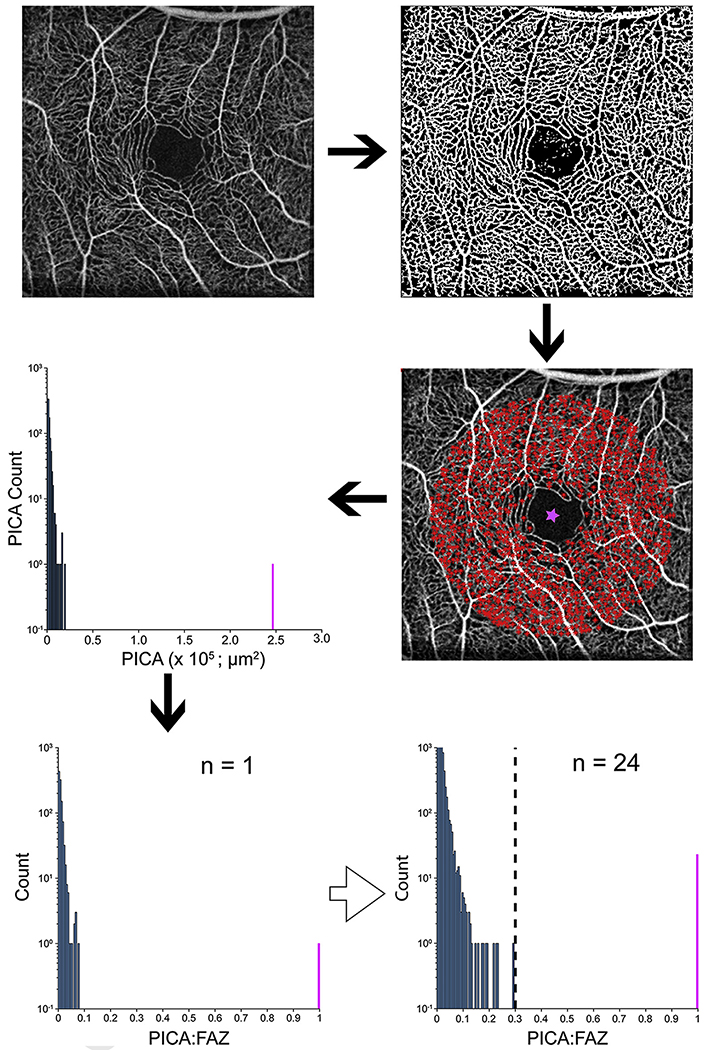
Five 3 × 3-mm (nominal area) angiograms per eye were acquired using the AngioVue OCTA system (Optovue, Inc., Fremont, CA). Two scans (1 horizontal, 1 vertical) each consisting of 304 B-scans with 304 A-scans/B-scan were acquired and coregistered to create each angiogram. From each volume, a custom slab from 3 μm above the internal limiting membrane to 16 μm above the inner plexiform layer was extracted. For each eye, the slabs were registered using StackReg in ImageJ29,31 and averaged. The image then was run through a custom MATLAB script where each parafoveal intercapillary area (PICA) was identified within a 1.3-mm radius centered on the foveal pit.15 The area of each PICA was measured, and the average and total PICA, including the FAZ, then were computed for each eye.15
Defining Fragmented Foveal Avascular Zones
To classify a FAZ as fragmented, a normative database of PICA values was created using the 24 controls (Fig 1). The PICA measurements for a given image then were normalized based on the largest PICA value in that image, which in controls is the singular FAZ (PICA-to-FAZ ratio). The largest PICA-to-FAZ ratio was 0.29 (Fig 2); therefore, a cutoff of 0.3 for a PICA-to-FAZ ratio was used in analyzing the participants. If an eye showed multiple PICA-to-FAZ values of more than 0.3, it was determined to have a fragmented FAZ, whereas those with a single PICA-to-FAZ value of more than 0.3 were defined as normal.
Figure 2.
Images showing the parafoveal intercapillary area (PICA) method to detect a fragmented foveal avascular zone (FAZ). Five angiograms were averaged per eye. The averaged image was run through a custom Matlab script that binarized the image and measured the area of the PICAs (red stars) within 1.3 mm of the base of the fovea (pink star). A histogram of the raw PICA values was created with the FAZ shown in pink. Because of the large between-participant variation in FAZ size, the PICAs were normalized to the FAZ (PICA:FAZ). A single histogram for all 24 control participants was used to identify the maximum PICA ratio of 0.29. Based on this, a threshold of 0.3 was used (dashed vertical line) to classify FAZs as fragmented; FAZs in participants with more than 1 PICA:FAZ above this threshold were defined as fragmented.
Adaptive Optics Scanning Light Ophthalmoscopy Retinal Imaging
Using a previously described confocal AOSLO device,33 videos of the photoreceptor mosaic were acquired at multiple locations within the parafovea. Individual videos were registered and averaged to produce images with a high signal-to-noise ratio,34,35 and images from overlapping areas were montaged together semiautomatically.36 A 300 × 300-μm region of interest centered on the foveal area was extracted from each montage for quantitative analysis. Cones were identified semiautomatically by a single observer (J.A.C.) using custom software (Translational Imaging Innovations, Inc., Hickory, NC).26 Density maps were generated from the resulting cone coordinates using a sum-map approach. First, the bound cone density was estimated at each cone coordinate with a region of interest that changed in size to contain 100 bound cones (ranging from 20 × 20 μm to 65 × 65 μm). Then, the density at each pixel in the map was estimated as the average density of the regions of interest overlapping that pixel. Peak cone density and its coordinate location were extracted from each map. Because of poor image quality for participants JC_0617 and JC_12032, cone spacing was used to estimate the peak cone density, as described previously.37 Only 15 of the 24 controls had similar AOSLO imaging available.
Statistical Analysis
To control for the use of both eyes in the analysis, individuals with a fragmented FAZ in both eyes were assessed for symmetry of each anatomic metric using a paired t test or Wilcoxon signed matched-pairs rank test (Prism; GraphPad Software, La Jolla, CA). The choice of test was based on an analysis of normality (P < 0.05) for the differences between eyes using the Shapiro-Wilk normality test (Prism). In addition, a Bonferroni correction was applied to correct for multiple comparisons; a P value of less than 0.007 represented statistical significance. To compare control eyes and the eyes with a fragmented FAZ, either an unpaired t test or a Mann—Whitney U test was used (P < 0.007 to adjust for multiple comparisons; Prism). The choice of test was determined based on an analysis of normality (P < 0.05) using a Shapiro-Wilk normality test (Prism).
Results
Of the 11 participants with ambiguous FAZs who returned for follow-up imaging, the average age±standard deviation was 23.6 ± 9.19 years. Participant demographics, monocular BCVA, and FAZ fragmentation status are found in Table 1. The 24 controls had an average age±standard deviation of 28.0 ± 8.69 years, which was not significantly different than that of the participants with fragmented FAZs (P > 0.05, Mann—Whitney U test). The 24 controls had a similar ethnic and racial (21 white, 3 Asians) and gender (75% females) make-ups as the 11 participants.
Table 1.
Demographics of Participants with a Fragmented Foveal Avascular Zone
| Best-Corrected Visual Acuity |
|||||||
|---|---|---|---|---|---|---|---|
| Participant No. | Gender | Race | Age (yrs) | Diagnosis | Eye | Right Eye | Left Eye |
| JC_0007 | Male | White | 41 | Normal | Both | 20/12.5 + 1 | 20/16 + 2 |
| JC_0617 | Male | White | 34 | Normal | Both | 20/10 − 2 | 20/10 − 2 |
| JC_11068* | Female | White | 32 | Normal | Right | 20/16 + 2 | 20/12.5 − 2 |
| JC_11354 | Female | Hispanic, Native Hawaiian, or Other Pacific Islander | 24 | Normal | Both | 20/20 + 1 | 20/16 − 2 |
| JC_11442 | Male | White | 24 | Normal | Right | 20/12.5 − 2 | 20/12.5 − 1 |
| JC_12020 | Female | White | 23 | Normal | Both | 20/20 − 1 | 20/20 |
| JC_12031† | Female | White | 9 | Normal | Both | 20/16 | 20/16 − 1 |
| JC_12032† | Male | White | 12 | Normal | Left | 20/16 + 1 | 20/16 + 1 |
| JC_11657 | Female | White | 22 | Amblyopia (right eye) | Left | 20/50 − 1 | 20/12.5 + 1 |
| BL_12063 | Male | White | 22 | Premature | Both | 20/16 + 2 | 20/12.5 − 1 |
| AM_11858‡ | Female | White | 17 | Autosomal recessive bestrophinopathy, amblyopia (right eye) | Left | 20/50 − 1 | 20/25 + 2 |
Mother of JC_12031 and JC_12032. Participant’s case was published previously.31
Siblings.
Participant’s case was published previously.
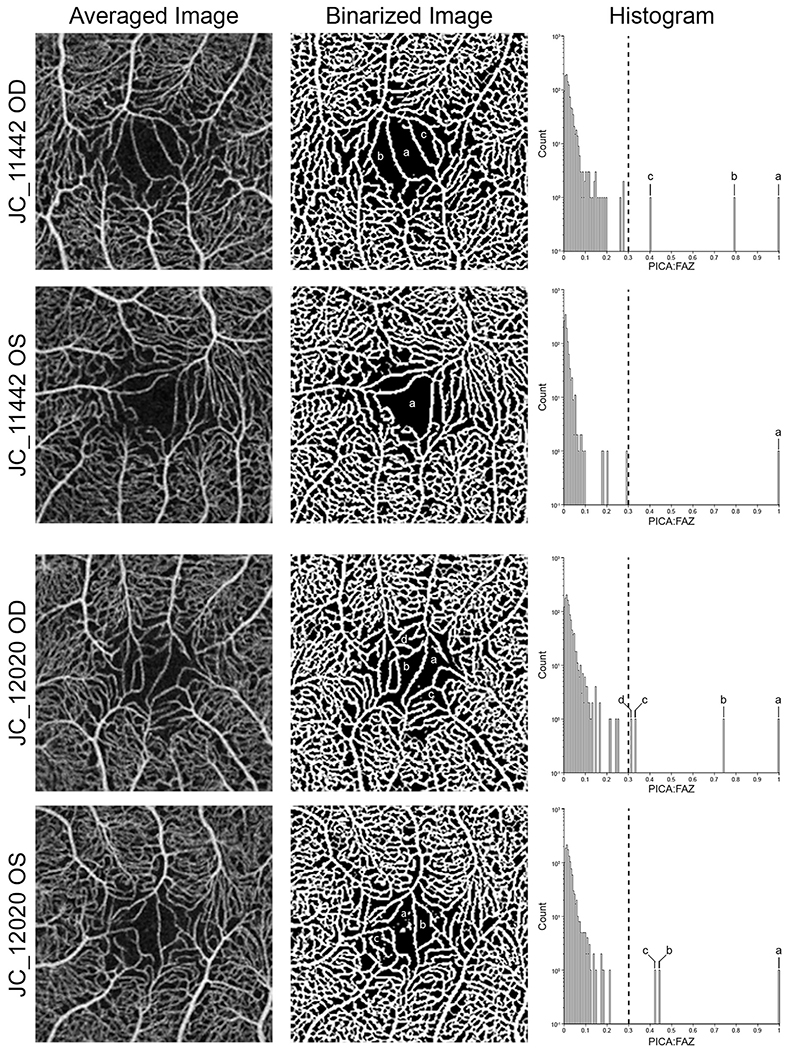
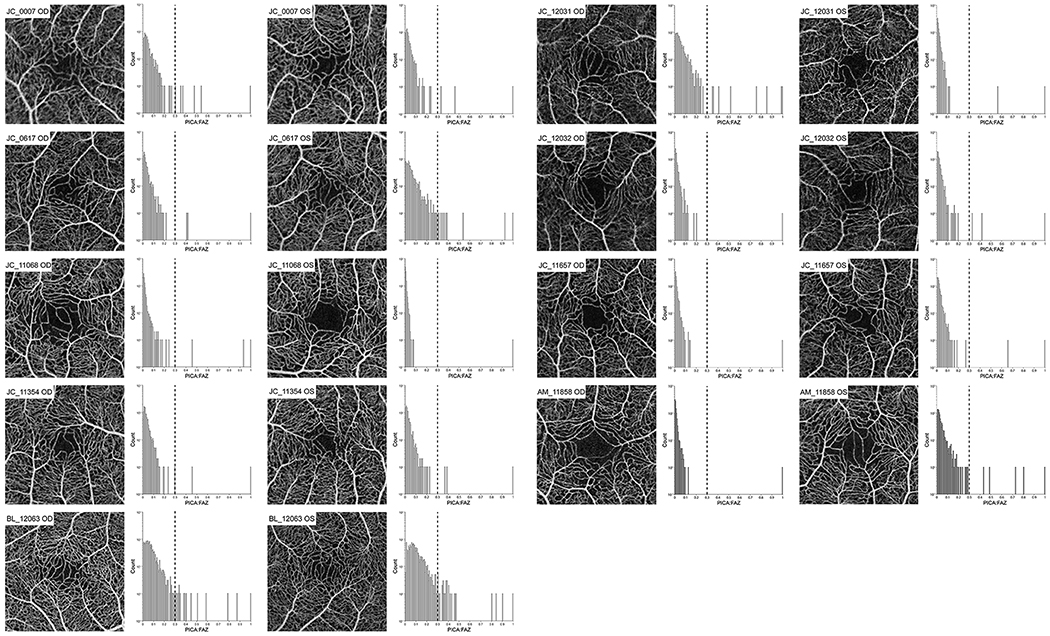
Of the participants who returned for follow-up imaging, 5 participants demonstrated a fragmented FAZ in 1 eye, with the other 6 participants having bilateral fragmented FAZs (Fig 3; Fig 4, available at www.ophthalmologyretina.org). However, 2 of the 5 individuals with unilateral fragmentation demonstrated amblyopia that affected the eyes without a fragmented FAZ. Because of the difference in visual acuity caused by amblyopia, it is impossible to determine the impact of the fragmented FAZ on the visual acuity. Of the 3 participants without pathologic features and only 1 eye with a fragmented FAZ, 1 participant demonstrated the same visual acuity in both eyes, whereas the other 2 participants demontrated better visual acuity in the eye without an ambiguous FAZ (although the difference was a single letter on the Early Treatment Diabetic Retinopathy Study chart; see Table 1). In addition, the average BCVA for the 17 eyes with a fragmented FAZ was 20/15 ± 0.9 lines. The lowest visual acuity associated with an eye with a fragmented FAZ was 20/25 + 2, which was found in the individual with autosomal recessive bestrophinopathy. Among the 9 participants without pathologic features (18 eyes), we also found no significant relationship between the size of the second largest PICA-to-FAZ ratio and logarithm of the minimum angle of resolution visual acuity (linear regression, r = 0.082; P = 0.75), consistent with the fragmented FAZ not impacting visual acuity.
Figure 3.
Examples of individuals with altered foveal avascular zone (FAZ) topography. In participant JC_11442’s right eye, multiple parafoveal intercapillary area (PICA)-to-FAZ (PICA:FAZ) regions of more than 0.3 (a—c) are present, whereas the left eye is defined as normal according to our threshold. Participant JC_12020 shows multiple PICA:FAZ regions of more than 0.3 in both eyes, resulting in both being classified as fragmented. Each region above the 0.3 threshold is labeled on the binarized image and histogram for comparison.
Figure 4.
Averaged OCT-A images and histograms of the other nine subjects of eleven (two shown in Figure 3) with at least one eye determined to have a fragmented FAZ. Each histogram shows all parafoveal intercapillary areas (PICA) within a 1.3 mm radius from the deepest part of the foveal pit to the largest PICA (PICA:FAZ). An FAZ is classified as “fragmented” when two or more PICA:FAZ region are above 0.3 (dashed lines). If only one PICA is above 0.3, the FAZ is classified as normal.
Six individuals demonstrated fragmented FAZs in both eyes. Six metrics (foveal pit depth, foveal pit area, average PICA, foveal ONL thickness, temporal-to-nasal foveal inner retinal area ratio, and peak cone density) passed normality (P > 0.05 for each, Shapiro-Wilk test), with summed PICA failing normality (P = 0.001, Shapiro-Wilk test). All metrics exhibited interocular symmetry (P > 0.05 for all), so 1 eye for each participant was selected randomly for further analysis. The participant with autosomal recessive bestrophinopathy was excluded from further analysis because this patient demonstrated a central serous detachment, which confounded our analysis of foveal structure for this participant.
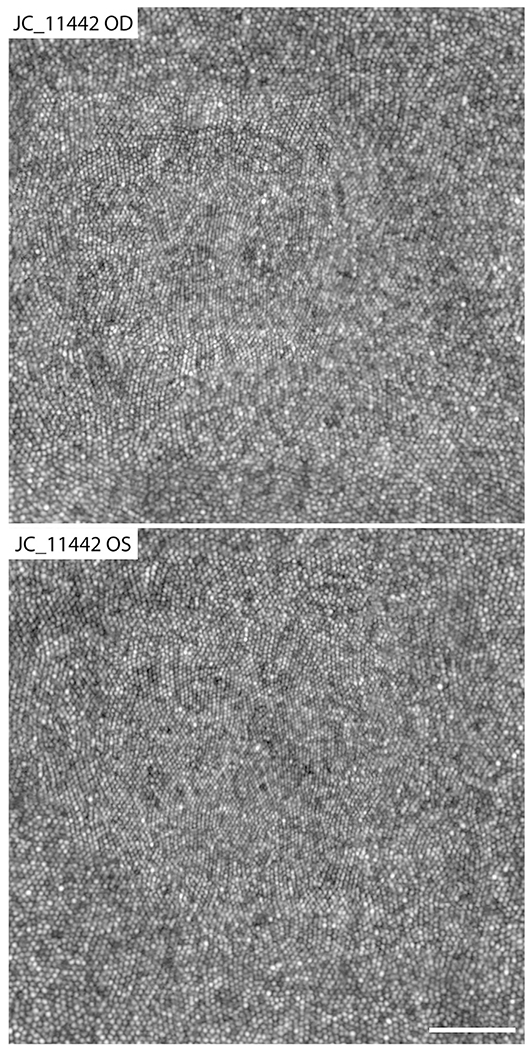
Comparisons of foveal morphologic metrics depending on fragmented FAZ status are shown in Figure 5. Compared with eyes with a fragmented FAZ, the eyes in the control group showed deeper foveal pits (P < 0.001, unpaired t test), with an average difference of 33 μm. The eyes in the control group showed larger foveal areas than the eyes with a fragmented FAZ (P = 0.002, Mann—Whitney U test), with an average difference of 0.60 mm2. However, the foveal inner retinal area ratio was not different between the groups (P = 0.66, unpaired t test), with an average difference of 0.03. The control eyes showed more total PICA, with an average of 2.45 mm2 in comparison with 2.30 mm2 for eyes with fragmented FAZs (P < 0.001, unpaired t test), although the average size of the intercapillary areas was not different between the groups (0.0023 mm2 vs. 0.0021 mm2, respectively; P = 0.06, unpaired t test). When examining foveal cone structure, we found that neither ONL thickness (P = 0.18, unpaired t test) nor peak cone density (P = 0.24, unpaired t test) were significantly different in eyes with fragmented FAZs, with average differences of 6.83 μm and 13 486 cones/mm2, respectively. The values we observed (across all our participants) were consistent with previously reported ONL38 and peak cone density values in normal individuals.39 Examples of the foveal cone mosaic are shown in Figure 6.
Figure 5.
Graphs comparing control eyes and eyes with a fragmented foveal avascular zone (FAZ). The control population is shown as a box-and-whisker plot (dashed line, mean; box limits, 25th—75th percentiles; whiskers, minimum and maximum). Each point within the fragmented and fellow eye group is a single eye (open, left eye [OS]; filled, right eye [OD]). Dotted lines connect the eyes in participants with unilateral fragmentation of the FAZ. Although the fellow eye is shown for comparison (when available), no statistical tests were performed between these groups. A significant difference was found between foveal pit depth, foveal pit area, and total PICA when comparing the controls with the fragmented eyes. FIRA = ■■■; ONL = outer nuclear layer.
Figure 6.
Adaptive optics scanning light ophthalmoscopy images of the foveal cone mosaic for participant JC_11442. The right eye was determined to have a fragmented foveal avascular zone (FAZ) and shows a peak cone density of 241 286 cones/mm2. The left eye was classified as having a normal FAZ and showed a peak cone density of 247 710 cones/mm2. These peak cone density values are consistent with normal values from previous studies.39,45 Scale bar = 50 μm.
Discussion
With the advent of OCTA, interest in using different retinal vasculature markers to diagnose and monitor progression of various retinal diseases has increased.8 A number of these metrics depend on accurately measuring or identifying the FAZ. However, multiple studies have shown what seems to be a variant of normal retinal vasculature, the presence of macular—foveal capillaries (resulting in an ambiguous or unidentifiable FAZ).17,19,23 In this study, we evaluated the frequency of these ambiguous or fragmented FAZs in our large normative dataset using an objective method to analyze the OCTA images. We also assessed the impact of a fragmented FAZ on BCVA and multiple aspects of foveal anatomic features.
Yokoyama et al17 reported a prevalence of 1.5% of ambiguous FAZs in their large normative cohort, with 1 instance of having both FAZs being fragmented. All participants were reported to have better than 20/20 vision in the eye with the ambiguous FAZ. Herein, we report a higher frequency of 4.8% in our healthy cohort of 250 individuals. The higher frequency may be the result of demographic differences between our study populations, although Yokoyama et al17 did not report the racial makeup of their population. Regardless, our study is in agreement with others that found no evidence for reduced visual acuity in eyes with a fragmented FAZ.17,23
In addition, Yokoyama et al17 and Pilotto et al23 concluded that individuals with ambiguous (fragmented) FAZs should be considered to have low-grade foveal hypoplasia, although they did not quantify foveal pit morphologic features. Our participants with a fragmented FAZ showed significantly shallower foveal pits, which is consistent with altered foveal anatomic features; however, we did not observe retained inner retinal layers in any of our participants, which typically is included in a diagnosis of foveal hypoplasia.40 Higher-resolution techniques, such as adaptive optics OCT,41 may be useful in determining if more subtle alterations to the inner retinal layers exist in eyes with fragmented FAZs.
Another important aspect of foveal specialization is the absence of rod photoreceptors in the central fovea, creating a rod-free zone. A recent study by Pilotto et al23 found an absence of a foveal scotoma using scotopic microperimetry in eyes with macular—foveal capillaries. The authors concluded that an anomalous foveal distribution of photoreceptors existed, including an absence of the normal rod-free zone. However, we found normal foveal cone density in eyes with a fragmented FAZ (Figs 5 and 6). Further, one would expect that if rods were in the fovea, they may alter the normal triangular packing geometry of the cone mosaic. However, we found no reduction in the regularity of the foveal photoreceptor mosaic in the eyes with a fragmented FAZ (data not shown). Taken together, our AOSLO imaging data are inconsistent with any hypothesized alteration of the foveal photoreceptor mosaic.
Although the presence of a fragmented FAZ does not seem to affect vision, important implications exist for analysis of these retinas. A number of quantitative metrics used to characterize the FAZ, such as acircularity42 and axis ratio,42 would not be reliable in eyes without a clearly defined FAZ. Moreover, measures of the parafoveal vasculature (PICA, vessel density) often exclude the FAZ from analysis and even use the FAZ contour to define parafoveal regions for analysis.15 Again, a fragmented FAZ would confound these approaches. Herein, we provide a robust automated method for detecting a fragmented FAZ that could allow for prescreening of participants before more advanced analysis. However, because their cause currently is unknown, simply excluding these participants may not be appropriate, depending on the goals of the study.
One limitation of this study is our relatively small sample size. Because of this, and the fact that 50% of our participants with fragmented FAZs had them in both eyes, we were unable to use a fellow-eye comparison to assess the impact of fragmented FAZ. In addition, the normative database from which we identified these patients were all relatively young with similar ethnic and racial backgrounds. Further assessment of individuals from different ethnic and racial groups is necessary to attain a better understanding of how possible genetic components may contribute to this FAZ variant. The cross-sectional nature of our study also is a limitation. It would be important to examine whether (or how) the presence of a fragmented FAZ alters the vascular manifestation of subsequent systemic insults, such as diabetes or hypertension.3
Ambiguous or fragmented FAZs have a frequency of 4.8% in our normative database, and we present an objective method for definition of a fragmented FAZ. Because of the relatively high frequency of fragmented FAZs, studies using biomarkers dependent on the identification of the FAZ should screen for the presence of this anatomic variant in their study-specific populations. Finally, it may be worth considering whether a fragmented FAZ is in any way similar in cause to congenital retinal macrovessels,43 perhaps a congenital retinal microvessel. For example, a recent study reported that 59% of congenital retinal macrovessels cross through the fovea.44 However, congenital retinal macrovessels are nearly always unilateral occurrences, whereas 50% of our participants with fragmented FAZs had unilateral presentation. Regardless, because capillary anomalies in the brain have been reported for individuals with congenital retinal macrovessels,44 it may be worth exploring whether similar vascular alterations exist in participants with fragmented FAZs, given their higher prevalence.44
Acknowledgments.
The authors thank Shay Bourgeois, Erin Curran, Mara Goldberg, Alison Huckenpahler, Brittany Rego, Phyllis Summerfelt, Melissa Wilk, Vesper Williams, and Erica Woertz for help with recruiting and imaging participants and with image analysis and Sina Farsiu for providing access to the Duke OCT Retinal Analysis Program.
Supported in part by the National Eye Institute, National Institutes of Health, Bethesda, Maryland (grant nos.: R01EY024969, P30EY001931, R01EY027301, T32EY014537, R01EY017607, and P30EY010572); the National Center for Advancing Translational Sciences, National Institutes of Health (grant no.: UL1TR001436); and the National Institute of Aging, National Institutes of Health (grant no.: T35AG029793). This investigation was conducted in a facility constructed with support from the Research Facilities Improvement Program, National Center for Research Resources, National Institutes of Health (grant no.: C06RR016511). The content is solely the responsibility of the authors and does not necessarily represent the official views of the National Institutes of Health. Additional support was received from Research to Prevent Blindness, Inc, New York, New York (unrestricted departmental award); and the Nick Cacciola Summer Student Fellowship Award from Fight for Sight (R.E.L.).
Abbreviations and Acronyms:
- AOSLO
adaptive optics scanning light ophthalmoscopy
- BCVA
best-corrected visual acuity
- FAZ
foveal avascular zone
- OCTA
OCT angiography
- ONL
outer nuclear layer
- PICA
parafoveal intercapillary area
Footnotes
Presented in part at: Association for Research in Vision and Ophthalmology Annual Meeting, May 2019, Vancouver, Canada; and International Ocular Circulation Society Annual Meeting, August 2019, Portland, Oregon.
Financial Disclosure(s):
The author(s) have made the following disclosure(s): R.E.L.: Consultant - OptoVue.
A.D.M.: Equity owner - LAgen Laboratories LLC.
B.J.L.: Consultant - Genentech/Roche, CellCure, BioTime; Financial support - Carl Zeiss Meditech, OptoVue; Equity owner - Translational Imaging Innovations, Inc; Patent - Directional optical coherence tomography (University of California, Berkeley).
R.B.R.: Consultant - Optovue, Astellas, NanoRetina, OD-OS, Regeneron, Boehringer- Ingelheim; Financial support - Carl Zeiss Meditech, Zeavision; Equity owner - Opticology, Guardion Health; Advanced Cellular Technologies, Clarity.
J.C.: Consultant - MeiraGTx; Equity owner - Translational Imaging Innovations, Inc; Nonfinancial support - OptoVue.
HUMAN SUBJECTS: Human subjects were included in this study. The human ethics committees at the Medical College of Wisconsin approved the study. All research adhered to the tenets of the Declaration of Helsinki. All participants provided informed consent.
No animal subjects were included in this study.
Supplemental material is available at www.ophthalmologyretina.org.
References
- 1.Provis JM. Development of the primate retinal vasculature. Prog Retin Eye Res. 2001;20:799–821. [DOI] [PubMed] [Google Scholar]
- 2.Tick S, Rossant F, Ghorbel I, et al. Foveal shape and structure in a normal population. Invest Ophthalmol Vis Sci. 2011;52:5105–5110. [DOI] [PubMed] [Google Scholar]
- 3.Tam J, Dhamdhere KP, Tiruveedhula P, et al. Disruption of the retinal parafoveal capillary network in type 2 diabetes before the onset of diabetic retinopathy. Invest Ophthalmol Vis Sci. 2011;52:9257–9266. [DOI] [PMC free article] [PubMed] [Google Scholar]
- 4.Spaide RF, Klancnik JMJ, Cooney MJ. Retinal vascular layers in macular telangiectasia type 2 imaged by optical coherence tomography angiography. JAMA Ophthalmol. 2015;133:66–73. [DOI] [PubMed] [Google Scholar]
- 5.Matsushita I, Nagata T, Hayashi T, et al. Foveal hypoplasia in patients with Stickler syndrome. Ophthalmology. 2017;124:896–902. [DOI] [PubMed] [Google Scholar]
- 6.Kwapong WR, Ye H, Peng C, et al. Retinal microvascular impairment in the early stages of Parkinson’s disease. Invest Ophthalmol Vis Sci. 2018;59:4115–4122. [DOI] [PubMed] [Google Scholar]
- 7.Cheung CY, Ong YT, Ikram MK, et al. Retinal microvasculature in Alzheimer’s disease. J Alzheimers Dis. 2014;42(Suppl 4):S339–S352. [DOI] [PubMed] [Google Scholar]
- 8.Villani E, Massaro D, Scaramuzzi M, et al. Decade-long profile of imaging biomarkers use in ophthalmic clinical trials. Invest Ophthalmol Vis Sci. 2017;58:BI076–BI081. [DOI] [PubMed] [Google Scholar]
- 9.Linderman R, Salmon AE, Strampe M, et al. Assessing the accuracy of foveal avascular zone measurements using optical coherence tomography angiography: segmentation and scaling. Transl Vis Sci Technol. 2017;6:16. [DOI] [PMC free article] [PubMed] [Google Scholar]
- 10.Fotedar R, Wang JJ, Burlutsky G, et al. Distribution of axial length and ocular biometry measured using partial coherence laser interferometry (IOL Master) in an older white population. Ophthalmology. 2010;117:417–423. [DOI] [PubMed] [Google Scholar]
- 11.Patterson EJ, Wilk M, Langlo CS, et al. Cone photoreceptor structure in patients with X-linked cone dysfunction and red-green color vision deficiency. Invest Ophthalmol Vis Sci. 2016;57:3853–3963. [DOI] [PMC free article] [PubMed] [Google Scholar]
- 12.Wildsoet CF, Oswald PJ, Clark S. Albinism: its implications for refractive development. Invest Ophthalmol Vis Sci. 2000;41:1–7. [PubMed] [Google Scholar]
- 13.Wagner-Schuman M, Dubis AM, Nordgren RN, et al. Race- and sex-related differences in retinal thickness and foveal pit morphology. Invest Ophthalmol Vis Sci. 2011;52:625–634. [DOI] [PMC free article] [PubMed] [Google Scholar]
- 14.Chui TYP, Zhong Z, Song H, Burns SA. Foveal avascular zone and its relationship to foveal pit shape. Optom Vis Sci. 2012;89:602–610. [DOI] [PMC free article] [PubMed] [Google Scholar]
- 15.Krawitz BD, Phillips E, Bavier RD, et al. Parafoveal non-perfusion analysis in diabetic retinopathy using optical coherence tomography angiography. Transl Vis Sci Technol. 2018;7:4. [DOI] [PMC free article] [PubMed] [Google Scholar]
- 16.Schmidt TG, Linderman RE, Strampe MR, et al. The utility of frame averaging for automated algorithms in analyzing retinal vascular biomarkers in AngioVue OCTA. Transl Vis Sci Technol. 2019;8:10. [DOI] [PMC free article] [PubMed] [Google Scholar]
- 17.Yokoyama T, Maruko I, Koizumi H, et al. Unmeasurable small size of foveal avascular zone without visual impairment in optical coherence tomography angiography. Eye (Lond). 2018;32:1062–1066. [DOI] [PMC free article] [PubMed] [Google Scholar]
- 18.Carpineto P, Mastropasqua R, Marchini G, et al. Reproducibility and repeatability of foveal avascular zone measurements in healthy subjects by optical coherence tomography angiography. Br J Ophthalmol. 2016;100:671–676. [DOI] [PubMed] [Google Scholar]
- 19.Sousa DC, Leal I, Abegão Pinto L. Vessels crossing the fovea: a familial normal variant? Ophthalmol Retina. 2017;1:67. [DOI] [PubMed] [Google Scholar]
- 20.Takagi M, Maruko I, Yamaguchi A, et al. Foveal abnormalities determined by optical coherence tomography angiography in children with history of retinopathy of prematurity. Eye (Lond). In press. [DOI] [PMC free article] [PubMed] [Google Scholar]
- 21.Yeung J, Crock G, Cairns J, et al. Macular-foveal capillaries in human retina. Aust J Ophthalmol. 1973;1:17–23. [DOI] [PubMed] [Google Scholar]
- 22.Cicinelli MV, Carnevali A, Rabiolo A, et al. Clinical spectrum of macular-foveal capillaries evaluated with optical coherence tomography angiography. Retina. 2017;37:436–443. [DOI] [PubMed] [Google Scholar]
- 23.Pilotto E, Leonardi F, Deganello D, et al. Morphofunctional evaluation of macular-foveal capillaries: a comparative optical coherence tomography angiography and microperimetry study. Retina. In press. [DOI] [PubMed] [Google Scholar]
- 24.Johnson AA, Bachman LA, Gilles BJ, et al. Autosomal recessive bestrophinopathy is not associated with the loss of bestrophin-1 anion channel function in a patient with a novel best1 mutation. Invest Ophthalmol Vis Sci. 2015;56:4619–4630. [DOI] [PMC free article] [PubMed] [Google Scholar]
- 25.Marmorstein AD, Johnson AA, Bachman LA, et al. Mutant best1 expression and impaired phagocytosis in an IPSC model of autosomal recessive bestrophinopathy. Sci Rep. 2018;8:4487. [DOI] [PMC free article] [PubMed] [Google Scholar]
- 26.Cooper RF, Wilk MA, Tarima S, Carroll J. Evaluating descriptive metrics of the human cone mosaic. Invest Ophthalmol Vis Sci. 2016;57:2992–3001. [DOI] [PMC free article] [PubMed] [Google Scholar]
- 27.Dubis AM, Hansen BR, Cooper RF, et al. Relationship between the foveal avascular zone and foveal pit morphology. Invest Ophthalmol Vis Sci. 2012;53:1628–1636. [DOI] [PMC free article] [PubMed] [Google Scholar]
- 28.Lujan BJ, Roorda A, Croskrey JA, et al. Directional optical coherence tomography provides accurate outer nuclear layer and Henle fiber layer measurements. Retina. 2015;35:1511–1520. [DOI] [PMC free article] [PubMed] [Google Scholar]
- 29.Schneider CA, Rasband WS, Eliceiri KW. NIH Image to ImageJ: 25 years of image analysis. Nat Methods. 2012;9:671–675. [DOI] [PMC free article] [PubMed] [Google Scholar]
- 30.Wilk MA, Wilk BM, Langlo CS, et al. Evaluating outer segment length as a surrogate measure of peak foveal cone density. Vision Res. 2017;130:57–66. [DOI] [PMC free article] [PubMed] [Google Scholar]
- 31.Thévenaz P, Ruttimann UE, Unser M. A pyramid approach to subpixel registration based on intensity. IEEE Trans Image Process. 1998;7:27–41. [DOI] [PubMed] [Google Scholar]
- 32.Chiu SJ, Li XT, Nicholas P, et al. Automatic segmentation of seven retinal layers in SDOCT images congruent with expert manual segmentation. Opt Express. 2010;18:19413–19428. [DOI] [PMC free article] [PubMed] [Google Scholar]
- 33.Dubra A, Sulai Y. Reflective afocal broadband adaptive optics scanning ophthalmoscope. Biomed Opt Express. 2011;2:1757–1768. [DOI] [PMC free article] [PubMed] [Google Scholar]
- 34.Dubra A, Harvey Z. Registration of 2D images from fast scanning ophthalmic instruments In: Fischer B, Dawant B, Lorenz C, eds. Biomedical Image Registration. 1st ed. Berlin: Springer-Verlag; 2010. [Google Scholar]
- 35.Salmon AE, Cooper RF, Langlo CS, et al. An automated reference frame selection (ARFS) algorithm for cone imaging with adaptive optics scanning light ophthalmoscopy. Transl Vis Sci Technol. 2017;6:9. [DOI] [PMC free article] [PubMed] [Google Scholar]
- 36.Chen M, Cooper RF, Han GK, et al. Multi-modal automatic montaging of adaptive optics retinal images. Biomed Opt Ex press. 2016;7:4899–4918. [DOI] [PMC free article] [PubMed] [Google Scholar]
- 37.Cooper RF, Langlo CS, Dubra A, Carroll J. Automatic detection of modal spacing (Yellott’s ring) in adaptive optics scanning light ophthalmoscope images. Ophthalmic Physiol Opt. 2013;33:540–549. [DOI] [PMC free article] [PubMed] [Google Scholar]
- 38.Lee DJ, Woertz EN, Visotcky A, et al. The Henle fiber layer in albinism: comparison to normal and relationship to outer nuclear layer thickness and foveal cone density. Invest Ophthalmol Vis Sci. 2018;59:5336–5348. [DOI] [PMC free article] [PubMed] [Google Scholar]
- 39.Wang Y, Bensaid N, Tiruveedhula P, et al. Human foveal cone photoreceptor topography and its dependence on eye length.eLife. 2019;8 e47148. [DOI] [PMC free article] [PubMed] [Google Scholar]
- 40.Thomas MG, Kumar A, Mohammad S, et al. Structural grading of foveal hypoplasia using spectral-domain optical coherence tomography: a predictor of visual acuity? Ophthalmology. 2011;118:1653–1660. [DOI] [PMC free article] [PubMed] [Google Scholar]
- 41.Liu Z, Kurokawa K, Zhang F, et al. Imaging and quantifying ganglion cells and other transparent neurons in the living human retina. Proc Natl Acad Sci U S A. 2017;114:12803–12808. [DOI] [PMC free article] [PubMed] [Google Scholar]
- 42.Krawitz BD, Mo S, Geyman LS, et al. Acircularity index and axis ratio of the foveal avascular zone in diabetic eyes and healthy controls measured by optical coherence tomography angiography. Vision Res. 2017;139:177–186. [DOI] [PubMed] [Google Scholar]
- 43.Brown GC, Donoso LA, Magargal LE, et al. Congenital retinal macrovessels. Arch Ophthalmol. 1982;100:1430–1436. [DOI] [PubMed] [Google Scholar]
- 44.Pichi F, Freund KB, Ciardella AP, et al. Congenital retinal macrovessel and the association of retinal venous malformations with venous malformations of the brain. JAMA Ophthalmol. 2018;136:372–379. [DOI] [PMC free article] [PubMed] [Google Scholar]
- 45.Zhang T, Godara P, Blancob ER, et al. Variability in human cone topography assessed by adaptive optics scanning laser ophthalmoscopy. Am J Ophthalmol. 2015;160:290–300. [DOI] [PMC free article] [PubMed] [Google Scholar]


