Abstract
Bacillus velezensis LPL061, which shows strong exopolysaccharide (EPS) producing capacity, was isolated from carnations in Beijing, China. The complete genome of LPL061 comprised a single circular chromosome (3,907,268 bp; G+C content of 46.7%) with 3,737 coding DNA sequences, 26 rRNA, and 89 tRNA. According to genome analysis, 12 protein-coding genes which related to polysaccharide biosynthesis in LPL061 were identified. Comparative genome analysis revealed that the EPS biosynthetic gene cluster was relatively conserved among Bacillus species. EPS showed approximately 60% inhibitory activity on the α-glucosidase at 100 μg/mL. The results of quantitative reverse transcription PCR further demonstrated that compared to insulin-resistant model with insulin (500 μg/mL) (without EPS treatment), the insulin-resistant HepG2 cells treated with EPS decreased the expression of phosphoenolpyruvate carboxykinase (PEPCK) from 4.425 to 0.1587, glucose-6-phosphatase (G6Pase) decreased from 4.272 to 0.1929, and glycogen synthase kinase3β (GSK(3)β) decreased from 2.451 to 0.993, respectively. Meanwhile, EPS treatment increased GS expression and resulted in intracellular glycogen concentration increased from 28.30% to 86.48%, which further supported that EPS form LPL061 could reduce the concentration of blood glucose effectively. These results could be beneficial for better understanding of the hypoglycemic mechanism of B. velezensis LPL061 EPS and developing an EPS-based anti-diabetic agent in the future.
Electronic supplementary material
The online version of this article (10.1007/s13205-020-02228-y) contains supplementary material, which is available to authorized users.
Keywords: Bacillus velezensis LPL061, Complete genome sequence, Exopolysaccharide, Hypoglycemic
Introduction
Beneficial microorganisms can produce a variety of exopolysaccharides (EPS) that are safe for human beings. EPSs isolated from Bifidobacterium and Lactobacillus have immunomodulatory activity, thus protecting hosts against bacterial and viral infections (Emanuele et al. 2016; Liu et al. 2011; Yu et al. 2019). Hypoglycemic is one of the most important biological functions of polysaccharides produced by lactic acid bacteria (Bajpai et al. 2016). Diabetes mellitus is a chronic metabolic disease caused by insulin deficiency or receptor dysfunction. Nowadays, there are a few commercially available anti-diabetic drugs, including alpha-glucosidase inhibitors, biguanides, and sulfonylureas. Among those drugs, the anti-diabetic mechanisms are different (Guo et al. 2014; Rangika et al. 2015). Metformin, for example, can reduce blood glucose by promoting the sensitivity of peripheral tissues to glucose, inhibiting gluconeogenesis, inhibiting glycogen degradation, and delaying the glucose uptake in the intestine. Polysaccharides can decrease blood glucose concentration by enhancing the effect of insulin and improving insulin sensitivity and its mode of action is similar to that of metformin. Due to its safety, good hypoglycemic activity, and few side effects, EPSs have received researchers’ attention in the diabetes field.
Strain LPL061 was originally isolated from carnations with a high yield of EPS production and phylogenetically characterized as Bacillus velezensis by 16S rRNA gene analysis. (Zhang et al. 2012). We also studied the physical and chemical properties, thermal stability, rheological properties, and emulsifying properties of the EPS produced by this strain (Han et al. 2015). However, the biological activity of Bacillus polysaccharide in regulating blood glucose concentration remains largely unknown. In this study, the complete genome of B. velezensis LPL061 was sequenced, putative EPS biosynthetic pathway was identified, and the hypoglycemic activity of EPS in vitro was determined. The genome information of B. velezensis LPL061 and hypoglycemic activity of EPS provided a theoretical foundation for its application as a potential hypoglycemic agent in the future.
Materials and methods
Bacterial strains and culture
Bacillus velezensis LPL061 with high EPS yield was isolated from the carnation, China (Zhang et al. 2012). B. velezensis LPL061 was grown in previously optimized EPS-producing medium containing 22-g/L sucrose (AoBoxing, Beijing, China) and 18.4-g/L yeast extract (AoBoxing, Beijing, China) (pH 7.0) at 28 °C for 24 h under shaking condition at 220 rpm (Li et al. 2013).
Genome sequencing, assembly, and annotation
Genomic DNA of LPL061 was isolated using the QIAGEN DNA extraction kit (Qiagen, CA, USA) according to manufacturer’s instruction. Genome sequencing was performed by the Illumina Hiseq 2000 platform (GATC Biotech) (2 × 100 bp). After sequencing, the short reads were assembled by SOAPdenovo v2.04 (https://soap.genomics.org.cn). Gaps between scaffolds were closed by polymerase chain reaction (PCR) and Sanger sequencing. Annotation was carried out using Rapid Annotation Subsystem Technology (Arjan et al. 1991; Aziz et al. 2008). The Kyoto Encyclopedia of Genes and Genomes (KEGG) database (Kanehisa et al. 2016), Clusters of Orthologous Groups (COG) (Tatusov et al. 2003) and Pfam (https://pfam.xfam.org/) were used to predict functional genes. The genes related to the synthesis of exopolysaccharide were identified from the genome of LPL061 using BLAST of NCBI (https://blast.ncbi.nlm.nih.gov/Blast.cgi).
Production, isolation, and purification of the EPS
The EPSs were isolated and purified using our previous method with slight modifications (Li et al. 2013; Xu et al. 2011). In brief, the fermentation culture was centrifuged for 10 min at 10,000 rpm to remove the cell pellets. After that, the cell-free supernatant was mixed with three times volume of 95% ethanol at 4 °C for overnight and then centrifuged for 10 min at 10,000 rpm. The precipitation was collected and dissolved in deionized water (50%, w/v), and then dialyzed (Mw cut-off 8000–14,000 Da) at 4 °C for overnight. After that, water was removed by freeze-drying.
The purification and collection conditions of EPS are in accordance with the methods reported in the previous laboratory (Han et al. 2015). After that, water was removed by freeze-drying, and the pure EPS product needed for the experiment was prepared. The carbohydrate content of the fractions was determined with phenol–sulfuric acid method using glucose as the standards (Dubois et al. 1956).
EPS was dissolved into a 0.1-mg/mL solution and deionized water was used as the blank control. UV–Vis spectrophotometer (Uv-1800, Meishida, Shanghai, China) was used to scan the whole wavelength of EPS in the range of 200–580 nm. Detect whether the extracted EPS contains protein (280 nm) and nucleic acid (260 nm).
α-Glycosidase inhibitory activity of EPS
The inhibition rate of α-glucosidase was determined according to Kim et al. (2011). Briefly, 60 μL of PBS, 20 μL of different concentrations (0, 10, 20, 40, 80,100 μg/mL) of EPS, and 20 μL of 0.2 IU/mL α-glucosidase solution (Sigma, MO, USA) was added into 96-well plate and incubated at 37 °C for 10 min. To start the reaction, 20 μL of PNPG solution (2.5 mmol/L) was added. After 10 min, 30 μL of Na2CO3 solution (0.1 mol/L) was added to terminate the reaction. Thereafter, absorbance at 405 nm (A405) was measured by Microplate Reader (Multiscan SK3, Thermo Fisher Scientific, USA) to calculate the inhibition rate of α-glucosidase (R) according to the following formula.
where R represents α-glucosidase inhibitory activity, Ablank represents the absorbance of the control reaction (containing all reagents except the EPS), Ablank control represents the absorbance of treatment without EPS and α-glucosidase, Asample represents the absorbance of the EPS, and Asample control represents the absorbance of the EPS but without α-glucosidase.
Mammalian cell culture
Human hepatoma cell line HepG2 was purchased from the Cell Bank of Chinese Academy of Sciences (Shanghai, China) and cultured in DMEM medium (Gibco, New York, USA) supplemented with 10% of fetal bovine serum (FBS, Every Green, Zhejiang, China) and 1% of penicillin–streptomycin (100 U/mL, Gibco, New York, USA) at 37 °C in a humidified 5% of CO2 incubator (MCO-15AC, SANYO, Japan).
3-(4,5 Dimethylthiazol-2-yl)-2,5-diphenyl-2H-tetrazolium bromide (MTT) assay
The MTT assay was performed according to the method developed by Mosmann (1983). Briefly, 5 × 10³ of HepG2 cells/well were seeded in triplicate in 96-well flat bottom tissue culture plates in the Dulbecco's modified eagle (DMEM) medium for 12 h, and then cells were treated with 100 μL of EPS (10, 20, 40, 80, 100 μg/mL) for 24 h. After that, 15 μL of 3-(4,5 dimethylthiazol-2-yl)-2,5-diphenyl-2H-tetrazolium Bromide (MTT, Beyotime, Shanghai, China) was added to each well and incubated at 37 °C for 4 h. Supernatants were then discarded and cells were washed by phosphate buffer saline (PBS) solution (Gibco, New York, USA) for once. After that, 100 μL of Dimethyl sulfoxide (DMSO, Solebo, Beijing, China) was added to each well to dissolve crystallization precipitation. Absorbance at 490 nm was measured.
Glucose consumption assay
Glucose consumption assay was carried out based on a previous published method with minor modifications (Teng et al. 2016). Specifically, HepG2 cells were seeded into 96-well plates in DMEM supplemented with 10% of FBS and 1% of penicillin–streptomycin for 12 h. Then, the medium was replaced with serum-free high-glucose DMEM with 500 μg/mL of recombinant human insulin (Beyotime, Shanghai, China) and the cells were incubated for 24 h to establish insulin-resistant HepG2 cells. Then different concentrations of EPS (0, 10, 20, 40, 80, 100 μg/mL) or metformin (10 μg/mL) were prepared in DMEM without FBS and 100 μL of each treatment was added into the insulin-resistant cells. After 24 h, the glucose concentrations in the culture supernatant were determined using the Glucose test kit (Beijing Sino-UK Institute of Biological Technology, Beijing, China). Glucose uptake was calculated by subtracting the glucose concentration of control groups from treatment groups. The number of living cells was calculated by MTT method (Zheng et al. 2011) and glucose uptake per cell was calculated.
Determination of intracellular glycogen content
Intracellular glycogen concentration was measured using a Glycogen Assay Kit (Solebo Biology Co., Ltd., Beijing, China), according to the manufacturer’s instructions with some modifications. Cells were seeded in six-well plates (1 × 10⁶ cells/well) in DMEM supplemented with 10% of FBS and 1% of penicillin–streptomycin for 12 h. After that, cells were resuspended in PBS buffer (1 mL/well) on ice, and then boiled for 15 min to inactivate enzymes, followed by centrifugation at 2000 rpm for 15 min. The supernatants were collected and assayed for glycogen concentration.
Real-time quantitative PCR (RT-qPCR) analysis
After treated with different concentrations of (0, 10, 40, 80 μg/mL) EPS for 24 h, insulin-resistant HepG2 cells were washed twice by PBS and then digested by trypsin (Gibco, New York, USA). Digested cells were centrifuged at 1000 rpm for 5 min to collect the pellets.
The total RNAs of different samples were isolated using the Trizol reagent (Invitrogen, New York, USA) and first-strand cDNA was reverse transcribed at 37 °C for 1 h, 95 °C for 5 min and 4 °C for 5 min using PrimeScript 1st strand cDNA Synthesis Kit (Takara, Kyoto, Japan). RT-qPCR was performed using the 7500 Fast Real-Time PCR system (Applied Biosystems) with SYBR FAST qPCR Kit (Kapa Biosystems, New York, USA). The β-actin was used as a reference gene and the qRT-PCR data were analyzed by the 2–ΔΔCT method (Livak and Schmittgen 2001). Table 1 listed the gene-specific primer sequences.
Table 1.
The primers used in real-time PCR
| Genes | Gene-specific primer sequences (5′ → 3′) |
|---|---|
| β-actin | F: TCAGGTCATCACTATCGGCAAT |
| R: AAAGAAAGGGTGTAAAACGCA | |
| G6Pase | F: GTCCACAITGACACCACACC |
| R: GAGCCACTTGCTGAGTTTCC | |
| PEPCK | F: AACCCTGAGAACGGCTTCTT |
| R: TGGTCTCAGCCACATTGGTA | |
| GSK(3)β | F: AGGAGAACCCAATGTTTCGTAT |
| R: ATCCCCTGGAAATATTGGTTGT | |
| GS | F:AGACCCCAACAAACTGGTCC |
| R: CAACCAAAAGGGTGCCCATC |
Statistical analysis
All biochemical and cell culture assays were performed with at least three independent repeats for each experiment. Statistical analysis of differences between groups was carried out by Student’s t test or by one-way ANOVA followed by Duncan’s test procedures using GraphPad Prism V 5.01 (GraphPad Software Inc, San Diego, CA, USA). p < 0.05 indicates statistically significant. Data were presented as means ± standard deviation of the independent repeats in each experiment.
Results and discussion
Genome features of strain LPL061
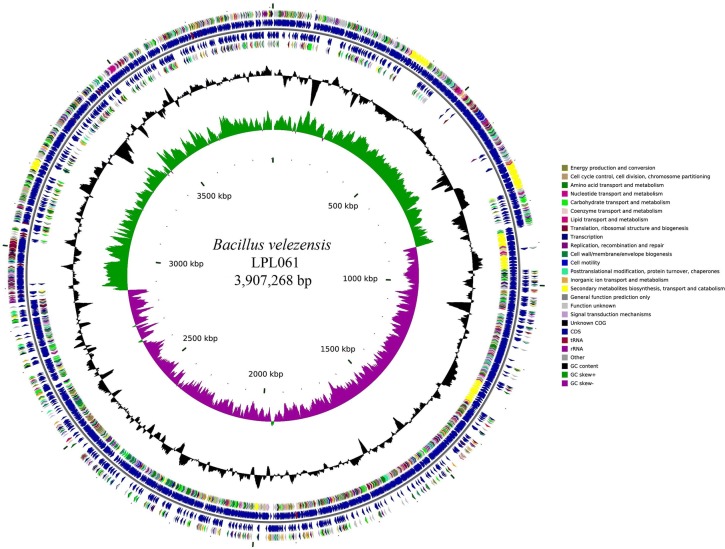
The complete genome of LPL061 contained one gapless circular chromosome of 3,907,268 bp and no plasmid, with G+C content of 46.7%. 3737 protein-coding sequences, 26 rRNA, and 89 tRNA were found in the chromosome of LPL061 (Table 2; Fig. 1). Phylogenetic analysis of LPL061 genomes showed that strain LPL061 presented approximately 100% sequence similarity to B. velezensis (Fig. S1).
Table 2.
Features of Bacillus velezensis LPL061 genome
| Attributes | Chromosome |
|---|---|
| Genome size (bp) | 3,907,268 |
| GC content (%) | 46.7% |
| rRNAs (5S, 16S, 23S) | 26 |
| tRNAs | 89 |
| Coding proteins | 3737 |
Fig. 1.
Circular genome map of Bacillus velezensis LPL061. The orientation of circles is shown from the inner to outer. Ring 1 represents the GC skew (green, positive skew; purple, negative skew). Ring 2 represents the G + C content. Ring 4 represents reverse CDSs and ring 3 represents reverse COG Annotated coding sequences. Ring 5 represents forward CDSs. Ring 6 represents forward COG Annotated coding sequences. Very short features were enlarged to enhance visibility. Clustered genes, such as several rRNA genes, may appear as one line due to space limitation. The image was created using the software cgview
According to the Cluster of Orthologous Groups (COG) of protein designation (Tatusov et al. 2003), all the identified genes were classified into 19 functional categories (Table 3). In addition, 2.54% of the genome of LPL061 (class Q) was involved in the secondary metabolite synthesis, transportation, and decomposition which suggests that EPS biosynthetic pathways could be present in LPL061.
Table 3.
COG categories of Bacillus velezensis LPL061
| COG class | Name | Count | Proportion (%) |
|---|---|---|---|
| C | Energy production and conversion | 180 | 5.45 |
| D | Cell cycle control, cell division, chromosome partitioning | 32 | 0.97 |
| E | Amino acid transport and metabolism | 268 | 8.11 |
| F | Nucleotide transport and metabolism | 78 | 2.36 |
| G | Carbohydrate transport and metabolism | 226 | 6.84 |
| H | Coenzyme transport and metabolism | 114 | 3.45 |
| I | Lipid transport and metabolism | 90 | 2.72 |
| J | Translation, ribosomal structure and biogenesis | 165 | 5.00 |
| K | Transcription | 261 | 7.90 |
| L | Replication, recombination and repair | 135 | 4.09 |
| M | Cell wall/membrane/envelope biogenesis | 203 | 6.15 |
| N | Cell motility | 34 | 1.03 |
| O | Posttranslational modification, protein turnover, chaperones | 97 | 2.94 |
| P | Inorganic ion transport and metabolism | 181 | 5.48 |
| Q | Secondary metabolites biosynthesis, transport and catabolism | 84 | 2.54 |
| S | Function unknown | 921 | 27.89 |
| T | Signal transduction mechanisms | 136 | 4.12 |
| U | Intracellular trafficking, secretion, and vesicular transport | 33 | 1.00 |
| V | Defense mechanisms | 65 | 1.97 |
The biosynthesis of EPS in B. velezensis
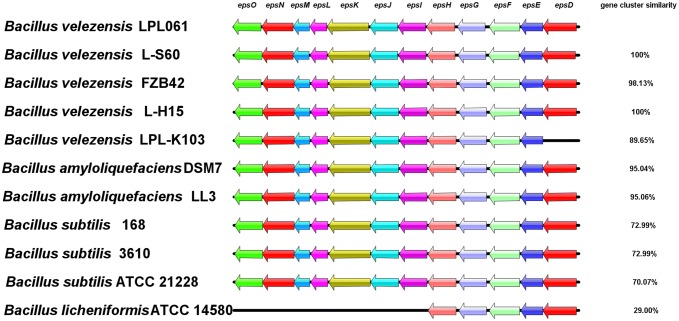
The genome analysis results revealed that the genome of B. velezensis LPL061 contained the complete EPS biosynthetic gene cluster as shown in Fig. 2. 12 eps genes (epsD, epsE, epsF, epsG, epsH, epsI, epsJ, epsK, epsL, epsN, epsM and epsO) encode putative glycosyltransferases, presumably for EPS biosynthesis (Table 3).
Fig. 2.
Analysis and comparison of exopolysaccharide biosynthetic gene clusters among different Bacillus species
Among those genes, the epsE gene encodes a membrane-associated priming glycosyltransferase and it does not catalyze glycosidic linkage but transfers sugar-1-phosphate to the undecaprenyl-phosphate-lipid carrier on the cytoplasmic face of the membrane (Blair et al. 2008; Charnock and Davies 1999). epsF, epsG, epsH, epsI, epsJ and epsK may transfer a variety of nucleotide sugars. Moreover, the genes epsC, epsI, epsO, acyltransferase gene epsM, and aminotransferase gene epsN are all involved in the modification of polysaccharide repeating units (Chen et al. 2006).
The comparative analysis results of EPS biosynthesis gene clusters among different species revealed that the synthesis of EPS in Bacillus was relatively conserved. The whole genome of B. amyloliquefaciens LL3 strain (Geng et al. 2011) and B. velezensis L-S60 (Qin et al. 2015) has been sequenced and the clusters have been found related to the synthesis of polysaccharide. Meanwhile, EPS biosynthetic gene cluster of LPL061 was compared with that of the other four bacteria. The analysis revealed that the EPS biosynthetic gene cluster in LPL061 was 100% and 95% similar to that of B. velezensis L-S60 and B. amyloliquefaciens LL3, respectively. The similarity of the gene cluster with other strains such as B. velezensis FZB42, B. velezensis L-H15, B. velezensis LPL-K103, B. amyloliquefaciens DSM7, B. subtilis 168, B. subtilis 3610, and B. subtilis ATCC 21228 was 98.13%, 100%, 89.65%, 95.04%, 72.99%, 72.99%, and 70.07%, respectively. The similarity of EPS biosynthesis gene clusters between LPL061 and B. licheniformis ATCC 14580 (Rey et al. 2004; Veith et al. 2004) was poor, only 29.00% and this is consistent with the fact that ATCC 14,580 does not secrete polysaccharide bioflocculant into EPS-producing medium (Fig. 2).
Isolation, purification, and quantification of EPS
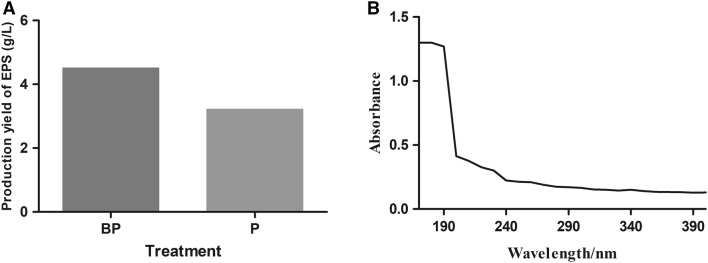
The yield of EPS before and after purification was determined by phenol–sulfuric acid method. The results showed that the yield of EPS was 4.51 g/L before purification and 3.22 g/L after purification (Fig. 3a).
Fig. 3.
Purification, and quantification of exopolysaccharides (EPS) of Bacillus velezensis LPL061. a The yield of EPS before and after purification was determined by phenol–sulfuric acid method. b Ultraviolet spectra of exopolysaccharides (EPS) of Bacillus velezensis LPL061. EPS was prepared at 0.1 mg/mL in deionized water and deionized water was used as the blank control. UV–Vis spectrophotometer was used to scan the whole wavelength of EPS in the range of 200–580 nm. The absorption peaks of protein (280 nm) and nucleic acid (260 nm) were measured. BP the yield of EPS before purification, P the yield of EPS after purification
To further prove whether the prepared EPS component contains nucleic acid and protein, it is scanned with full-wavelength UV, and the scanning results are shown in Fig. 3b. The results of UV full-wavelength scanning showed that EPS had no absorption peak at 260 nm and 280 nm, indicating that purified EPS did not contain nucleic acid or protein.
Inhibition of α-glucosidase by polysaccharides
The inhibitory activity of polysaccharides on α-glucosidase is shown in Fig. 4. EPS showed a dose-dependent effect on inhibiting a-glucosidase. The highest concentration of EPS showed more than 60% of inhibition rate.
Fig. 4.
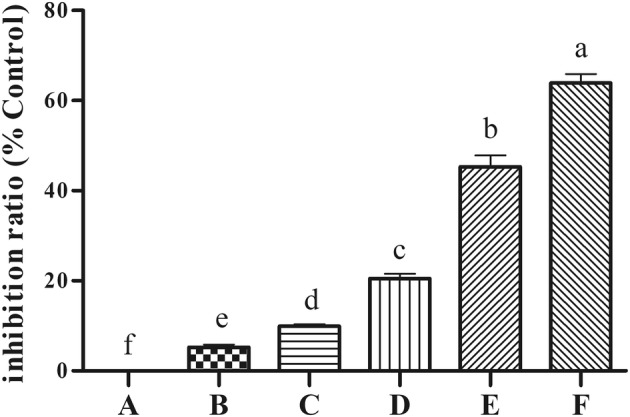
Inhibitory activities of exopolysaccharides (EPS) of Bacillus velezensis LPL061 against α-amylase. Values were expressed as the mean ± SD. n = 3 for each group. P < 0.05 compared with the model group. Mean values with different superscript letters are significantly different (P < 0.05). A: blank control without insulin and EPS treatment; B–F: cells treated with insulin and different concentrations of EPS (10, 20, 40, 80, 100 μg/mL) treatment
Influence of EPS on cell viability in HepG2 cells
As shown in Fig. 5a, the cell viability showed no significant difference (P > 0.05) between normal HepG2 cells and cells treated with EPS at 10, 20, 40 or 80 μg/mL, but the viability of HepG2 cells treated with 100 μg/mL EPS was significantly decreased by 19.3% (P < 0.05) which indicates that EPS concentrations lower than 100 μg/mL were not toxic to HepG2 cells and can be used for following experiments.
Fig. 5.
Effect of EPS on glucose uptake in insulin-resistance HepG2 cells. a Effect of EPS on the cell viability in HepG2 cells, b effects of EPS on glucose consumption in Insulin-resistant HepG2 cells. Values were expressed as the mean ± SD. n = 3 for each group. P < 0.05 indicates significant different when compared with the model group. I insulin-resistant model with insulin (500 μg/mL), without EPS treatment; M insulin-resistant model with insulin and metformin (10 μg/mL) without EPS treatment; A: blank control without insulin and EPS treatment; B–F: cells treated with insulin and different concentrations of EPS (10, 20, 40, 80, 100 μg/mL)
EPS increased glucose uptake of insulin-resistant HepG2 cells
To establish the insulin resistance model, HepG2 cells were treated with a wide range of insulin (5 to 5 × 10⁴ μg/mL) for 24 h. To understand the potential roles of EPS on glucose uptake in high glucose-induced insulin-resistant HepG2 cells, the cellular glucose uptake was determined using the Glucose test kit. As shown in Fig. 5b, compared with the control group, high glucose stimulation significantly decreased the cellular glucose uptake (P < 0.05). This reduced glucose uptake was reversed by EPS treatment. Moreover, the MTT assay showed that EPS concentrations used in this assay were not toxic (Fig. 5a). These results indicated that EPS could increase glucose uptake in insulin-resistant HepG2 cells. The stimulatory effect of 100 μg/mL of EPS (5.078/cells) was significantly higher than that of Met controls (4.478/cells). Previously published studies have reported that probiotics and their metabolites could effectively ameliorate glucose and lipid metabolism disorders (Park et al. 2015; Yadav et al. 2008). Our results indicate that EPS from Bacillus also can effectively regulate glucose metabolism.
EPS down-regulates expression of key gluconeogenic genes in insulin-resistant HepG2 cells
In recent years, the study of liver glycometabolism key genes as a new target of diabetes treatment has attracted much attention (Kurukulasuriya et al. 2003; Bartlett et al. 2014); liver is the most important organ of glucose metabolism, which can regulate the balance of blood glucose through glycolysis, gluconeogenesis, and glycogen synthesis (Postic et al. 2004). Gluconeogenesis refers to the synthesis of glucose from the precursor of non-sugar substances such as oxaloacetic acid. Phosphoenolpyruvate carboxykinase (PEPCK) and 6-phosphoglucokinase (G6Pase) are the rate-limiting enzymes in the process of gluconeogenesis. Their expression levels determine the speed of gluconeogenesis which is key to the pathogenesis of diabetes (Lochhead et al. 2000).
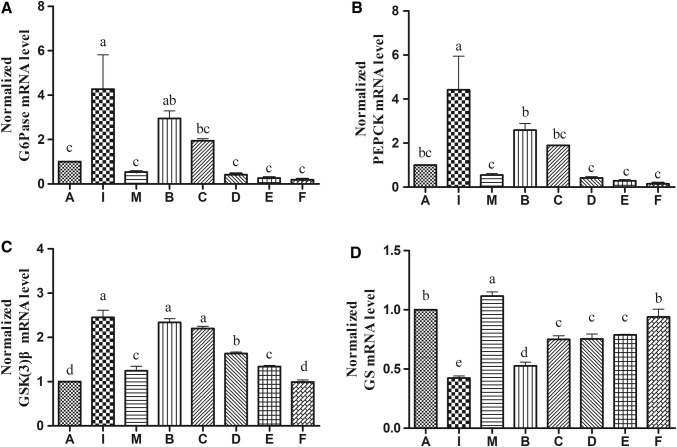
To investigate the impacts of EPS on gluconeogenesis in insulin-resistant HepG2 cells, the expression of genes encoding key enzymes involved in gluconeogenesis was assayed on the transcriptional level. As shown in Fig. 6a, b, compared to insulin-resistant model with insulin (500 μg/mL), without EPS treatment group (I), when cells were treated with high concentration of EPS (100 μg/mL), the expression level of glucose-6-phosphatase (G6Pase) was decreased from 4.272 to 0.1929, and phosphoenolpyruvate carboxykinase (PEPCK) was decreased from 4.425 to 0.1587 (P < 0.05). It indicates that EPS inhibit gluconeogenesis.
Fig. 6.
Effect of EPS treatment on expressions of G6Pase, PEPCK, GSK3, and GS in insulin-resistant HepG2 cells. Cells were cultured in DMEM medium with 500 μg/mL insulin for 24 h and subsequently treated with different concentrations of EPS (0, 10, 20, 40, 80 and 100 μg/mL) for 24 h. The expressions of G6Pase (a), PEPCK (b), GSK(3)β (c) and GS (d) were determined by qRT-PCR. Values are means ± SD from three biological replicates. P < 0.05 indicates significant different when compared with model group. I insulin-resistant model with insulin (500 μg/mL), without EPS treatment; M insulin-resistant model with insulin and metformin (10 μg/mL) without EPS treatment; A: blank control without insulin and EPS treatment; B–F: cells with insulin and different concentrations of EPS (10, 20, 40, 80, 100 μg/mL)
EPS regulates the transcription level of key genes in glycogen synthesis and increases intracellular glycogen in insulin-resistant HepG2 cells
The expression of glycogen synthase kinase gene GSK(3)β and glycogen synthetic gene (GS) was measured by qRT-PCR in EPS-treated insulin-resistant HepG2 cells. As shown in Fig. 6c, d, compared with control group (A), the expression of GSK(3)β gene was 2.45-fold higher in the high glucose-induced insulin resistance HepG2 cells model, suggesting that enhanced GSK(3)β activity could inhibit glycogen synthesis. After treatment with high concentration of EPS (100 μg/mL), the expression of GSK(3)β decreased significantly (0.993), which was close to the level found in the control group. On the other hand, the expression of GS was increased by the EPS treatment in a concentration-dependent manner.
Measurement of the intracellular glycogen concentration. The results showed that the EPS increased intracellular glycogen concentration from 28.30 to 86.48% (Fig. 7) in insulin-resistant HepG2 cells after EPS treatment. Previous studies have found that hepatocytes in insulin-resistant states show impaired glucose utilization (Yin et al. 2008), which is related to changes in glucose metabolism, including glucose uptake, glycogen synthesis, and gluconeogenesis (Yang et al. 2019). Increased expression of key genes PEPCK and G6Pase on the transcription level can upregulate gluconeogenesis (Rui 2014) when insulin resistance occurs. In addition, in the insulin resistance model, GSK(3)β, the key enzyme that inhibits glycogen synthesis, is activated in the liver of insulin resistance, and GSK(3)β gene expression is up-regulated, which leads to the loss of GS activity and down-regulation of gene expression level; then, it led to the obstruction of glycogen synthesis. Therefore, inhibition of GSK(3)β expression has been proposed as a novel therapeutic target for type 2 diabetes by improving insulin resistance in muscle and/or liver (Kim et al. 2015). Taken together, down-regulation of GSK(3)β gene expression can lead to the increase of GS transcription level, thus promoting glycogen synthesis.
Fig. 7.
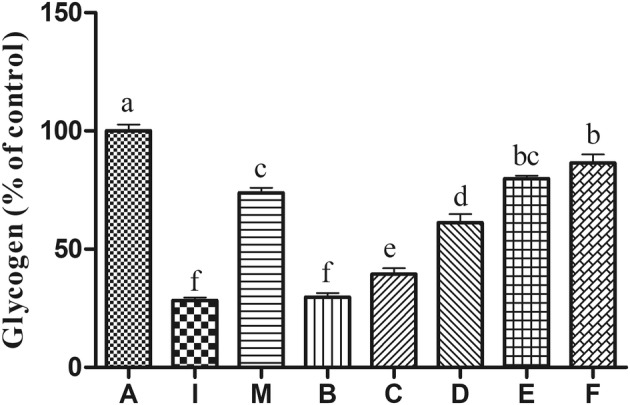
Effect of EPS treatment on the levels of intracellular glycogen in insulin-resistant HepG2 cells. Values are expressed as means ± SD from three biological replicates. P < 0.05 indicates significant different when compared with model group. I insulin-resistant model with insulin (500 μg/mL), without EPS treatment; M insulin-resistant model with insulin and metformin (10 μg/mL) without EPS treatment; A: blank control without insulin and EPS treatment; B–F: cells with insulin and different concentrations of EPS (10, 20, 40, 80, 100 μg/mL)
In this study, the treatment of EPS improved the glucose uptake of insulin-resistant HepG2 cells, and inhibited the expression of PEPCK and G6Pase, which indicated that EPS produced by LPL061 can inhibit gluconeogenesis of insulin-resistant hepatocytes. Meanwhile, EPS could promote glycogen production by decreasing the expression level of GSK(3)β. These results showed that EPS can improve abnormal glucose metabolism in insulin-resistant HepG2 cells by promoting glycogen synthesis and inhibiting gluconeogenesis.
Conclusions
The complete genome sequence of LPL061 facilitates our understanding of the Bacillus EPS biosynthesis. Further bioactivity experiments showed that EPS could reduce the glucose level by inhibiting the activity of α-glycosidase and promoting glucose consumption. Overall, this study provides new insights into the potential of secondary metabolites biosynthesis in B. velezensis, the physiological activity of EPS, and its hypoglycemic mechanism.
Electronic supplementary material
Below is the link to the electronic supplementary material.
Author contributions
RYW and PLL designed the experiments. RYW performed the experiments. RYW, YXQ and QS analyzed the results and wrote the manuscript. All authors read and approved the final manuscript.
Funding
This project was funded by the National Natural Science Foundation of China (Nos. 31671831 and 31271827), Beijing Innovation Team Project of Sturgeon and Trout (BAIC08-2020).
Data availability
The complete genome sequence of B. velezensis LPL061 was deposited at GenBank under the accession number of CP042271. This strain has been deposited in China Center of Industrial Culture Collection under the accession number of CICC NO. 24192. The community metadata standards the “Minimal Information about any (X) Sequence” (MixS) was shown in Table S1.
Compliance with ethical standards
Conflict of interest
The authors declare that they have no conflict of interest.
References
- Arjan A, Nennie E, Ossenkoppele GJ, et al. Cell mediated cytotoxicity against U937 cells by human monocytes and macrophages in a modified colorimetric MTT assay. A methodological study. J Immunol Methods. 1991;141(1):15–22. doi: 10.1016/0022-1759(91)90205-T. [DOI] [PubMed] [Google Scholar]
- Aziz RK, Bartels D, Best AA, et al. The RAST Server: rapid annotations using subsystems technology. BMC Genomics. 2008;9:75. doi: 10.1186/1471-2164-9-75. [DOI] [PMC free article] [PubMed] [Google Scholar]
- Bajpai VK, Rather IA, Park YH. Partially purified exo-polysaccharide from Lactobacillus Sakei Probio 65 with antioxidant, α-glucosidase and tyrosinase inhibitory potential. J Food Biochem. 2016;40(3):264–274. doi: 10.1111/jfbc.12230. [DOI] [Google Scholar]
- Bartlett PJ, Gaspers LD, Pierobon N, et al. Calcium-dependent regulation of glucose homeostasis in the liver. Cell Calcium. 2014;55:306–316. doi: 10.1016/j.ceca.2014.02.007. [DOI] [PubMed] [Google Scholar]
- Blair KM, Turner L, Winkelman JT, et al. A molecular clutch disables flagella in the Bacillus subtilis biofilm. Science. 2008;320:1636–1638. doi: 10.1126/science.1157877. [DOI] [PubMed] [Google Scholar]
- Charnock SJ, Davies GJ. Structure of the nucleotide-diphospho-sugar transferase, SspA from Bacillus subtilis, in native and nucleotide-complexed forms. Biochemistry. 1999;38:6380–6385. doi: 10.1021/bi990270y. [DOI] [PubMed] [Google Scholar]
- Chen Z, Liu P, Li ZP, et al. Identification of key genes involved in polysaccharide bioflocculant synthesis in Bacillus licheniformis. Biotechnol Bioeng. 2006;11(3):645–655. doi: 10.1002/bit.26189. [DOI] [PubMed] [Google Scholar]
- Dubois M, Gilles KA, Hamilton JK, et al. Colorimetric method for determination of sugars and related substances. Anal Chem. 1956;28:350–356. doi: 10.1021/ac60111a017. [DOI] [Google Scholar]
- Emanuele Z, Deborah MW, Aidan C, et al. Production, properties, and industrial food application of lactic acid bacteria-derived exopolysaccharides. Appl Microbiol Biotechnol. 2016;100:1121–1135. doi: 10.1007/s00253-015-7172-2. [DOI] [PubMed] [Google Scholar]
- Geng WT, Cao MF, Song CJ, et al. Complete genome sequence of Bacillus amyloliquefaciens LL3, which exhibits glutamic acid-independent production of poly-γ-glutamic acid. J Bacteriol. 2011;193:3393–3394. doi: 10.1128/JB.05058-11. [DOI] [PMC free article] [PubMed] [Google Scholar]
- Guo CR, Zhang CF, Li L, et al. Hypoglycemic and hypolipidemic effects of oxymatrine in high-fat diet and streptozotocin-induced diabetic rats. Phytomedicine. 2014;21(6):807–814. doi: 10.1016/j.phymed.2014.02.007. [DOI] [PubMed] [Google Scholar]
- Han YZ, Liu E, Liu LS, et al. Rheological, emulsifying and thermostability properties of two exopolysaccharides produced by Bacillus amyloliquefaciens LPL061. Carbohyd Polym. 2015;115:230–237. doi: 10.1016/j.carbpol.2014.08.044. [DOI] [PubMed] [Google Scholar]
- Kanehisa M, Sato Y, Kawashima M, et al. KEGG as a reference resource for gene and protein annotation. Nucleic Acids Res. 2016;44:457–462. doi: 10.1093/nar/gkv1070. [DOI] [PMC free article] [PubMed] [Google Scholar]
- Kim JS, Hyun TK, Kim MJ. The inhibitory effects of ethanol extracts from sorghum, foxtail millet and proso millet on α-glucosidase and α-amylase activities. Food Chem. 2011;124(4):1647–1651. doi: 10.1016/j.foodchem.2010.08.020. [DOI] [Google Scholar]
- Kim KM, Lee K, Lee GY, Jin H. Anti-diabetic efficacy of KICG1338, a novel glycogen synthase kinase-3β inhibitor, and its molecular characterization in animal models of type 2 diabetes and insulin resistance. Mol Cell Endocrinol. 2015;409:1–10. doi: 10.1016/j.mce.2015.03.011. [DOI] [PubMed] [Google Scholar]
- Kurukulasuriya R, Link JT, Madar DJ. Potential drug targets and progress towards pharmacologic inhibit ion of hepatic glucose production. Curr Med Chem. 2003;10(2):123–125. doi: 10.2174/0929867033368556. [DOI] [PubMed] [Google Scholar]
- Li Y, Zhang C, Fan Y, Liu L, Li P, Han Y. Optimization of fermentation conditions for exopolysaccharide production by Bacillus amyloliquefaciens LPL061. Food Science. 2013;34(07):185–189. [Google Scholar]
- Liu CF, Tseng KC, Chiang SS, Lee BH. Immunomodulatory and antioxidant potential of Lactobacillus exopolysaccharides. J Sci Food Agric. 2011;91:2284–2291. doi: 10.1002/jsfa.4456. [DOI] [PubMed] [Google Scholar]
- Livak KJ, Schmittgen TD. Analysis of relative gene expression data using real-time quantitative PCR and the 2−ΔΔCT method. Methods. 2001;25:402–408. doi: 10.1006/meth.2001.1262. [DOI] [PubMed] [Google Scholar]
- Lochhead PA, Salt IP, Walker KS. 5-aminoimidazole-4-carboxamide riboside mimics the effects of insulin on the expression of the 2 key gluconeogenic genes PEPCK and glucose-6-phosphatase. Diabetes. 2000;49(6):896–903. doi: 10.2337/diabetes.49.6.896. [DOI] [PubMed] [Google Scholar]
- Mosmann T. Rapid colorimetric assay for cellular growth and survival: application to proliferation and cytotoxicity assays. J Immunol Methods. 1983;65:55–63. doi: 10.1016/0022-1759(83)90303-4. [DOI] [PubMed] [Google Scholar]
- Park KY, Kim B, Hyun CK. Lactobacillus rhamnosus GG improves glucose tolerance through alleviating ER stress and suppressing macrophage activation in db/db mice. J Clin Biochem Nutr. 2015;56:240–246. doi: 10.3164/jcbn.14-116. [DOI] [PMC free article] [PubMed] [Google Scholar]
- Postic C, Dentin R, Girard J. Role of the liver in the control of carbohydrate and lipid homeostasis. Diabetes Metab. 2004;30(5):398–408. doi: 10.1016/s1262-3636(07)70133-7. [DOI] [PubMed] [Google Scholar]
- Qin Y, Han Y, Yu Y, et al. Complete genome sequence of Bacillus amyloliquefaciens L-S60, a plant growth-promoting and antifungal bacterium. J Biotechnol. 2015;212:67–68. doi: 10.1016/j.jbiotec.2015.08.008. [DOI] [PubMed] [Google Scholar]
- Rangika BS, Dayananda PD, Peiris DC. Hypoglycemic and hypolipidemic activities of aqueous extract of flowers from Nycantus arbortristis L. in male mice. BMC Complement Med Ther. 2015;15(1):289. doi: 10.1186/s12906-015-0807-0. [DOI] [PMC free article] [PubMed] [Google Scholar]
- Rey MW, Ramaiya P, Nelson BA, et al. Complete genome sequence of the industrial bacterium Bacillus licheniformis and comparisons with closely related Bacillus species. Genome Biol. 2004;5(10):r77. doi: 10.1186/gb-2004-5-10-r77. [DOI] [PMC free article] [PubMed] [Google Scholar]
- Rui LY. Energy metabolism in the liver. Compr Physiol. 2014;4(1):177–197. doi: 10.1002/cphy.c130024. [DOI] [PMC free article] [PubMed] [Google Scholar]
- Tatusov RL, Fedorova ND, Jackson JD, et al. The COG database: an updated version includes eukaryotes. BMC Bioinform. 2003;4:41. doi: 10.1186/1471-2105-4-41. [DOI] [PMC free article] [PubMed] [Google Scholar]
- Teng H, Chen L, Song H. The potential beneficial effects of phenolic compounds isolated from A. pilosa Ledeb on insulin-resistant hepatic HepG2 cells. Food Funct. 2016;7(10):4400–4409. doi: 10.1039/C5FO01067E. [DOI] [PubMed] [Google Scholar]
- Veith B, Herzberg C, Steckel S, et al. The complete genome sequence of Bacillus licheniformis DSM13, an organism with great industrial potential. J Mol Microbiol Biotechnol. 2004;7(4):204–211. doi: 10.1159/000079829. [DOI] [PubMed] [Google Scholar]
- Xu R, Shen Q, Ding X, et al. Chemical characterization and antioxidant activity of an exopolysaccharide fraction isolated from Bifidobacterium animalis RH. Eur Food Res Technol. 2011;232(2):231–240. doi: 10.1007/s00217-010-1382-8. [DOI] [Google Scholar]
- Yadav H, Jain S, Sinha PR. Oral administration of dahi containing probiotic Lactobacillusacidophilus and Lactobacilluscasei delayed the progression of streptozotocin-induced diabetes in rats. J Dairy Res. 2008;75:189–195. doi: 10.1017/50022029908003129. [DOI] [PubMed] [Google Scholar]
- Yang ZC, Huang W, Zhang JS, et al. Baicalein improves glucose metabolism in insulin resistant HepG2 cells. Eur J Pharmacol. 2019;854:187–193. doi: 10.1016/j.ejphar.2019.04.005. [DOI] [PubMed] [Google Scholar]
- Yin J, Gao Z, Liu D, Liu Z. Berberine improves glucose metabolism through induction of glycolysis. Am J Physiol Endocrinol Metab. 2008;294:148–156. doi: 10.1152/ajpendo.00211.2007. [DOI] [PMC free article] [PubMed] [Google Scholar]
- Yu R, Zuo FL, Ma HQ, Chen SW. Exopolysaccharide-producing Bifidobacteriumadolescentis strains with similar adhesion property induce differential regulation of inflammatory immune response in Treg/Th17 axis of DSS-colitis mice. Nutrients. 2019;11:782. doi: 10.3390/nu11040782. [DOI] [PMC free article] [PubMed] [Google Scholar]
- Zhang C, Li Y, Fan Y, Liu L, Li PL. Screening and identification of an exopolysaccharide-producing Bacillus sp. China Brew. 2012;31(10):82–85. [Google Scholar]
- Zheng XK, Li YJ, Zhang L, et al. Antihyperglycemic activity of Selaginella tamariscina (Beauv.) Spring. J Ethnopharmacol. 2011;133:531–537. doi: 10.1016/j.jep.2010.10.028. [DOI] [PubMed] [Google Scholar]
Associated Data
This section collects any data citations, data availability statements, or supplementary materials included in this article.
Supplementary Materials
Data Availability Statement
The complete genome sequence of B. velezensis LPL061 was deposited at GenBank under the accession number of CP042271. This strain has been deposited in China Center of Industrial Culture Collection under the accession number of CICC NO. 24192. The community metadata standards the “Minimal Information about any (X) Sequence” (MixS) was shown in Table S1.


