Abstract
Chronic dopamine (DA) monitoring is a critical enabling technology to identify the neural basis of human behavior. Carbon fiber microelectrodes (CFM), the current gold standard electrode for in vivo fast scan cyclic voltammetry (FSCV), rapidly loses sensitivity due to surface fouling during chronic neural testing. Periodic voltage excursions at elevated anodic potentials regenerate fouled CFM surfaces but they also chemically degrade the CFM surfaces. Here, we compare the dimensional stability of 150 μm boron-doped ultrananocrystalline diamond (BDUNCD) microelectrodes in 1X PBS during ‘electrochemical cleaning’ with a similar-sized CFM. Scanning electron microscopy and Raman spectroscopy confirm the exceptional dimensional stability of BDUNCD after 40 h of FSCV cycling (~8 million cycles). The fitting of electrochemical impedance spectroscopy data to an appropriate circuit model shows a 2x increase in charge transfer resistance and an additional RC element, which suggests oxidation of BDUNCD electrode surface. This could have likely increased the DA oxidation potential by ~34% to +308 mV. A 2x increase in BDUNCD grain capacitance and a negligible change in grain boundary impedance suggests regeneration of grains and the exposure of new grain boundaries, respectively. Overall, DA voltammogram signals were reduced by only ~20%. In contrast, the CFM is completely etched with a ~90% reduction in the DA signal using the same cleaning conditions. Thus, BDUNCD provides a robust electrode surface that is amenable to repeated and aggressive cleaning which could be used for chronic DA sensing.
Keywords: diamond, carbon fiber, dopamine, nanocrystalline, microelectrode
1. Introduction
The pioneering work of John Eccles demonstrates the chemical nature of synaptic communication with neurons communicating with each other by secretion of neurochemicals at synapses [1, 2]. These neurochemicals then interact with specific receptors for relaying information to downstream neurons. Thus, it is important to understand the neurochemical dynamics preferably concurrently over the long-term and in real-time at different regions of the brain. Studies have already shown that any abnormal neurochemical signaling will cause brain disorders such as epilepsy, Parkinson’s disease, traumatic brain injury and drug addiction [3, 4]. For example, evidence supports a critical role of levels of extracellular neurochemicals (dopamine DA, glutamate, GABA, adenosine, serotonin) in seizure generation [5, 6]. Hence, to understand the mechanisms underlying brain networks it is imperative to be able to perform chronic measurements of multiple neurochemicals in vivo. Because of the spatiotemporal constraints of existing analytical methodologies (e.g. micro dialysis, radioactive labeling) in the real-time measurement of neurochemicals, which have half-lives of only few seconds, little is known about the in vivo dynamics of these neurochemicals [7, 8].
Electrochemical techniques such as fast scan cyclic voltammetry (FSCV), chronoamperometry (CA) and fixed potential amperometry (FPA) [9, 10] offer a viable means of measuring neurochemicals rapidly with sub-millimeter and sub-second resolution. These methods use carbon fiber microelectrodes (CFM) [11] with sub-micromolar sensitivity. The small size of the CFM (~5–10 μm diameter) affords spatially resolved measurements and limits neural tissue damage [12]. When combined with extended-scan FSCV (>1.0 V), a detection limit of ~ 15 nM is obtained for DA in the brain [13]. Unfortunately, this increased sensitivity is accompanied by electrode surface fouling due to chemical etching [14]. To overcome the diminution of signal and response characteristics with chronic implantation [15], the typical approach is to replace the CFM with another fresh one. Recently, Wightman et al developed an electrochemical procedure that involves the use of periodic triangular voltage excursions with an extended anodic potential (−0.4 V to +1.4 V, 400–2400 V s−1) [14, 15]. This procedure restores electrode sensitivity by regenerating the carbon surface through oxidative etching. However, such repeated voltammetric sweeps at higher potentials causes a significant loss of electrode surface (and material) due to this two-step process—forming carboxylic groups and further oxidizing the surface to carbon dioxide by Kolbe-like electrolysis. Thus, the CFM surface microstructure and chemistry is irreversibly damaged and is completely etched in a few hours. Also, it is not desirable to apply high anodic potentials in vivo on such sp2 carbon materials, which can generate reactive oxygen species and thus generate oxidized toxins in the brain environment, a rich research topic that warrants further detailed studies.
Emerging carbon nanomaterials—nanotubes [16], nanofibers [17] and nanocrystalline diamond [18–22], have spurred renewed interest in investigating new electrode material technology that could offer electrode surfaces that are highly resistive to chemical etching and fouling due to DA oxidation products such as melanin [14]. We studied conductive boron-doped ultrananocrystalline diamond (BDUNCD) as a potential chemical sensing electrode due to its excellent chemical, electrochemical and bio compatibility as a next generation microsensor material for chronic DA detection. BDUNCD films with 2–5 nm diamond grains and ultra-smooth surfaces (3–5 nm rms) [23, 24] have recently been used to electrochemically generate advanced oxidants, including hydroxyl radicals for water treatment and a myriad of other sensing and non-sensing applications [25–28]. This material demonstrates superior dimensional stability at higher current densities (>300 mA cm−2) for 100’s of hours [23]. In this article, the effect of extended CV-scan based electrochemical cleaning on 150 μm diameter BDUNCD microelectrodes is studied in direct comparison to the CFM. Variations in the surface morphology and diamond film quality are monitored using scanning electron microscopy (SEM) and Raman spectroscopy. Electrochemical behavior at different times during FSCV cleaning cycles (0–40 h) in 1X PBS (−0.6 to +1.4 V, 400 V s−1, 60 Hz) is studied using 100 μM DA 1X PBS and 5 mM Fe(CN)63−/4− redox species in 1 M KCl solution using cyclic voltammetry (CV), FSCV and electrochemical impedance spectroscopy (EIS) techniques. DA is chosen for this study because it is a model neurochemical which is important in motor control, motivation and cognition, and has been implicated in various brain disorders [29]. Since, the main goal of this publication is to study the dimensional stability and DA signal stability on BDUNCD microelectrodes, DA peak current signal was monitored (a measure of loss of electrode material and/or loss of electroactive area) and DA oxidation peak potential was observed (a measure of loss of electrode kinetics) during the 40 h cleaning. BDUNCD microelectrode demonstrated excellent dimensional stability with no material loss during the entire cleaning period. This was confirmed by observing a minimal DA signal loss of ~20%. On the contrary, CFM is almost completely etched with a 90% signal loss. The fitting of EIS data collected after a 40 h cleaning suggest BDUNCD surface oxidation, which likely increased the DA oxidation potential. The charge transfer resistance increased by 2x, which could be due to introduction of oxygen groups on the BDUNCD surface. Additionally, the 2x increase in BDUNCD grain capacitance suggests the regeneration of diamond grains and a negligible change in the impedance of grain boundaries suggest the exposure of some new grain boundaries.
2. Experimental
BDUNCD films were grown on commercial-grade 4 inch silicon wafers that were covered with a 1 μm thick thermal SiO2 (Wafer World Inc.). Hot filament chemical vapor deposition technique was employed to grow the BDUNCD films [20, 23]. The UNCD growth process and the subsequent microfabrication of BDUNCD microelectrodes into nine individually addressable disks of 150 μm diameter in a 3 × 3 microelectrode array (MEA) format (figures 1(b)–(d)) is detailed in Siddiqui et al [20]. The surface morphology of the BDUN CD was examined using field-emission scanning electron microscope (FESEM: Hitachi S-4800). In addition, the films were further characterized by Raman spectroscopy (Control Development 2DMPP with λ: 532 nm). All chemicals were reagent grade and purchased from Sigma Aldrich Chemical Co. The chemicals were used as received unless otherwise specified. Deionized (DI) water was prepared using a three-filter purification system from Continental Water Systems (Modulab DI recirculator, service deionization polisher).
Figure 1.

SEM images of (a) a cylindrical CFM (30 μm diameter X 150 μm long), (b) one of the chips showing the nine individually addressable BDUNCD microelectrodes in 3 × 3 array format. (c) An individual 150 μm BDUNCD microelectrode, (d) BDUNCD surface morphology. The scale bars in (a)–(d) are 30, 200, 50 and 0.5 microns, respectively.
The electrochemical experiments with DA were carried out using an Autolab potentiostat (PGSTAT 302N, Metrohm USA) in a two-electrode setup. Platinum coil (Alfa Aesar) served as a counter and reference electrode. The potentiostat was equipped with a Frequency Response Analyzer 2, ECD and Multiplex modules and Nova 1.10.3 software. The 150 μm BDUNCD microelectrode was used as the working electrode. The micro electrodes were loaded in custom Teflon cell that contains a 4 mm diameter O-ring to expose it to the solution. Before the test, the electrical isolation of the pads was checked using a two-point probe multimeter. This avoids the use of microelectrodes that has poor SiO2 passivation for further characterization. All BDUNCD MEAs were briefly sonicated in ethanol for 30s and dried in nitrogen before use. Also, the microelectrodes were pre-cleaned in 0.05 M sulfuric acid (Sigma) by cycling between −0.2 and +0.8 V at a scan rate of 100 mV s−1 for 30 min This ensures a reproducible microelectrode surface free from any surface impurities and a stabilized background (charging) current. CFM, figure 1(a) (SF1A, CenMeT, Kentucky) was briefly soaked in isopropyl alcohol for 20 min and then cycled in 1X PBS for 15 min between −0.4 to +1.0 V at 400 V s−1 for a better and consistent electrochemical response [10, 13, 14]. For electrochemical cleaning, a triangle wave from −0.6 to +1.4 V and back was applied at a rate 400 V s−1, at 60 Hz in 1X PBS buffer. The resting potential between consecutive FSCV cycles was −0.6 V. Each 10 h cleaning cycle consisted of ~2 million cycles. For DA detection, CV and FSCV measurements were collected in 100 μM DA solution prepared in a 1X PBS buffer solution. A triangular wave from −0.2 to +0.8 V and back was applied with respect to a Pt coil at a scan rate of 10 V s−1. FSCV studies were also performed using triangle waveforms from −0.4 to +1.0 V and back at 400 V s−1 at 10 Hz. For DA signal loss calculations, peak current values at an oxidative potential of ~+0.25 V were measured at a scan rate of 10 V s−1. For a scan rate of 400 V s−1, oxidative potentials after background subtraction were shifted to ~+0.6 V. DA measurements were conducted every 10th h for up to 40 h of cleaning, i.e. more than 8 million FSCV cycles in total. The background subtracted FSCV data showed a significant hysteresis during the reverse scan, which distorts the voltammogram. To evaluate the electrochemical behavior of the microelectrode, measurements of the DA oxidation peak current and potential values are required. Since this can be obtained from the forward scan data alone, only the forward scans for both CFM and BDUNCD microelectrodes at higher scan rates are considered. The EIS spectra were recorded between 100 kHz and 100 mHz with a 10 mV ac signal amplitude (rms value) at open circuit potential. Electrochemical measurements of pre- and post-cleaned BDUNCD surfaces were conducted in a 5 mM K4Fe(CN)6/5 mM K3Fe(CN)6 solution prepared in 1 M KCL in three electrode setup. Solutions were freshly prepared on the same day of the experiment. The solution was purged in nitrogen gas for 5 min before use.
3. Results and discussion
DA peak currents from cyclic voltammograms, a chemical signature of CV measurements was monitored at the CFM and BDUNCD microelectrodes (figure 2) at regular time intervals after the electrochemical cleaning in 1X PBS buffer. Neurochemical DA concentration (100 μM in 0.01 M PBS) and CV parameters represents the physiological range of DA and voltage waveforms commonly used for in vivo studies. In addition to the 10 V s−1 scan rate measurements, the microelectrodes were also measured at a scan rate of 400 V s−1. Higher scan rates of several 100 s of V s−1 are used for the FSCV measurements, which is the most widely used in vivo neurochemical measurement method where sub-millisecond temporal resolution is absolutely required. CV theory predicts that peak currents (faradaic response) for a catecholamine such as DA that are subject to diffusion-mediated electron transfer and are adsorbed to the electrode surface scales in proportional to the electrode surface area. Consistent with other studies, CFM microelectrodes showed a decrease in DA signal starting at 10 h of cleaning—the peak signal for the CFM at scan rates of 10 and 400 V s−1, i.e. 306 ± 24% nA and 4326 ± 38% nA, respectively, decreased as compared to the starting point 0th h measurements of 517 ± 14% nA and 10 388 ± 16% nA, respectively (figure 3(a)). The loss in DA signal signifies that the CFM surface experienced severe surface oxidation, which led to chemical etching of surface carbon atoms through Kolbe-like electrolysis. Thus, significant CFM material loss is expected. This material loss was confirmed by observing a steady decrease in the background charging current (Ib) values in 1X PBS buffer (figure 3(c)). In comparison, the BDUNCD microelectrode at 10 and 400 V s−1 generated 28 ± 8% nA and 304 ± 14% nA compared to the starting 0th h data of 39 ± 6% nA and 502 ± 8.3% nA, respectively (figure 3(b)). In the case of BDUNCD, there was also an indication of oxidation but not as severe as that of CFM. After 20 h of cleaning, the signal further decreased to 284 ± 26% nA and 2165 ± 76% nA, respectively. After 40 h of cycling, the CFM was almost etched away (confirmed by SEM images, figure 4(a)) and the peak signal decreased by ~90% at both scan rates (figures 5(a) and 6(a)). Additionally, the electrode kinetics become sluggish, which is based on the increase in anodic peak potential (Ea) values. For example, the Ea increased from 172 ± 18% mV to 341 ± 9% mV and 563 ± 8% to 681 ± 6.3% mV at 10 mV s−1 and 400 V s−1, respectively after 40 h of cleaning (figures 5(c) and 6(c)). In contrast, BDUNCD microelectrodes showed a marginal reduction in DA signal during the 40 h etch process (figures 5(b) and 6(b)). During the first 10 h of cleaning, the DA peak currents decreased by 34 ± 6% of their initial 0th h values for both scan rates. During further cleaning, i.e. after 20 h, the DA peak currents decreased by ~39%. The peak currents recorded were 26 ± 8.4% nA and 270 ± 16% nA for 10 V s−1 and 400 V s−1, respectively. Interestingly, after 30 h of cleaning, the BDUNCD electrode surface showed reactivation with improved electro activity and kinetics. This is confirmed by observing an increase in DA peak currents and decreased anodic peak potentials (figures 5(b), (d) and 6(b), (d)) at both scan rates. At the same time, the Ib values did not show either an increase or a decrease until 30 h. However, the 40 h data showed a significant increase in Ib values with non-rectangular cyclic voltammogram (figure 3(d)), which confirms surface oxidation resulting in the formation of an oxide surface. This was also confirmed by EIS studies (see the following section).
Figure 2.
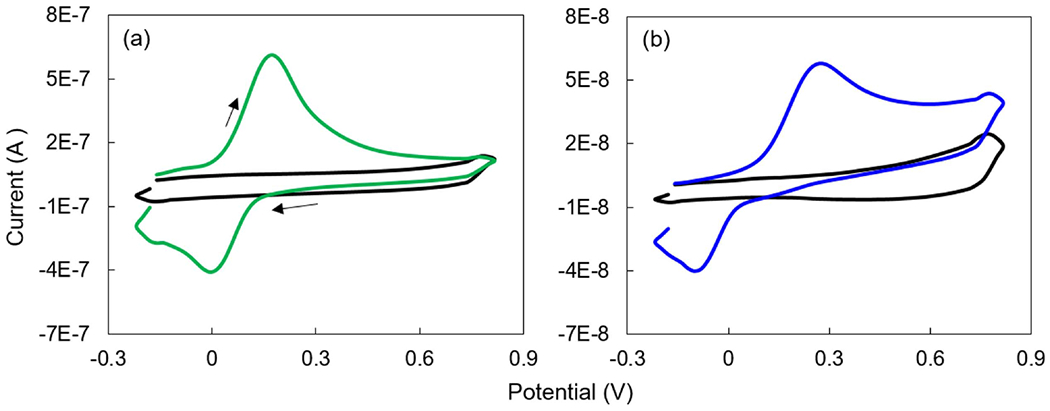
Cyclic voltammograms of (a) CFM (green curve) and (b) 150 μm BDUNCD (blue curve) microelectrodes in 100 μM DA prepared in 1X PBS buffer solution. Background voltammograms (black curves) are taken in 1X PBS buffer. Scan rate is 10 V s−1. The arrows represent the scan direction, i.e. starting at −0.2 V and scanning forward to +0.8 V and back to −0.2 V.
Figure 3.
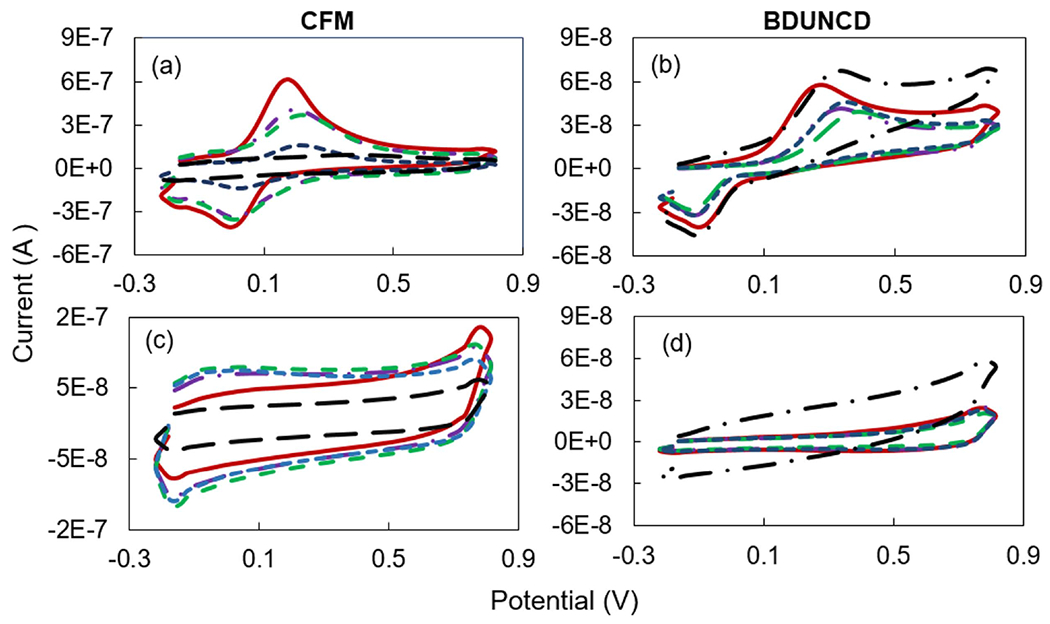
Cyclic voltammograms of CFM (a), (c) and BDUNCD (b), (d) microelectrodes in 100 μM DA (a), (b) and 1X PBS (c), (d) at various electrochemical cleaning times (brown solid curve—0 h, purple dashed dot—10 h, green long dashed—20 h, blue short dashed—30 h and black dot dashed—40 h). Scan rate is 10 V s−1.
Figure 4.
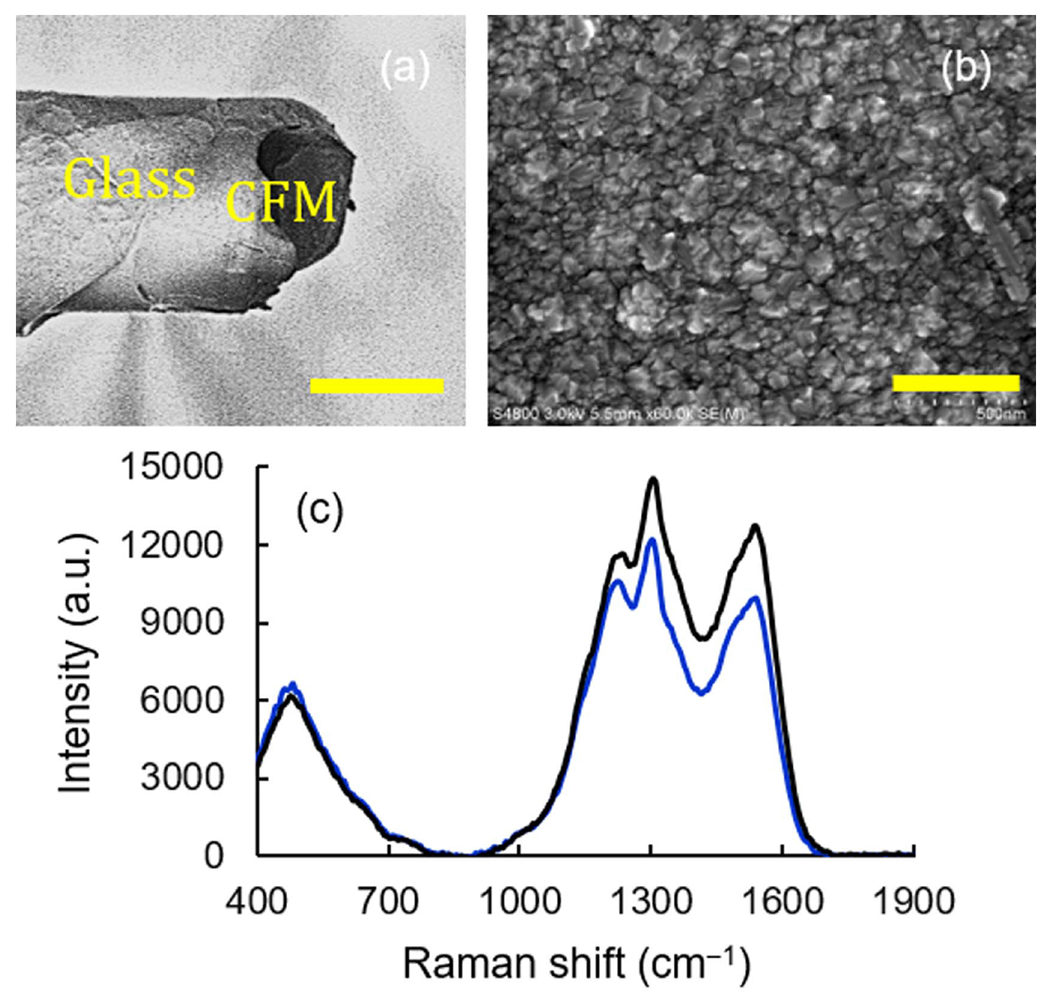
Effect of 40 h of electrochemical cleaning in 1X PBS buffer. SEM images of (a), (b) completely etched-away CFM and BDUNCD microelectrodes. The cleaning was performed by cycling between−0.6 and +1.4 V, 400 V s−1, 60 Hz. The scale bars are 30 and 0.5 microns. (c) Raman spectra of BDUNCD before (black curve) and after (blue curve) cleaning.
Figure 5.
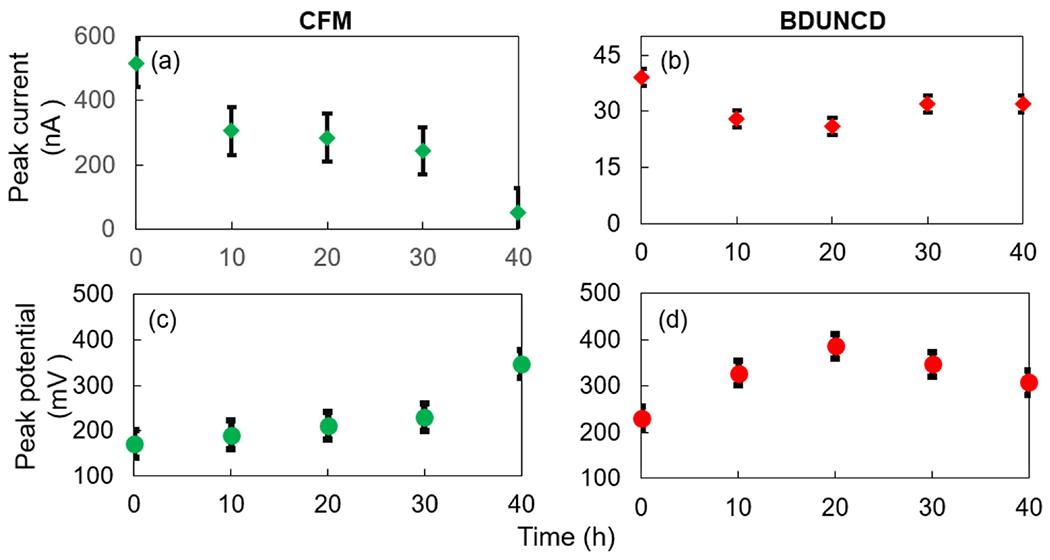
The anodic peak current and potential values of CFM (a), (c) and BDUNCD (b), (d) microelectrodes in 100 μM DA, respectively at various cleaning times (0–40 h). Scan rate is 10 V s−1. T-test was performed with two different scan rate data for anodic peak current and peak voltage values with results p < 0.05 for confidence interval 95%.
Figure 6.
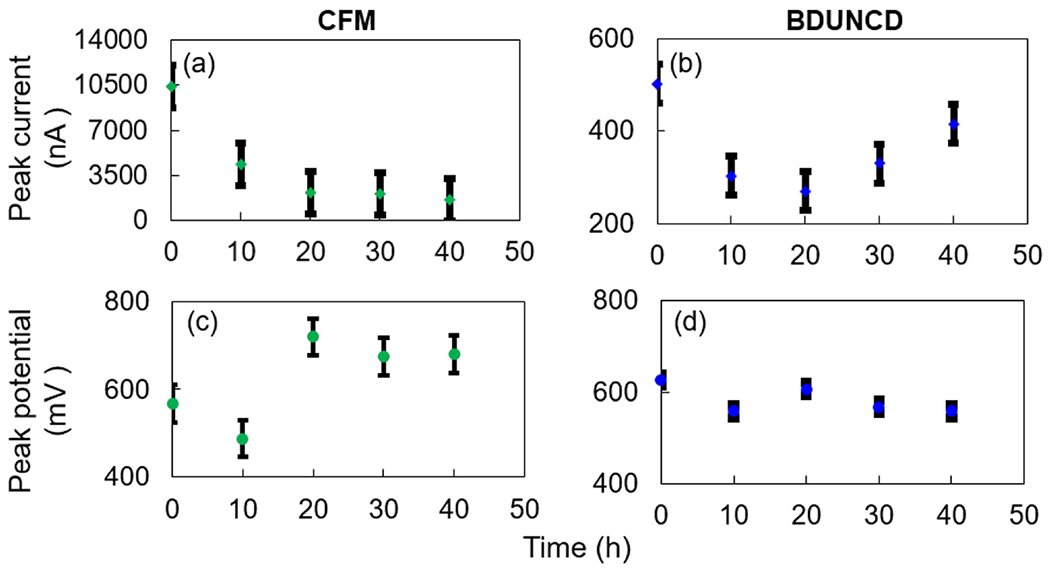
The anodic peak current and potential values of CFM (a), (c) and BDUNCD (b), (d) microelectrodes in 100 μM DA, respectively at various cleaning times (0–40 h). Scan rate is 400 V s−1. T-test was performed with two different scan rate data for anodic peak current and peak voltage values with results p < 0.05 for confidence interval 95%.
SEM and Raman spectroscopy techniques were used to further examine the changes to BDUNCD surface morphology and chemistry. The SEM image showed negligible changes to the diamond grain and grain boundary morphology. Remarkably, there was no electrode material loss even after 40 h of cleaning (figure 4(b)), which demonstrates the superior dimensional stability of BDUCND, primarily due to the strong bonds between sp3 hybridized surface carbon atoms. The Raman spectrum exhibited the characteristic M-shaped signature expected from as-grown BDUNCD films [23] (figure 4(c), black spectrum) with distinct peaks at 1150, 1310–1355, 1470 and 1560 cm−1. The two major peaks at 1310–1355 and 1560 cm−1 represent a broad combination of D-band (disorganized graphite) and the diamond peak at 1332 cm−1 and G-band (crystalline graphite), respectively, which is in agreement with our previous published work [23, 30]. The Raman spectra of BDUNCD after 40 h cleaning showed a similar ‘M’ signature but with a lower intensity for the D-band and G-band peaks (figure 4(c), blue spectrum), which could indicate again surface oxidation of the BDUNCD electrode surface. The D/G ratio of 0.82 in the 40 h etched BDUNCD surface signifies the retention or preservation of the initial diamond quality with almost similar sp3 and sp2 coverage as that of the initial 0th h surface.
Next, EIS was utilized to characterize changes in the BDUNCD grains and grain boundaries during the 40 h cleaning. Based on our previously published work [20, 30], the 0th h EIS data was fitted to a circuit model as shown in figures 7(a) and (b). The solid lines represent the best fit to the circuit diagram shown as an inset. Note: experiments were performed in replicates (n = 3) from three different chips. The general behavior of the spectra is very reproducible. Additionally, the values of circuit elements showed a small difference of 1%–11%, which implies that the conclusions drawn are sound and statistically significant. Therefore, only typical spectra and circuit element values are reported in figure 7 and tables 1 and 2. The spectra consist of a very small arc at very high frequencies, followed by a large arc at low frequencies. [Rs(C[RctQ])] is the equivalent circuit that fits the experimental data well. The four elements of this fitted circuit are solution resistance (Rs), capacitance (C), charge transfer resistance (Rct) and constant phase element (CPE) (Q) and the values are shown in table 1. The Rs is mainly due to the electrolyte. The diamond grains are mainly comprised of highly ordered, sp3-bonded carbon atoms, where each carbon atom is tightly bonded to four other carbon atoms. Due to such strong bonding, the grains have fewer defects and impurities [18, 35]. Thus, the surface of the diamond grains is chemically homogeneous and exhibits a single RC time constant. Therefore, the capacitance in the circuit can be attributed to the grains. Conversely, the grain boundaries comprise of non-diamond carbon impurities, i.e. highly disordered, sp2-bonded carbon atoms. It is generally believed that a majority of the boron dopant atoms, impurities and defects reside at or near grain boundaries [31–34]. Such a surface is chemically, microstructurally and morphologically heterogeneous and leads to RC time constant dispersion, which is variation along the electrode surface of the reactivity or of the current and the potential. The presence of time constant dispersion is modeled by a CPE. Thus, the CPE in the circuit is attributed to grain boundaries. Next, the circuit element Rct is due to both grains and grain boundaries and its value depends on the boron dopant concentration, boron uptake variability and microfabrication induced surface heterogeneities [30]. The Q due to grain boundaries is in the μMho range.
Figure 7.
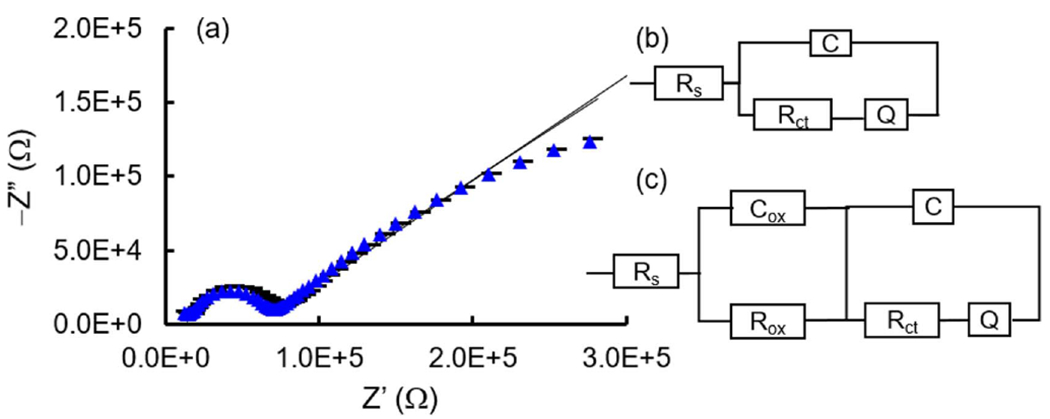
(a) Nyquist plot of BDUNCD microelectrode before (blue triangle curve) and after (black dashed curve) 40 h electrochemical cleaning. The solid curves are fitted to experimental data. The electrolyte is 5 mM Fe(CN)63−/4− in 1 M KCl. 10 mV amplitude, 0.1 Hz–100 KHz. (b), (c) The equivalent circuits fitted to experimental EIS data collected before and after the cleaning.
Table 1.
Typical values of interfacial parameters of 150 μm BDUNCD microelectrode at 0th h of cleaning obtained by fitting [Rs(C[RctQ])] circuit to experimental data. The % errors for Rs, C, Rct, Q and N are 0%–5%, 8%–11%, 4%–6%, 2%–4% and 2%–4%, respectively.
| Rs (KΩ) | C (pF) | Rct (KΩ) | Q (μMho) | N |
|---|---|---|---|---|
| 9.7 | 751 | 21 | 5.0 | 0.48 |
Table 2.
Values of interfacial parameters of 150 μm BDUNCD microelectrode at 40th h of cleaning obtained by fitting [Rs(CoxRox)(C[Rct(Q)])] circuit to experimental data. The % errors for Rs, Cox, Rox, C, Rct, Q and N are 0%, 5%–11%, 6%–8%, 3%–5%, 5%–9%, 6%–8% and 5%–8%, respectively.
| Rs (KΩ) | Cox (pF) | Rox (KΩ) | C (pF) | Rct (KΩ) | Q (μMho) | N |
|---|---|---|---|---|---|---|
| 13.4 | 467 | 7.0 | 1520 | 44.4 | 4.0 | 0.40 |
The fitting of EIS data collected after the 40 h cleaning (figure 7(c)) comprises of six elements (table 2) with the additional capacitance (Cox) and resistance (Rox) arising from the surface oxygen terminated functional groups [35]. The presence of this surface oxidation or passivation regions is likely to have increased the DA oxidation potential from +230 to +308 mV (±10%). The Rct increased from 21 to 43.3 KΩ (±10%), which could be again due to BDUNCD surface oxidation. In addition, after 30 h of cleaning, an increase in DA signal was observed and this could be due to the regeneration of BDUNCD grains and grain boundaries. A 2x increase in BDUNCD grain capacitance or conductivity suggests that some diamond grains are regenerated more than other grains. A small decrease in Q suggests that the grain boundary conductivity did not change significantly. This could be due to fresh grain boundaries being exposed during the prolonged PBS cleaning. Thus, it is important to understand and tune grain and grain boundary properties through suitable surface treatment strategies and thereby maintain the BDUNCD microelectrode’s overall electrochemical activity for the chronic sensing of DA.
4. Conclusions
The three main conclusions of this work are the following: (1) BDUNCD shows significant improvement over the gold standard CFM electrode in terms of dimensional stability, i.e. no material loss during 40 h extended FSCV electrochemical cleaning cycles (i.e. equivalent to 8 million cycles). (2) BDUNCD showed excellent DA signal stability. During the 40 h cleaning protocol, diamond grains and grain boundaries went through oxidation and reactivation cycles differently, which resulted in a minimal loss of electrochemical activity. This was confirmed by observing a minimal DA signal loss of ~20% at BDUNCD microelectrodes as compared to a 90% signal loss at the CFM. Thus, BDUNCD proved to be a better electrode material for chronic DA measurement that requires repeated and frequent cleaning of fouled electrode surfaces at elevated anodic potentials. (3) The impedance spectra of 40 h cleaned BDUNCD surfaces reveal both surface passivation and reactivation of electrochemical activity through the regeneration of grains and sp2 hybridized surface carbon atoms at grain boundaries. This implies that the conductivity of grains and grain boundaries and its chemical and microstructural heterogeneities could play a critical role in the long-term stability of the BDUNCD electrochemical response during chronic DA detection.
Acknowledgments
PUA acknowledges the financial support from Louisiana Board of Regents-RCS support fund (Contract no. LEQSF(2014-17)-RD-A-07).
Footnotes
Conflict of interest
The authors declare no competing financial interest.
References
- [1].Eccles JC 1982. Ann. Rev. Neurosci 5 325–33 [DOI] [PubMed] [Google Scholar]
- [2].Eccles JC 1990. J. Neurosci 10 3769–81 [DOI] [PMC free article] [PubMed] [Google Scholar]
- [3].Swanson CJ, Bures M, Johnson MP, Linden AM, Monn JAand Schoepp DD 2005. Nat. Rev. Drug Discov 4 131–44 [DOI] [PubMed] [Google Scholar]
- [4].Clark JJ et al. 2010. Nat. Methods 7 126–9 [DOI] [PMC free article] [PubMed] [Google Scholar]
- [5].Meurs A, Clinckers R, Ebinger G, Michotte Y and Smolders I 2008. Epilepsy Res. 78 50–9 [DOI] [PubMed] [Google Scholar]
- [6].Smeland OB, Hadera MG, McDonald TS, Sonnewald Uand Borges K 2013. J. Cereb. Blood Flow Metab 33 1090–7 [DOI] [PMC free article] [PubMed] [Google Scholar]
- [7].Boison D 2008. Prog. Neurobiol 84 249–62 [DOI] [PMC free article] [PubMed] [Google Scholar]
- [8].During MJ and Spencer DD 1992. Ann. Neurol 32 618–24 [DOI] [PubMed] [Google Scholar]
- [9].Van Gompel JJ, Bower MR, Worrell GA, Stead M, Chang SY, Marsh WR, Blaha CDand Lee KH 2014. Epilepsia 55 233–44 [DOI] [PMC free article] [PubMed] [Google Scholar]
- [10].Robinson DL, Hermans A, Seipel AT and Wightman RM 2008. Chem. Rev 108 2554–84 [DOI] [PMC free article] [PubMed] [Google Scholar]
- [11].Sandberg SGand Garris PA 2010. Adv. Neurosci. Addiction 4 101–36 [Google Scholar]
- [12].Willuhn I, Wanat MJ, Clark JJ and Phillips PE 2010. Curr. Top. Behav. Neurosci 3 29–71 [DOI] [PMC free article] [PubMed] [Google Scholar]
- [13].Cahill PS, Walker QD, Finnegan JM, Mickelson GE, Travis ER and Wightman RM 1996. Anal. Chem 68 3180–6 [DOI] [PubMed] [Google Scholar]
- [14].Takmakov P, Zachek MK, Keithley RB, Walsh PL, Donley C, McCarty GS and Wightman RM 2010. Anal. Chem 82 2020–8 [DOI] [PMC free article] [PubMed] [Google Scholar]
- [15].Heien ML, Phillips PE, Stuber GD, Seipel AT and Wightman RM 2003. Analyst 128 1413–9 [DOI] [PubMed] [Google Scholar]
- [16].Jacobs CB, Peairs MJ and Venton BJ 2011. Anal. Chim. Acta 662 105–27 [DOI] [PubMed] [Google Scholar]
- [17].Koehne JE et al. 2011. Analyst 136 1802–5 [DOI] [PMC free article] [PubMed] [Google Scholar]
- [18].Carlisle JA and Auciello O 2003. Electrochem. Soc. Interface 2 28–31 [Google Scholar]
- [19].Hees J, Hoffmann R, Kriele A, Smirnov W, Williams OA and Nebel CE 2011. ACS Nano 5 3339–46 [DOI] [PubMed] [Google Scholar]
- [20].Siddiqui S, Zeng H, Moldovan N, Hamers RJ, Carlisle JA and Arumugam PU 2010. Biosens. Bioelectron 35 284–90 [DOI] [PubMed] [Google Scholar]
- [21].Yang W, Auciello O, Butler JE, Carlisle JA and Hamers RJ 2002. Nat. Mat 1 253–7 [DOI] [PubMed] [Google Scholar]
- [22].Naguib N, Elam JWand Birrell J 2006. Chem. Phys. Lett 430 345–50 [Google Scholar]
- [23].Zeng H, Konicek A, Moldovan N, Arumugam PU, Siddiqui S and Carlisle JA 2015. Carbon 84 103–17 [Google Scholar]
- [24].Show Y, Witek MA, Sonthalia P, Gruen DMand Swain GM 2003. Chem. Mater 15 879–88 [Google Scholar]
- [25].Janssens SD, Drijkoningen S and Haenen K 2014. Appl. Phys. Lett 104 073107–10 [Google Scholar]
- [26].Kromka A, Davydovaa M, Rezeka B, Vaneceka M, Stuchlikc M, Exnard P and Kalbace M 2010. Diam. Relat. Mater 19 196–200 [Google Scholar]
- [27].Thomas JP, Chen HC, Tseng SH, Wu HC, Lee CY, Cheng HF, Tai NHand Lin IN 2012. ACS Appl. Mater. Interfaces 4 5103–8 [DOI] [PubMed] [Google Scholar]
- [28].Chen YC et al. 2009. Biomaterials 30 3428–35 [DOI] [PubMed] [Google Scholar]
- [29].Burmeister JJ, Moxon Kand Gerhardt GA 2000. Anal. Chem 72 187–92 [DOI] [PubMed] [Google Scholar]
- [30].Dutta G, Siddiqui S, Zeng H, Carlisle JA and Arumugam PA 2015. J. Electroanal. Chem 756 61–8 [DOI] [PMC free article] [PubMed] [Google Scholar]
- [31].Birrell J, Carlisle JA and Gibson JM 2002. App. Phys. Lett 81 2235–7 [Google Scholar]
- [32].Gajewski W, Achatz P, Williams OA, Bustarret E, Stutzmann Mand Garrido JA 2009. Phys. Rev. B 79 045206–14 [Google Scholar]
- [33].Zapol P, Sternberg M, Curtiss LA, Frauenheim T and Gruen DM 2001. Phys. Rev. B 65 045403–8 [Google Scholar]
- [34].May PM, Ludlow WJ, Hannaway M, Smith JA, Rosser KNand Heard PJ 2008. Mater. Res. Soc. Symp. Proc 1039 17–25 [Google Scholar]
- [35].Pajkossy TJ 1994. J. Electroanal Chem 364 111–25 [Google Scholar]


