

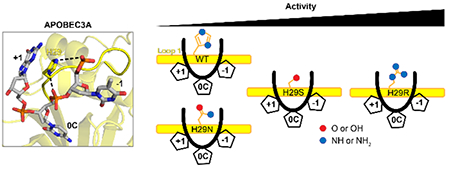
Abstract
The apolipoprotein B mRNA editing enzyme catalytic polypeptide-like 3 (APOBEC3 or A3) family of proteins functions in the innate immune system. The A3 proteins are interferon inducible and hypermutate deoxycytidine to deoxyuridine in foreign single-stranded DNA (ssDNA). However, this deaminase activity cannot discriminate between foreign and host ssDNA at the biochemical level, which presents a significant danger when A3 proteins gain access to the nucleus. Interestingly, this A3 capability can be harnessed when coupled with novel CRISPR-Cas9 proteins to create a targeted base editor. Specifically, A3A has been used in vitro to revert mutations associated with disease states. Recent structural studies have shown the importance of loop regions of A3A and A3G in ssDNA recognition and positioning for deamination. In this work, we further examined loop 1 of A3A to determine how it affects substrate selection, as well as efficiency of deamination, in the hopes of advancing the potential of A3A in base editing technology. We found that mutating residue H29 enhanced deamination activity without changing substrate specificity. Also interestingly, we found that increasing the length of loop 1 decreases substrate specificity. Overall, these results lead to a better understanding of substrate recognition and deamination by A3A and the A3 family of proteins.
Graphical Abstract
Introduction
APOBEC3 (A3) proteins are a family of cytidine deaminases whose activity has been associated with the restriction of viruses, the inhibition of retrotransposition, and the induction of mutations that have been correlated to cancers 1–4. The A3 family deaminates deoxycytidines to deoxyuridines in single-stranded DNA (ssDNA), resulting in hypermutated ssDNA 5, 6. These enzymes have been shown to function in the innate immune response to different pathogens. A3A expression is induced by the interferon response to adeno-associated virus (AAV), human papillomavirus (HPV), and hepatitis B virus (HBV) infections 7–10.When A3A encounters foreign ssDNA, it preferentially acts on substrates with a sequence of 5’-TTCA, where the thymidine in the position directly 5’ to the deaminated cytidine (underlined) is referred to as the −1 nucleotide 11–14. However, each A3 protein recognizes a unique hotspot sequence. We have experimentally exploited A3G, which prefers a cytidine in the −1 position, while most other human A3 proteins prefer a thymidine in the −1 position 14–17.
A3A is the most potent cytidine deaminase in the human A3 family of proteins. It can deaminate 7- to 5000-fold more deoxycytidine than other A3 proteins – where it is seven times more active than A3H, 140-fold more active than A3C, 200 times more active than A3B, 2500 times more active than A3G, and 5000-fold more active than A3D and A3F 18. It can also deaminate methylated cytidines 500-fold better than all of the other A3s, except A3H, which is about 50% less active than A3A 18, 19. The deamination of methylated cytidines results in thymidine, which is more difficult for the cell to detect as a problem in DNA. Thus, the ability to deaminate methylated cytidines is particularly interesting due to implications in cancer mutagenesis and recent advances in Cas9-A3A fusion designs for gene editing 20–22. When residue 57 in loop 3 is mutated, the selectivity of A3A is restored in the context of Cas9, although the activity of the fusion protein is less than ideal, and needs to be rescued by two additional point mutations 20. To facilitate the development of Cas9-A3A base editing technology, it is important to determine how the activity of A3A is affected by various parts of the protein, especially those regions involved in A3A-DNA interactions.
Structurally, all A3 proteins share a similar fold of a 5-stranded β-sheet surrounded by 6 α-helices 23, 24. The active site of the A3 proteins contains a well-conserved H-X-E-X23-28-P-C-X2-4-C motif that coordinates a zinc ion 25–28. Extensive studies have investigated which portion of A3 proteins is responsible for substrate selection and activity. The recent structures of both full-length A3A and the A3G C-terminal domain (A3GCTD) bound to ssDNA substrates show that loops 1, 3, and 7 are primarily responsible for interacting with the substrate (Figure 1A) 13, 14, 29, 30. Loop 7 of the A3 proteins has been very well-studied both biochemically and structurally because of its impact on the selection of the −1 nucleotide in the hotspot. Studies have shown that swapping loop 7 between A3s and activation-induced cytidine deaminase (AID) changes the preference for the −1 nucleotide 15, 16, 31, 32. However, the structures of A3A and A3GCTD bound to ssDNA show that loop 1 of both A3A and A3GCTD is positioned well to interact with all four nucleotides canonically considered to be the hotspot 13, 14, 29. We hypothesized that key mutations in this loop would affect either the preference for the hotspot or the rate of deamination. Here, we show that while the hotspot preference was unaffected by point mutations, the rate of deamination was increased by mutations at position H29. Conversely, when loop 1 was lengthened the preference for thymidine in the −1 position was decreased, but the rate of deamination remained similar to wild-type.
Figure 1.
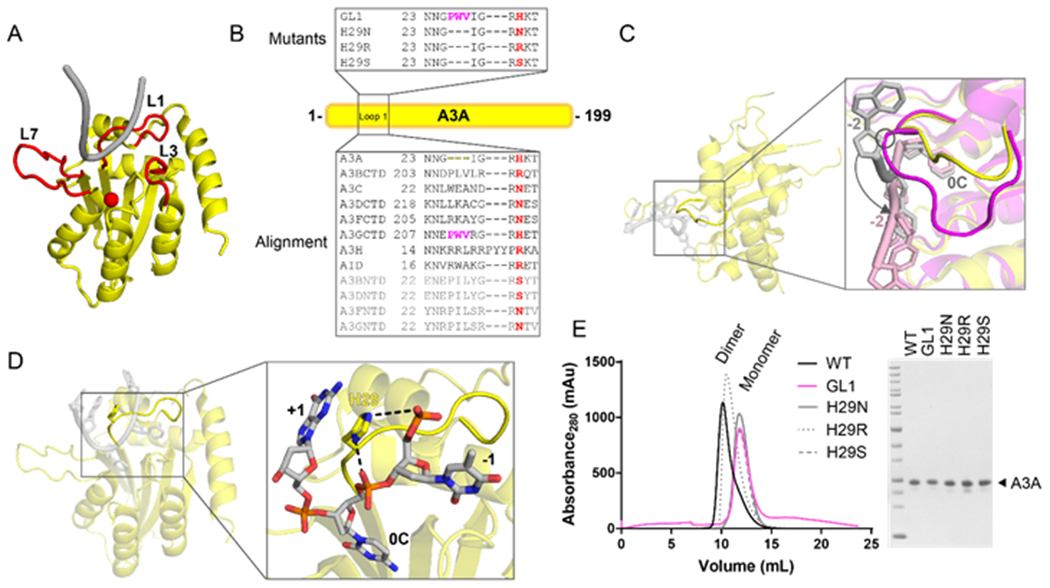
A3A construct design and purification. (A) The structure of A3A (PDBID 5KEG, 5SWW) with the DNA-interacting loops highlighted in red, the catalytic zinc shown as a red sphere, and the DNA shown in gray. (B) Sequence alignment of human A3 family proteins and AID in the boxed region below A3A (yellow bar). Residue 29 is highlighted in red, the three residues used to make the GL1 construct are highlighted in magenta. The N-terminal domain sequences are in light gray. The mutants used in these experiments are in the box above the A3A bar. (C) The structure of A3A bound to ssDNA (PDBID 5KEG, 5SWW, yellow protein with gray DNA). The zoom window shows the overlay of the A3A-DNA (PDB ID 5KEG, 5SWW, yellow-gray) and A3G-DNA (PDB ID 6BUX, magenta-pink) structures to emphasize how loop length affects the DNA orientation. A potential clash between A3G loop 1 and the DNA from A3A is circled for emphasis and the location difference between the two substrates is shown by an arrow. (D) The structure of A3A bound to ssDNA (PDBID 5KEG, 5SWW). The zoom window shows that H29 sits within the U-turn of the DNA to interact with the backbone of the deaminated cytidine and the −1 nucleotide (hydrogen bonding represented by dashed lines). H29 also stacks with the +1 nucleotide. (E) Size exclusion chromatogram (left) of the purified mutants used in this study, with the SDS-PAGE analysis (right) to show purity.
Experimental procedures
A3A mutant cloning and purification
The sequence of wild-type A3A 1 – 199 was inserted into the NcoI-XhoI site of pRSF-Duet-1 plasmid (Novagen) so that it contained an N-terminal 6His tag. All A3A mutants were generated from this construct using QuickChange mutagenesis. The primers are listed in Table S1. Proteins were expressed in BL-21 (DE3) E. coli cells (Novagen) grown in Terrific Broth media (Research Products International) to OD 0.8. The cells were induced with 0.5mM IPTG and grown overnight at 16°C. Cells were harvested and resuspended in Nickel A (NiA) buffer (50 mM Tris pH 8, 400 mM NaCl, 10 mM imidazole, 6% glycerol, 0.1 mM TCEP). Cells were lysed using a microfluidizer. The lysate was centrifuged at 13,500 RPM for 35 minutes. To prevent nuclease contamination, protein preparations were performed under very stringent conditions, including many chromatography steps with all columns cleaned with 0.5M NaOH prior to use. The supernatant was loaded onto a Ni column. The column was washed with 6 column volumes QB buffer (50 mM Tris pH 8, 1 M NaCl, 0.1 mM TCEP) followed by 6 column volumes of NiA buffer. The bound protein was eluted with 5 column volumes of NiB buffer (50 mM Tris pH 8, 400 mM NaCl, 400 mM imidazole, 6% glycerol, 0.1 mM TCEP). The eluate was concentrated and then diluted with QA buffer (50 mM Tris pH 8, 1 M NaCl, 0.1 mM TCEP) to lower the salt of the solution. The protein was loaded onto an anion exchange column. The elution peak varied depending on the construct. A3A was then concentrated and diluted to a lower salt with QA. The protein was loaded onto a heparin column. Each construct also eluted differently on the heparin column, which was concentrated to a volume appropriate to load onto a size exclusion column (S75GL) and run in 50mM Tris pH 8, 150mM NaCl, and 0.1mM TCEP. The peak fractions were then re-run on the column to ensure purity.
Rifampicin assay
We transformed each A3A construct into BW310 E. coli cells (courtesy of the Coli Genetic Stock Center at Yale) which lack the uracil DNA glycosylase gene and plated on Kan+ plates. An individual colony was picked and resuspended in media with 40ug/ml of Kan. Cultures were grown at 37°C for three hours to an approximate OD of 0.4. Cells were induced with 1mM IPTG and grown at 37°C for six hours. After growth, cells were plated in either a 1:50,000 dilution on Kan+ plates or a 1:10 dilution on Rif+/Kan+ plates. The plates were incubated at 37°C overnight. Colonies were counted to determine the efficiency of deamination in ten replicates of the experiment. From each plate, five colonies were chosen to amplify a region of the E. coli RpoB gene to determine the mutagenic profile of each construct, as previously described 5, 6. Mutations were analyzed using the Benchling biology software.
Deoxycytidine deamination activity assay
Activity assays were performed similarly to a previously published protocol 30. Briefly, 6-carboxyfluorescein (6-FAM) labeled substrates containing either a TC or CCC hotspot were diluted with buffer (20 mM H2PO4 pH 7.5, 50 mM NaCl, 0.1 mM TCEP) to 1-40 μM concentrations. A3A was added to the substrate solution and reacted at room temperature. Alternatively, reactions were performed at a lower pH (20 mM H2PO4 pH 6.0, 50 mM NaCl, 0.1 mM TCEP, 0.1% Triton X-100) at 37°C. Reactions were stopped at varying time points by heating to 95°C for 5 minutes. 5 units of uracil DNA glycosylase (NEB) were added. Reaction was incubated at 37°C for 30 minutes. 0.25 M NaOH was then added and the reaction was incubated at 37°C for 30 minutes. 10 μL of 1 M Tris pH8 was added to neutralize the pH of the sample and equal volume formamide was added to the sample as loading buffer. The reacted samples were heated at 95°C for 5 minutes and put directly into ice. From ice, samples were loaded on a 15% TBE-Urea gel and run for 50 minutes at 200V. All assays were performed in triplicate. Imaging was performed on a BioRad ChemiDoc using the fluorescein channel. Image analysis and band quantification was performed in ImageStudio Lite.
Fluorescence Anisotropy Titrations
Fluorescence anisotropy measurements were carried out on a Quantamaster fluorometer (Photon Technology International Inc.) at 25oC in buffer A (30 mM sodium phosphate pH 6.0, 50 mM NaCl, 0.1 mM TCEP). A fluorescein labelled 15 nt DNA substrate [200 nM] was titrated with increasing concentrations of WT or the specified mutant A3A protein. The fluorescent DNA probe was excited at 485 nm and the fluorescence emission was measured at 515 nm. The fluorescence anisotropy was calculated for each titration point and plotted as a function of protein concentration. The associated error for each titration point is from the standard deviation of three independent readings. The dissociation constant (Kd) was calculated by fitting the titration curve to a hyperbola and the associated error is the standard error from the fit.
Statistical analysis
All statistical analysis was performed used GraphPad Prism 7.01. A 2-way ANOVA followed by a Tukey test for multiple comparisons was performed on the Rifampicin assay mutation counts for each of the hotspot positions, as well as on the deamination activity assay to compare kcat of the mutants (the efficiency of deamination, WT vs. each mutant). A 1-way ANOVA with multiple comparisons was done to determine the statistical significance of the Rifampicin assay colony counts. A student’s T-test with the assumption that standard deviations are not consistent and correcting for multiple comparisons using the Holm-Sidak method was done to determine statistical significance of the kcat/KM values (the catalytic efficiency of deaminating the TC vs. the CC substrate). Any P value less than 0.05 was considered significant for all of these tests.
Results
Design and purification of A3A loop 1 mutants
Recently, two structures of A3A bound to ssDNA were determined (PDB IDs 5KEG, 5SWW) 13, 14. In these structures, the ssDNA is in a U-shape conformation that is similar to the conformation observed in the Staphylococcus aureus tRNA adenosine deaminase TadA (PDB ID 2B3J) 33. Consistent with other human A3 family proteins, loop 7 of A3A is important for selection of the −1 hotspot nucleotide 13, 14. However, recent studies have shown that loop 1 also affects the A3 family’s ability to deaminate methylated deoxycytidine 18, 34. Additionally, we have recently shown that loop 1 in the A3GCTD can affect the preference at the −1 position 30. Loop 1 in A3A, compared to A3G and the rest of the human A3 family, is three residues shorter than the other proteins (Figure 1B). This length difference may contribute to the efficiency of A3A in deamination. As shown in Figure 1C, the longer loop of the A3GCTD (PDB ID 6BUX) would potentially clash with the −2 nucleotide of the ssDNA in the context of the A3A-DNA structure (PDB ID 5SWW, 5KEG) 13, 14, 29. The ssDNA would be forced to shift 6Å to a flatter conformation to avoid this clash, which could potentially change the efficiency of deamination by the enzyme.
We further examined the structure of A3A (PDB ID 5SWW, 5KEG) and noted that residue H29 is located within the channel of the U-turn of the ssDNA, making hydrogen bonds with the backbone of both the −1 nucleotide and the target deoxycytidine, as well as stacking with the +1 nucleotide (Figure 1D). When the alignment of the A3 family is analyzed, this position is not highly conserved (Figure 1B). Based on this analysis, we created three single point mutations of A3A – H29N, H29R, and H29S to assess their effect on deamination activity. We also investigated the effect of the length of loop 1 on substrate selection. We chose to lengthen A3A’s loop 1 with three residues from A3G since A3G is the only human A3 protein that has a distinct hotspot preference from A3A. We purified these mutants to homogeneity. Interestingly, WT A3A and H29R purified primarily as dimers, while GL1, H29N, and H29S purify as monomers (Figure 1E). Both the monomer and dimer states have been observed previously, and have been determined to be active 11, 35. Thus, these purified proteins were used in the following experiments to determine how small changes in loop 1 affect deamination activity.
Loop 1 mutations affect A3A mutant catalytic activity in vitro
We used the previously described uracil DNA glycosylase (UDG)-based deaminase activity assay to determine the activity of the A3A mutants on a substrate with a deoxycytidine (Figure 2A and Figure S1) 30. All of the A3A variants tested deaminated the substrates containing deoxycytidine (Figure 2A). The A3A loop 1 mutants showed deoxycytidine deaminase activity similar to or higher than that of WT A3A. Using Michaelis-Menten kinetics, we first determined the catalytic constant (kcat) of each protein construct to determine which of the mutants was the most active when deaminating a substrate with the preferred thymidine in the −1 position of the hotspot (TTCA) (Figure 2B–F and Table 1). WT A3A deaminated the TTCA substrate with a catalytic constant of 0.7 min−1, which was lower than the previously published constant of 15 min−1 (Figure 3A, Table 1) 19. When we performed the deamination experiments at a lower pH of 6, we found that the rate of substrate turnover was substantially increased for all of the mutants (Figure S2, Table S2), consistent with previously published pH-dependent activity assays of A3A 18, 19. The A3A variants at pH 6.0 showed catalytic and specificity profiles consistent with what we observed at pH 7.5. Here, we analyzed the data collected at pH 7.5, in conditions close to that of the cellular environment 36. Under these reaction conditions, the H29R mutant had a significantly higher catalytic constant of 7.28 min−1 with the TTCA substrate, which was statistically different to all of the constructs tested (Figure 3A, Table 1). The H29S mutant displayed intermediate activity between WT A3A and H29R with a kcat of 3.01 min−1 (Figure 3A, Table 1).
Figure 2.
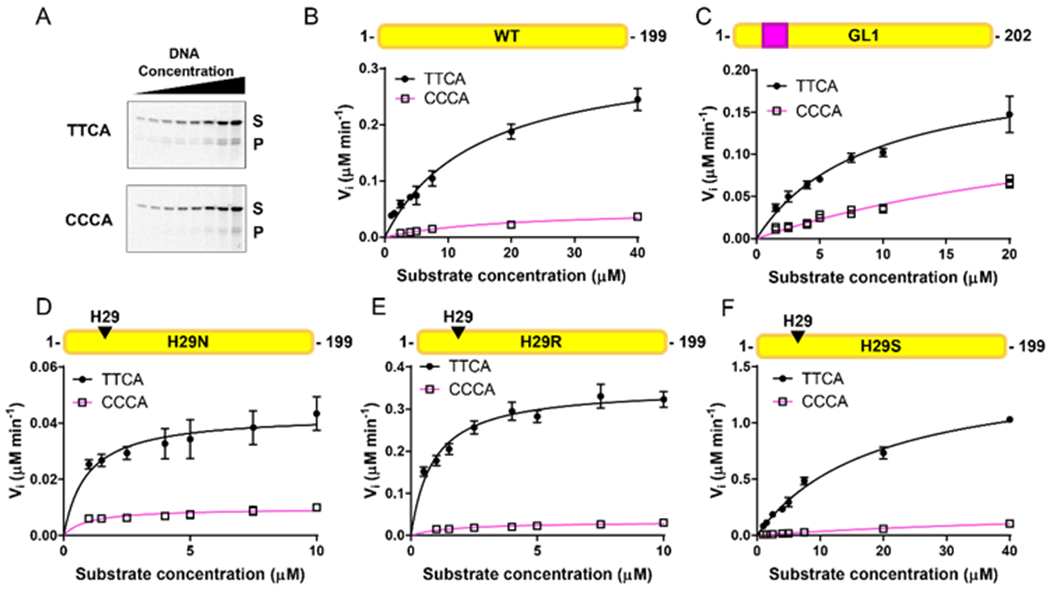
WT and loop 1 mutants of A3A deaminate TTCA substrate more efficiently than CCCA substrate. (A) Example gel images of the WT A3A deamination assays with the TTCA substrate in the top panel and the CCCA substrate in the bottom panel. The full-length substrate is labelled with S and the product band is labelled with P. Images of all gels are included in Figure S1. (B-F) Michaelis-Menten plots of the loop 1 mutants tested. TTCA substrate curves are shown using circles and black lines. CCCA substrate curves are shown using squares and pink lines. The data represent the average of three replicates and the bars indicate the standard deviation. For all of the CCCA substrate curves, the error bars are small enough to be obscured by the symbols.
Table 1.
Deamination rates of all of the A3A mutants on two substrates.
| Hotspot | Mutant | [protein] (μM) | KM (μM) | Vmax (μM*min−1) | kcat (min−1) | kcat/KM (min−1*μM−1) |
|---|---|---|---|---|---|---|
| TTCA | WT | 0.5 | 15 ± 4 | 0.33 ± 0.04 | 0.67 ± 0.09 | 0.05 ± 0.01 |
| GL1 | 0.25 | 10 ± 4 | 0.21 ± 0.05 | 0.87 ± 0.19 | 0.10 ± 0.02 | |
| H29N | 0.1 | 1 ± 0.4 | 0.04 ± 0.01 | 0.44 ± 0.07 | 0.53 ± 0.20 | |
| H29R | 0.05 | 1 ± 0.1 | 0.36 ± 0.01 | 7.28 ± 0.16 | 6.70 ± 0.46 | |
| H29S | 0.5 | 19 ± 2 | 1.50 ± 0.04 | 3.01 ± 0.07 | 0.16 ± 0.02 | |
| CCCA | WT | 0.5 | 18 ± 6 | 0.05 ± 0.01 | 0.10 ± 0.02 | 0.006 ± 0.001 |
| GL1 | 0.25 | 36 ± 13 | 0. 19 ± 0.05 | 0.75 ± 0.20 | 0.021 ± 0.002 | |
| H29N | 0.1 | 1 ± 0.2 | 0.010 ± 0.001 | 0.10 ± 0.01 | 0.11 ± 0.02 | |
| H29R | 0.05 | 2 ± 0.4 | 0.033 ± 0.002 | 0.66 ± 0.05 | 0.39 ± 0.11 | |
| H29S | 0.5 | 73 ± 30 | 0.29 ± 0.07 | 0.58 ± 0.14 | 0.008 ± 0.001 | |
Figure 3.
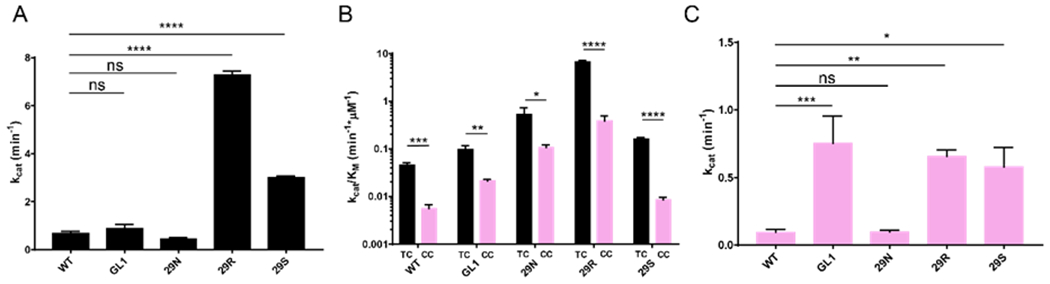
H29 point mutations affect A3A catalytic activity in vitro. (A) Comparison of catalytic activity between WT A3A and mutants on the TTCA substrate shows that H29R and H29S are significantly more active than WT A3A. (B) Catalytic efficiency, shown on a logarithmic scale, of each A3A construct on substrates containing either the TTCA hotspot or the CCCA hotspot indicates that all proteins prefer the TTCA substrate. (C) Comparison of catalytic activity between WT A3A and mutants on the CCCA substrate shows that GL1, H29R, and H29S are significantly more active than WT A3A. Significance was determined using a 2-way ANOVA to determine the difference between kcat values and a student’s t-test to determine the difference between the kcat/KM of TTCA vs. CCCA for each A3A mutant: ns – no significance, * P < 0.05, ** P < 0.005, *** P < 0.0005 , **** P < 0.0001. The standard deviation is presented for all measurements.
Comparatively, all of the A3A variants deaminated substrates that had a non-preferred cytidine in the −1 hotspot position (CCCA) less efficiently (Figure 3B). We quantified this using the catalytic efficiency (kcat/KM) of the A3A mutants. The WT, GL1, and H29N A3As were five times more efficient at deaminating TC compared to CC, while both H29R and H29S were over 15-fold more effective with the TC substrate (Figure 3B and Table 1). After determining that all of the A3A constructs were more efficient at deaminating the TC substrate over the CC substrate, we further examined which mutant was the best at deaminating the CCCA substrate. Based on the catalytic constant (kcat), we found that GL1 was the best at deaminating the CCCA substrate with a kcat of 0.75 min−1, although there was no significant difference between the values of GL1, H29R, and H29S (Figure 3C). Interestingly, while all of the mutants and WT A3A prefer a thymidine in the −1 position as determined by the kcat/KM, the GL1 mutant went from being one of the least active A3A variants against the TTCA substrate to one of the most active against the CCCA substrate. This transition in activity level is likely due to a decreased selectivity for the nucleotide in the −1 position, suggesting that GL1 A3A can effectively deaminate a substrate with either a thymidine or a cytidine at the −1 position when the effective concentration of substrate is substantially higher than the KM. Overall, it is intriguing that the H29R mutant was about 10-fold more active than WT A3A, especially because A3A (with a histidine in position 29) has been shown to be significantly more active than other A3 proteins with an arginine in the equivalent position 18. Also, interestingly, it has been reported that A3A H29R is less active than WT A3A under different reaction conditions, suggesting that the activity of A3A is highly dependent on the context of the reaction 37. Consistent with this notion, the KM of WT and H29R are similar at pH 6, but significantly different at pH 7.5 (Table S2, Table 1). This pH-dependent difference is likely due to the lack of a protonated state of H29 at pH 7.5, leading to a weaker affinity for the DNA, as proposed earlier 38, 39. Under our experimental conditions, while the activity of H29R increased, it did not alter the preference for the ssDNA substrate, actually increasing the preference for a thymidine at the −1 position, which makes this mutant a potentially interesting avenue to be incorporated into the current Cas9-A3A constructs.
We further measured the binding constants between ssDNA and WT A3A, H29R, or H29S to understand their differences in kinetic parameters. We used fluorescence anisotropy to examine the dissociation kinetics of H29R and H29S in comparison to WT A3A (Figure 4). We found that the H29R mutation did not alter the affinity for the ssDNA substrate, as compared to WT A3A (Figure 4A, 4B). Therefore, H29R is increasing the ability of the enzyme to turn over the substrate (kcat) without impacting the affinity. Interestingly, the H29S mutation decreased the affinity for ssDNA substrate by three-fold (Figure 4C–D). However, our data show that the turnover of substrate by H29S is also significantly higher that WT A3A (Table S2). These results suggest that despite the unchanged (H29R) or decreased (H29S) affinity for the substrate, these mutants potentially enable a more catalytically productive conformation or increase the efficiency of product release when compared with WT A3A.
Figure 4.
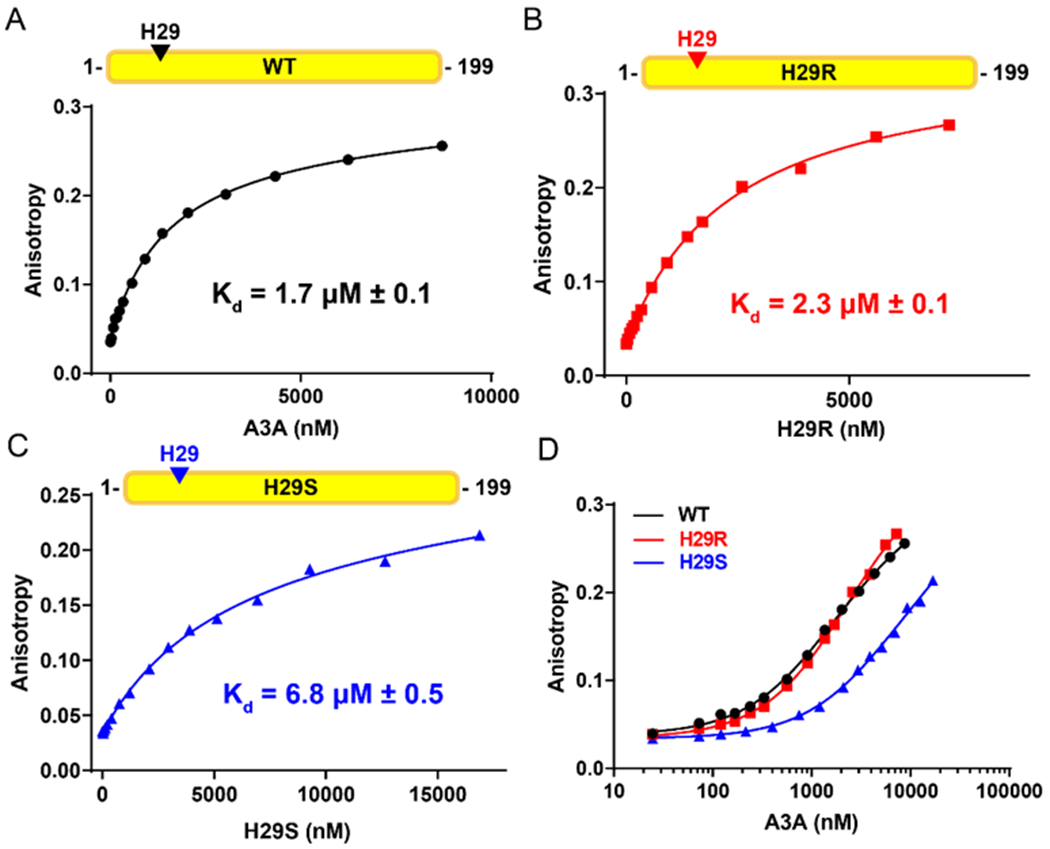
H29R mutation does not affect A3A substrate binding affinity. (A-C) Fluorescence anisotropy of WT A3A (A), H29R (B), and H29S (C) binding to a 5’-fluorescently labeled 15-nucleotide ssDNA substrate (Table S1). The measurements of each titration point were done in triplicate and the standard deviation of each point was calculated (the error bars are small enough to be obscured by the symbols). The dissociation constant (Kd) is shown on each graph. (D) Log scale anisotropy curves to compare affinities between WT (black), H29R (red), and H29S (blue).
Loop 1 point mutants do not alter A3A hotspot preference in rifampicin-based assays
To test if the sequence preference of the A3A mutants is maintained in a cellular environment, we used the established rifampicin (Rif) assay in the BW310 strain of E. coli to compare the A3A constructs (Figure 5A) 5, 6. In this assay, we determined whether A3A had mutated the RNA polymerase β (RpoB) gene, which renders the E. coli resistant to rifampicin. We induced expression of all of the A3A mutants and plated the cells on both (+)Rif and (−)Rif plates. The fraction of colonies on the (+)Rif plates compared to the (−)Rif plates was used to determine how active the A3A mutants were. Compared to the vector alone and the catalytic inactive (E72Q) controls, WT A3A is approximately 300-fold more active, which confirms that the cytidine deamination is primarily responsible for the rescue phenotype in this assay. When the mutants were analyzed, H29N and H29R do not rescue the E.coli cells significantly differently from WT A3A (Figure 5A). This was unexpected for H29R due to its hyperactivity in the deaminase assay. Potentially, the cellular context affected how well H29R could function as its activity appears to be sensitive to reaction conditions. Interestingly, WT A3A is almost 6-fold more active than the longer-looped GL1 construct, despite their similar activities in our biochemical assays. We suspect this is potentially due to the decreased selectivity of the GL1 mutant, which could be extraneously mutating the E.coli genome, resulting in less viable bacteria. Conversely, H29S rescues two-fold more E. coli than WT A3A, which correlates well with its higher activity in the deaminase assay (Figure 5A, Tables 1 and S2).
Figure 5.
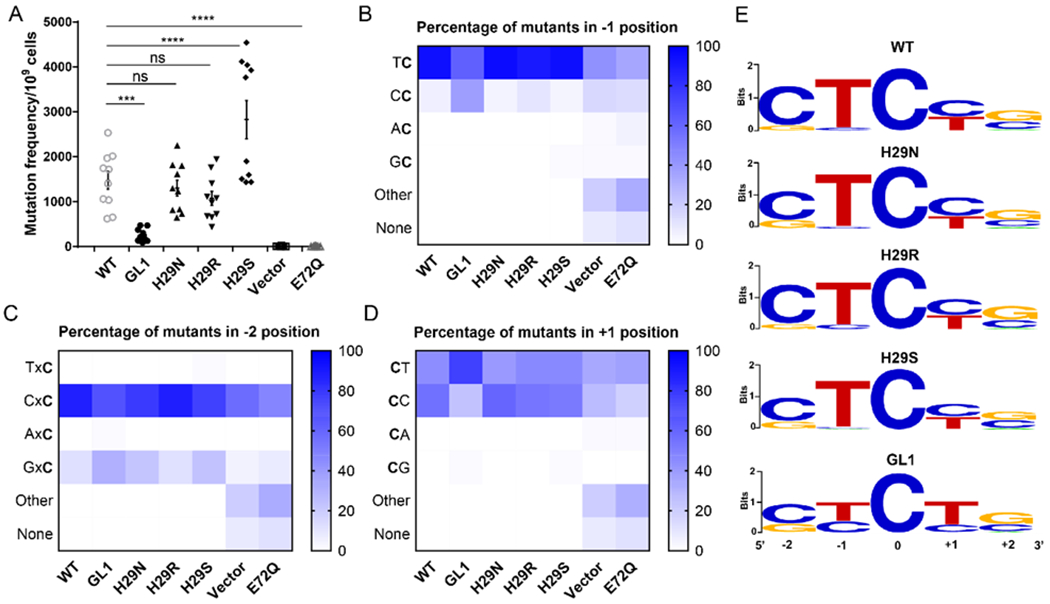
The point mutations in A3A do not change substrate preference. (A) Rifampicin assay colony counts. Ten replicates of the experiment were counted and averaged, with the error bars representing the SEM. The stars represent the level of statistical significance: ns = no significance, * P<0.05, ** P<0.005, *** P<0.0005, **** P<0.0001. (B-D) Sequence analysis of a portion of the RpoB gene from five colonies from each replicate (50 colonies total) from each A3A mutant. These samples were sequenced and analyzed for a change in preference in the −1, −2, and +1 positions of the hotspot. The percentage of preference for each of the four nucleotides was calculated in the −1 (B), −2 (C), and +1 (D) positions, and is displayed on a scale of white for 0% to dark blue for 100%. GL1 was statistically significantly (as calculated by a 1-way ANOVA with multiple comparisons) different compared to WT at both the −1 and +1 positions. There was no statistical significant difference between WT A3A and the H29 point mutants at any of the hotspot positions. (E) Sequence logo representations of the most preferred hotspot for each A3A mutant.
To determine whether the observed activity level of each A3A variant was due to the hotspot preference, we chose five individual colonies from each replicate of the (+)Rif plates and sequenced a portion of the RpoB gene, as described previously 5, 6. We first examined the nucleotide in the −1 position of the hotspot. As expected, WT A3A significantly preferred to have a thymidine in the −1 position over a cytidine (Figure 5B). This pattern held true for all of the mutants tested. However, the data for the −1 cytidine is intriguing. WT A3A and H29N, H29R, and H29S do not deaminate DNA with a cytidine in the −1 position of the hotspot. However, consistent with our in vitro deamination assay, the substrates of the GL1 mutant have an increased propensity for a cytidine in the −1 position compared to WT A3A (Figure 5B, 5E). This confirms the data from our previous experiment that showed that while GL1 prefers at thymidine in the −1 position, it also has an increased capacity to deaminate with a cytidine in the −1 position (Figures 3C and 5E).
We also examined the preference for the nucleotide in both the −2 position and the +1 position of the hotspot. All of the constructs significantly preferred to have a cytidine in the −2 position (Figure 5C, 5E). When looking at the +1 position, all of the constructs except for GL1 had an equal preference for cytidine or thymidine (Figure 5D, 5E). GL1 was unique in that it preferred to deaminate substrates that had a thymidine in the +1 position. The hotspot preference at the −2 and −1 positions determined by this assay are consistent with previously published data 39. These data provide further evidence that the longer loop 1 potentially affects the position of the ssDNA, which decreases hotspot selectivity. It is possible that this decrease in selectivity caused more mutations throughout the bacterial genome outside of the RpoB gene, which potentially damaged important portions of the bacterial genome, resulting in a decreased rescue of the cells (Figure 5A). These data support our results from the in vitro biochemical experiments, showing that the point mutation at H29 does not affect hotspot preference and that a longer loop 1 decreases selectivity, without altering preference.
Discussion
A3A is one of the most active human A3 deoxycytidine deaminases 18, 19. It has been shown to defend against many viral infections, including HPV, AAV, and HBV 7–10. However, A3A can localize to the nucleus, where it cannot differentiate between host and viral ssDNA 40, 41. Thus, A3A has been implicated in mutational patterns found in certain cancers, such as head and neck cancer (HNC) and cervical cancer 4, 42, 43. Understanding how A3A recognizes substrate DNA is important for facilitating the development of strategies to prevent A3A mutagenesis of the human genome. A3A has also been used as a gene-editing tool to increase efficiency and application of the CRISPR-Cas9 system 20–22. Understanding A3A substrate selection and activity may help increase the efficacy of such technologies.
Using the previously reported structures of A3A and A3GCTD bound to ssDNA, together with A3 family sequence alignments, we created multiple A3A loop 1 mutants to study the effects of loop 1 on substrate deamination and hotspot selection 13, 14, 29, 30. We found that the oligomerization state of the protein did not correlate with the activity of the protein. Interestingly, the H29R and H29S mutants deaminated substrate significantly more efficiently than WT A3A, contrary to two previously published results that mutations including H29R were less active than WT 18, 37. However, the published experiments were performed either under conditions different from what we used in this study or included a mutation additional to H29R, and had results that conflicted with each other. The first of these studies was done using 15N-labeled A3A in buffers of pH ranging from 5.5 to 8.1, and measured the activity at room temperature 37. The reported results showed that WT A3A had the highest rate of deamination in a pH range of 6.9 to 7.7, which is different from the results of others . The second study reported an optimal activity of A3A at a pH of 5.5 at 37°C and found that mutating H29 and K30 (H29R/K30Q double mutation) simultaneously resulted in decreased deamination activity 18. These discrepancies highlight the condition-sensitive nature of the H29R mutant activity. This supposition is supported by our data that H29R has an increased activity in the in vitro deaminase assay at both pH 6.0 and pH 7.5, but is only as equally active as WT A3A in the Rifampicin-based assay. It is likely that we have characterized an in vitro experimental condition that makes H29R A3A more active than WT A3A. However, because our results differ from other groups, further experiments are needed to test the activity of H29R in a variety of conditions.
The arginine in this position is found in A3B, A3H, and AID, which all have vastly different rates of catalysis 18. Based on previous molecular dynamics (MD) simulations with individual amino acids interacting with ssDNA, arginine is predicted to be the best amino acid out of the four found in human A3 proteins to interact with ssDNA 44. It forms electrostatic and van der Waals interactions with the backbone of ssDNA, while also having the potential to form diverse hydrogen bonds 44, 45. However, in the MD simulations of the A3B CTD in comparison to A3A, the flexibility of loop 1 causes the arginine to block the active site, thus rendering the benefits of the arginine-ssDNA interaction ineffective 46, 47. In contrast, the MD simulations show that the length of loop 1 in A3A positions H29 away from the active site, leaving it more open 46, 47. Thus, an arginine at this position would potentially be positioned to interact well with ssDNA. This analysis supports our result that H29R A3A is more active than WT A3A. The activity of H29S is somewhat surprising because it is only found in the catalytically inactive N-terminal domains of A3B and A3D. Our data show that a serine at this position in loop 1 is not responsible for the loss of A3 function. The increased activity caused by H29S in the A3A background is potentially due to an increased flexibility of the substrate-interacting residue 29 allowing for a more catalytically productive conformation and/or a faster product release rate, consistent with our activity and binding assays (Figures 2, 4 and Tables 1, S2). Our results suggest that residues at position 29 potentially contribute to the catalysis through a combined effect of flexibility and its ability to interact with the ssDNA backbone.
From these data and the recent crystal structures, it seems that the loop length of A3A optimally positions H29 to interact with the backbone of multiple nucleotides within the ssDNA hotspot (Figure 6A). When this residue is mutated to any of the amino acids found in other A3 proteins, the catalytic activity, but not the substrate hotspot preference, is affected based on how preferred the amino acid is for interacting with ssDNA, correlating well with previous MD simulations 44. However, when loop 1 is lengthened, the interactions with the ssDNA are altered, which reduces the specific preference for both the −1 and +1 nucleotide without substantially affecting the rate of catalysis (Figure 6B). MD simulations of A3B have shown that a longer, more flexible loop 1 results in a more closed active site, thereby decreasing the activity of the protein 46, 47. Our data and the MD simulations agree that the optimal loop 1 length may contribute to the fact that A3A is a more efficient deaminase than any of the other human A3 proteins, which all have longer loops at this position. These observations may be useful for the continuing improvement of using A3A as a Cas9-associated base editor. Furthermore, knowing how to modulate A3A activity may facilitate the development of a deliverable drug with the potential for improved treatment of certain cancers that are affected by A3A function. Because A3A seems to be sensitive to its environment, further experiments will have to be performed on the A3A mutants to determine their activity in the context of human cellular conditions before they can be considered for applications.
Figure 6.
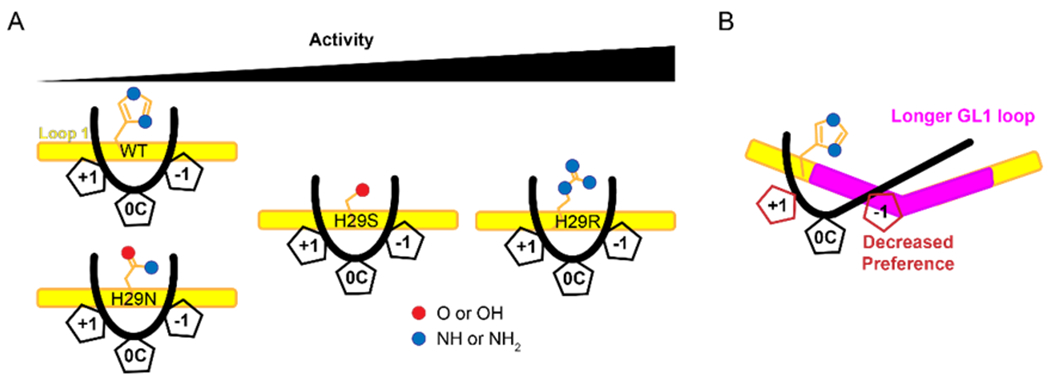
Model of A3A loop 1 interactions with ssDNA (A) Loop 1 of WT A3A holds the substrate in an optimal position to deaminate cytidine. When residue 29 is mutated, there is no change to the preference in the hotspot, but the catalytic efficiency is affected. (B) A longer loop 1 affects the preference for both the −1 and+1 nucleotides. The length of the loop does not change the efficiency of A3A.
Supplementary Material
ACKNOWLEDGMENT
We would like to thank the Yale CGSC for the BW310 cells and the Söll lab for the use of their gel imager. We would like to thank the de la Cruz lab for the use of their fluorimeter and Emily for her invaluable help. We would also like to thank Kirsten, Katie, and Chris for their insightful discussions.
Funding Sources
This project was supported by grants from the National Institutes of Health to Y.X. (AI116313) and S.J.Z. (5T32AI007019-40).
ABBREVIATIONS
- APOBEC3A
apolipoprotein B mRNA editing enzyme, catalytic polypeptide-like 3A
- CRISPR
clustered regularly interspaced short palindromic repeats
- Cas9
CRISPR associated protein 9
- ssDNA
single-stranded DNA
- AAV
adeno-associated virus
- HPV
human papillomavirus
- HBV
hepatitis B virus
- AID
activation-induced cytidine deaminase
- UDG
uracil-DNA glycosylase
- Rif
rifampicin
- RpoB
RNA polymerase β
- MD
molecular dynamics
Footnotes
References
- [1].Alexandrov LB, Nik-Zainal S, Wedge DC, Aparicio SA, Behjati S, Biankin AV, Bignell GR, Bolli N, Borg A, Borresen-Dale AL, Boyault S, Burkhardt B, Butler AP, Caldas C, Davies HR, Desmedt C, Eils R, Eyfjord JE, Foekens JA, Greaves M, Hosoda F, Hutter B, Ilicic T, Imbeaud S, Imielinski M, Jager N, Jones DT, Jones D, Knappskog S, Kool M, Lakhani SR, Lopez-Otin C, Martin S, Munshi NC, Nakamura H, Northcott PA, Pajic M, Papaemmanuil E, Paradiso A, Pearson JV, Puente XS, Raine K, Ramakrishna M, Richardson AL, Richter J, Rosenstiel P, Schlesner M, Schumacher TN, Span PN, Teague JW, Totoki Y, Tutt AN, Valdes-Mas R, van Buuren MM, van ‘t Veer L, Vincent-Salomon A, Waddell N, Yates LR, Australian Pancreatic Cancer Genome, I., Consortium, I. B. C., Consortium, I. M.-S., PedBrain I, Zucman-Rossi J, Futreal PA, McDermott U, Lichter P., Meyerson M., Grimmond SM, Siebert R, Campo E, Shibata T, Pfister SM, Campbell PJ, and Stratton MR (2013) Signatures of mutational processes in human cancer, Nature 500, 415–421. [DOI] [PMC free article] [PubMed] [Google Scholar]
- [2].Burns MB, Lackey L, Carpenter MA, Rathore A, Land AM, Leonard B, Refsland EW, Kotandeniya D, Tretyakova N, Nikas JB, Yee D, Temiz NA, Donohue DE, McDougle RM, Brown WL, Law EK, and Harris RS (2013) APOBEC3B is an enzymatic source of mutation in breast cancer, Nature 494, 366–370. [DOI] [PMC free article] [PubMed] [Google Scholar]
- [3].Harris RS, and Dudley JP (2015) APOBECs and virus restriction, Virology 479-480, 131–145. [DOI] [PMC free article] [PubMed] [Google Scholar]
- [4].Roberts SA, Lawrence MS, Klimczak LJ, Grimm SA, Fargo D, Stojanov P, Kiezun A, Kryukov GV, Carter SL, Saksena G, Harris S, Shah RR, Resnick MA, Getz G, and Gordenin DA (2013) An APOBEC cytidine deaminase mutagenesis pattern is widespread in human cancers, Nat Genet 45, 970–976. [DOI] [PMC free article] [PubMed] [Google Scholar]
- [5].Harris RS, Petersen-Mahrt SK, and Neuberger MS (2002) RNA editing enzyme APOBEC1 and some of its homologs can act as DNA mutators, Mol Cell 10, 1247–1253. [DOI] [PubMed] [Google Scholar]
- [6].Petersen-Mahrt SK, Harris RS, and Neuberger MS (2002) AID mutates E. coli suggesting a DNA deamination mechanism for antibody diversification, Nature 418, 99–103. [DOI] [PubMed] [Google Scholar]
- [7].Berger G, Durand S, Fargier G, Nguyen XN, Cordeil S, Bouaziz S, Muriaux D, Darlix JL, and Cimarelli A (2011) APOBEC3A is a specific inhibitor of the early phases of HIV-1 infection in myeloid cells, PLoS Pathog 7, e1002221. [DOI] [PMC free article] [PubMed] [Google Scholar]
- [8].Chen H, Lilley CE, Yu Q, Lee DV, Chou J, Narvaiza I, Landau NR, and Weitzman MD (2006) APOBEC3A is a potent inhibitor of adeno-associated virus and retrotransposons, Curr Biol 16, 480–485. [DOI] [PubMed] [Google Scholar]
- [9].Henry M, Guetard D, Suspene R, Rusniok C, Wain-Hobson S, and Vartanian JP (2009) Genetic editing of HBV DNA by monodomain human APOBEC3 cytidine deaminases and the recombinant nature of APOBEC3G, PLoS One 4, e4277. [DOI] [PMC free article] [PubMed] [Google Scholar]
- [10].Warren CJ, Xu T, Guo K, Griffin LM, Westrich JA, Lee D, Lambert PF, Santiago ML, and Pyeon D (2015) APOBEC3A functions as a restriction factor of human papillomavirus, J Virol 89, 688–702. [DOI] [PMC free article] [PubMed] [Google Scholar]
- [11].Bohn MF, Shandilya SMD, Silvas TV, Nalivaika EA, Kouno T, Kelch BA, Ryder SP, Kurt-Yilmaz N, Somasundaran M, and Schiffer CA (2015) The ssDNA Mutator APOBEC3A Is Regulated by Cooperative Dimerization, Structure 23, 903–911. [DOI] [PMC free article] [PubMed] [Google Scholar]
- [12].Byeon IJ, Ahn J, Mitra M, Byeon CH, Hercik K, Hritz J, Charlton LM, Levin JG, and Gronenborn AM (2013) NMR structure of human restriction factor APOBEC3A reveals substrate binding and enzyme specificity, Nat Commun 4, Article number: 1890. [DOI] [PMC free article] [PubMed] [Google Scholar]
- [13].Kouno T, Silvas TV, Hilbert BJ, Shandilya SMD, Bohn MF, Kelch BA, Royer WE, Somasundaran M, Kurt Yilmaz N, Matsuo H, and Schiffer CA (2017) Crystal structure of APOBEC3A bound to single-stranded DNA reveals structural basis for cytidine deamination and specificity, Nat Commun 8, Article number: 15024. [DOI] [PMC free article] [PubMed] [Google Scholar]
- [14].Shi K, Carpenter MA, Banerjee S, Shaban NM, Kurahashi K, Salamango DJ, McCann JL, Starrett GJ, Duffy JV, Demir O, Amaro RE, Harki DA, Harris RS, and Aihara H (2017) Structural basis for targeted DNA cytosine deamination and mutagenesis by APOBEC3A and APOBEC3B, Nat Struct Mol Biol 24, 131–139. [DOI] [PMC free article] [PubMed] [Google Scholar]
- [15].Carpenter MA, Rajagurubandara E, Wijesinghe P, and Bhagwat AS (2010) Determinants of sequence-specificity within human AID and APOBEC3G, DNA Repair (Amst) 9, 579–587. [DOI] [PMC free article] [PubMed] [Google Scholar]
- [16].Kohli RM, Abrams SR, Gajula KS, Maul RW, Gearhart PJ, and Stivers JT (2009) A portable hot spot recognition loop transfers sequence preferences from APOBEC family members to activation-induced cytidine deaminase, J Biol Chem 284, 22898–22904. [DOI] [PMC free article] [PubMed] [Google Scholar]
- [17].Kohli RM, Maul RW, Guminski AF, McClure RL, Gajula KS, Saribasak H, McMahon MA, Siliciano RF, Gearhart PJ, and Stivers JT (2010) Local sequence targeting in the AID/APOBEC family differentially impacts retroviral restriction and antibody diversification, J Biol Chem 285, 40956–40964. [DOI] [PMC free article] [PubMed] [Google Scholar]
- [18].Ito F, Fu Y, Kao SA, Yang H, and Chen XS (2017) Family-Wide Comparative Analysis of Cytidine and Methylcytidine Deamination by Eleven Human APOBEC Proteins, J Mol Biol 429, 1787–1799. [DOI] [PMC free article] [PubMed] [Google Scholar]
- [19].Carpenter MA, Li M, Rathore A, Lackey L, Law EK, Land AM, Leonard B, Shandilya SM, Bohn MF, Schiffer CA, Brown WL, and Harris RS (2012) Methylcytosine and normal cytosine deamination by the foreign DNA restriction enzyme APOBEC3A, J Biol Chem 287, 34801–34808. [DOI] [PMC free article] [PubMed] [Google Scholar]
- [20].Gehrke JM, Cervantes O, Clement MK, Wu Y, Zeng J, Bauer DE, Pinello L, and Joung JK (2018) An APOBEC3A-Cas9 base editor with minimized bystander and off-target activities, Nat Biotechnol 36, 977–982. [DOI] [PMC free article] [PubMed] [Google Scholar]
- [21].Wang X, Li J, Wang Y, Yang B, Wei J, Wu J, Wang R, Huang X, Chen J, and Yang L (2018) Efficient base editing in methylated regions with a human APOBEC3A-Cas9 fusion, Nat Biotechnol 36, 946–949. [DOI] [PubMed] [Google Scholar]
- [22].Zong Y, Song Q, Li C, Jin S, Zhang D, Wang Y, Qiu JL, and Gao C (2018) Efficient C-to-T base editing in plants using a fusion of nCas9 and human APOBEC3A, Nat Biotechnol 36, 950–953. [DOI] [PubMed] [Google Scholar]
- [23].Conticello SG (2008) The AID/APOBEC family of nucleic acid mutators, Genome Biol 9, 229. [DOI] [PMC free article] [PubMed] [Google Scholar]
- [24].Malim MH (2009) APOBEC proteins and intrinsic resistance to HIV-1 infection, Philos Trans R Soc Lond B Biol Sci 364, 675–687. [DOI] [PMC free article] [PubMed] [Google Scholar]
- [25].Conticello SG, Thomas CJ, Petersen-Mahrt SK, and Neuberger MS (2005) Evolution of the AID/APOBEC family of polynucleotide (deoxy)cytidine deaminases, Mol Biol Evol 22, 367–377. [DOI] [PubMed] [Google Scholar]
- [26].Jarmuz A, Chester A, Bayliss J, Gisbourne J, Dunham I, Scott J, and Navaratnam N (2002) An anthropoid-specific locus of orphan C to U RNA-editing enzymes on chromosome 22, Genomics 79, 285–296. [DOI] [PubMed] [Google Scholar]
- [27].LaRue RS, Andresdottir V, Blanchard Y, Conticello SG, Derse D, Emerman M, Greene WC, Jonsson SR, Landau NR, Lochelt M, Malik HS, Malim MH, Munk C, O’Brien SJ, Pathak VK, Strebel K, Wain-Hobson S, Yu XF, Yuhki N, and Harris RS (2009) Guidelines for naming nonprimate APOBEC3 genes and proteins, J Virol 83, 494–497. [DOI] [PMC free article] [PubMed] [Google Scholar]
- [28].Wedekind JE, Dance GS, Sowden MP, and Smith HC (2003) Messenger RNA editing in mammals: new members of the APOBEC family seeking roles in the family business, Trends Genet 19, 207–216. [DOI] [PubMed] [Google Scholar]
- [29].Maiti A, Myint W, Kanai T, Delviks-Frankenberry K, Sierra Rodriguez C, Pathak VK, Schiffer CA, and Matsuo H (2018) Crystal structure of the catalytic domain of HIV-1 restriction factor APOBEC3G in complex with ssDNA, Nat Commun 9, Article number: 2460. [DOI] [PMC free article] [PubMed] [Google Scholar]
- [30].Ziegler SJ, Liu C, Landau M, Buzovetsky O, Desimmie BA, Zhao Q, Sasaki T, Burdick RC, Pathak VK, Anderson KS, and Xiong Y (2018) Insights into DNA substrate selection by APOBEC3G from structural, biochemical, and functional studies, PLoS One 13, e0195048. [DOI] [PMC free article] [PubMed] [Google Scholar]
- [31].Rathore A, Carpenter MA, Demir O, Ikeda T, Li M, Shaban NM, Law EK, Anokhin D, Brown WL, Amaro RE, and Harris RS (2013) The local dinucleotide preference of APOBEC3G can be altered from 5’-CC to 5’-TC by a single amino acid substitution, J Mol Biol 425, 4442–4454. [DOI] [PMC free article] [PubMed] [Google Scholar]
- [32].Wang M, Rada C, and Neuberger MS (2010) Altering the spectrum of immunoglobulin V gene somatic hypermutation by modifying the active site of AID, J Exp Med 207, 141–153. [DOI] [PMC free article] [PubMed] [Google Scholar]
- [33].Losey HC, Ruthenburg AJ, and Verdine GL (2006) Crystal structure of Staphylococcus aureus tRNA adenosine deaminase TadA in complex with RNA, Nat Struct Mol Biol 13, 153–159. [DOI] [PubMed] [Google Scholar]
- [34].Fu Y, Ito F, Zhang G, Fernandez B, Yang H, and Chen XS (2015) DNA cytosine and methylcytosine deamination by APOBEC3B: enhancing methylcytosine deamination by engineering APOBEC3B, Biochem J 471, 25–35. [DOI] [PMC free article] [PubMed] [Google Scholar]
- [35].Logue EC, Bloch N, Dhuey E, Zhang R, Cao P, Herate C, Chauveau L, Hubbard SR, and Landau NR (2014) A DNA sequence recognition loop on APOBEC3A controls substrate specificity, PLoS One 9, e97062. [DOI] [PMC free article] [PubMed] [Google Scholar]
- [36].Llopis J, McCaffery JM, Miyawaki A, Farquhar MG, and Tsien RY (1998) Measurement of cytosolic, mitochondrial, and Golgi pH in single living cells with green fluorescent proteins, Proc Natl Acad Sci U S A 95, 6803–6808. [DOI] [PMC free article] [PubMed] [Google Scholar]
- [37].Byeon IJ, Byeon CH, Wu T, Mitra M, Singer D, Levin JG, and Gronenborn AM (2016) Nuclear Magnetic Resonance Structure of the APOBEC3B Catalytic Domain: Structural Basis for Substrate Binding and DNA Deaminase Activity, Biochemistry 55, 2944–2959. [DOI] [PMC free article] [PubMed] [Google Scholar]
- [38].Pham P, Landolph A, Mendez C, Li N, and Goodman MF (2013) A biochemical analysis linking APOBEC3A to disparate HIV-1 restriction and skin cancer, J Biol Chem 288, 29294–29304. [DOI] [PMC free article] [PubMed] [Google Scholar]
- [39].Silvas TV, Hou S, Myint W, Nalivaika E, Somasundaran M, Kelch BA, Matsuo H, Kurt Yilmaz N, and Schiffer CA (2018) Substrate sequence selectivity of APOBEC3A implicates intra-DNA interactions, Sci Rep 8, Article number: 7511. [DOI] [PMC free article] [PubMed] [Google Scholar]
- [40].Landry S, Narvaiza I, Linfesty DC, and Weitzman MD (2011) APOBEC3A can activate the DNA damage response and cause cell-cycle arrest, EMBO Rep 12, 444–450. [DOI] [PMC free article] [PubMed] [Google Scholar]
- [41].Muckenfuss H, Hamdorf M, Held U, Perkovic M, Lower J, Cichutek K, Flory E, Schumann GG, and Munk C (2006) APOBEC3 proteins inhibit human LINE-1 retrotransposition, J Biol Chem 281, 22161–22172. [DOI] [PubMed] [Google Scholar]
- [42].Chan K, Roberts SA, Klimczak LJ, Sterling JF, Saini N, Malc EP, Kim J, Kwiatkowski DJ, Fargo DC, Mieczkowski PA, Getz G, and Gordenin DA (2015) An APOBEC3A hypermutation signature is distinguishable from the signature of background mutagenesis by APOBEC3B in human cancers, Nat Genet 47, 1067–1072. [DOI] [PMC free article] [PubMed] [Google Scholar]
- [43].Vartanian JP, Guetard D, Henry M, and Wain-Hobson S (2008) Evidence for editing of human papillomavirus DNA by APOBEC3 in benign and precancerous lesions, Science 320, 230–233. [DOI] [PubMed] [Google Scholar]
- [44].Andrews CT, Campbell BA, and Elcock AH (2017) Direct Comparison of Amino Acid and Salt Interactions with Double-Stranded and Single-Stranded DNA from Explicit-Solvent Molecular Dynamics Simulations, J Chem Theory Comput 13, 1794–1811. [DOI] [PMC free article] [PubMed] [Google Scholar]
- [45].Wang W, Liu J, and Sun L (2016) Surface shapes and surrounding environment analysis of single- and double-stranded DNA-binding proteins in protein-DNA interface, Proteins 84, 979–989. [DOI] [PubMed] [Google Scholar]
- [46].Hou S, Silvas TV, Leidner F, Nalivaika EA, Matsuo H, Kurt Yilmaz N, and Schiffer CA (2019) Structural Analysis of the Active Site and DNA Binding of Human Cytidine Deaminase APOBEC3B, J Chem Theory Comput 15, 637–647. [DOI] [PMC free article] [PubMed] [Google Scholar]
- [47].Shi K, Demir O, Carpenter MA, Wagner J, Kurahashi K, Harris RS, Amaro RE, and Aihara H (2017) Conformational Switch Regulates the DNA Cytosine Deaminase Activity of Human APOBEC3B, Sci Rep 7, Article number: 17415. [DOI] [PMC free article] [PubMed] [Google Scholar]
Associated Data
This section collects any data citations, data availability statements, or supplementary materials included in this article.