

Abstract
There is a paucity of information on the foraging ecology, especially individual use of sea-ice features and icebergs, over the non-breeding season in many seabird species. Using geolocators and stable isotopes, we defined the movements, distribution and diet of adult Antarctic petrels Thalassoica antarctica from the largest known breeding colony, the inland Svarthamaren, Antarctica. More specifically, we examined how sea-ice concentration and free-drifting icebergs affect the distribution of Antarctic petrels. After breeding, birds moved north to the marginal ice zone (MIZ) in the Weddell sector of the Southern Ocean, following its northward extension during freeze-up in April, and they wintered there in April–August. There, the birds stayed predominantly out of the water (60–80% of the time) suggesting they use icebergs as platforms to stand on and/or to rest. Feather δ15N values encompassed one full trophic level, indicating that birds fed on various proportions of crustaceans and fish/squid, most likely Antarctic krill Euphausia superba and the myctophid fish Electrona antarctica and/or the squid Psychroteuthis glacialis. Birds showed strong affinity for the open waters of the northern boundary of the MIZ, an important iceberg transit area, which offers roosting opportunities and rich prey fields. The strong association of Antarctic petrels with sea-ice cycle and icebergs suggests the species can serve, year-round, as a sentinel of environmental changes for this remote region.
Keywords: geolocation, austral winter distribution, sea-ice concentration, iceberg, activity pattern, lunar cycle
1. Introduction
Unlike the Arctic and its constantly decreasing sea-ice extent, Antarctica experienced contrasting trends over the last three decades, with record maximum and minimum sea-ice extent within a few years [1–3]. Recently, the winter sea ice in the Antarctic Peninsula [4] and Weddell Sea region has been decreasing [5,6], coinciding with higher rates of iceberg calving and with large consequences for ecosystems associated with sea ice [7,8]. Marine predators using the pack-ice zone, polynyas or icebergs are thus expected to be impacted by these changes [9–13]. Among those, the Antarctic petrel (Thalassoica antarctica) is a wide-ranging species and year-round resident of Antarctic waters [14]. Antarctic petrels generally forage in close association with sea ice, cold water-masses and icebergs [9,14–18], where they capture primarily pelagic fish and crustaceans [19,20]. As such, any change in the icescape may have immediate consequences for petrel demography [21] and probably for their survival rate, as has been shown in other seabird species [22]. In this context, the non-breeding season, spanning several months of the austral winter, may constitute a critical period affecting population dynamics through an effect on individual survival [23]. Understanding how changes in the cryosphere during the non-breeding season affect vital rates is thus important, especially because of a general paucity of biological information during the winter months for Antarctic species. The relationships between seabirds and the sea-ice edge/iceberg habitats in Antarctica were examined in the past using at-sea observation data [10,24,25]. It was supported that physical rather than biological variables affect species assemblages [10,25], highlighting the effect of pack-ice zone (sea-ice edge and pack-ice extent) on the occurrence of Antarctic petrels. Yet, at-sea observations preclude linking ice habitats to individual strategy. Here, using 2 years of individual, longitudinal tracking data and stable isotopes, we examined the foraging ecology of Antarctic petrels over the non-breeding season and investigated how physical factors, mainly the sea-ice and icebergs affect birds distribution during this period.
2. Material and methods
Two types of miniature geolocating loggers (GLS; MK4083, Biotrack, UK, during the second season only, and LAT2500, Lotek, Canada, during the two seasons, less than 1% of the bird body mass, electronic supplementary material) were deployed on a total of 86 Antarctic petrels breeding at the world's largest known colony (Svarthamaren, Dronning Maud Land, Antarctica, 71°53′ S, 5°10′ E) in December 2011 (n = 30) and 2012 (n = 56). In the subsequent breeding seasons, returning birds were recaptured at their nests to retrieve their device and three to six body feathers were sampled from the lower back of most individuals. Sixteen birds were tracked two winter seasons in a row, i.e. they were instrumented in 2011, recaptured in 2012, re-instrumented in 2012 and recaptured again in 2013. Feather stable isotope values (δ13C and δ15N) were determined after recapture of the birds carrying GLS. Feathers reflect the diet at the time they were grown, because keratin is inert after synthesis [26–28]. In Antarctic fulmarine petrels, body moult is a gradual process extending over at least four months. It begins during late incubation, but most body feathers grow in the weeks following the completion of breeding [9,29]. Since the precise timing of synthesis of a given body feather was not known, isotopic measurements were performed on three to six fully grown feathers per bird. It is likely that most body feathers reflected dietary information about the previous inter-breeding period, i.e. moult, corresponding to the GLS tracking period [30]. It is important to note that we never observed any moulting feather on any of the handled birds during the breeding season, which suggests that Antarctic petrels in our study area start their moulting process later in the breeding season or after. For further details on the stable isotope method on body feathers and the moulting pattern of Antarctic petrels see the electronic supplementary material.
Geolocators provided light-level data used to calculate geographical positions (for procedures, see [20]). We restricted the analysis of the data from 15 April to 31 August in 2012 and 2013 to focus on the core period of the non-breeding season and exclude the equinoxes when latitude cannot be calculated. Distances to the breeding colony and to sea-ice edge (less than 15% in sea-ice concentration (SIC)) were calculated at each location. The geolocators also recorded saltwater immersion (wet/dry), providing data on birds' activity (on water or on ice/flying). Two types of devices were used (see electronic supplementary material) and for activity analysis we used only data from Biotrack devices from 2013, as they record cumulative time spent in each activity. More precisely, the Biotrack devices test for immersion in seawater every 3 s and record the proportion of time spent in each activity every 10 min. Although we do not know the sequences or the duration of the wet and dry periods during those 10 min, the devices still give a more complete image of the activity than the Lotek loggers would. The effect of moon (lunar phase and moon illumination) on activity pattern was examined using general linear mixed-effects models (see electronic supplementary material for further details).
Because sea ice influences the behaviour of Antarctic petrels [17] and after considering collinearity among variables (electronic supplementary material, table S1), only four environmental covariates were kept to explain variations in the distribution of birds. SIC, the area covered by small icebergs (sm.ice, icebergs less than 3 km, in km2) and the residence time of large icebergs (la.ice, icebergs greater than 5 km, in days), as well as the sea surface height (SSH, as a proxy to define the location of fronts according to contour methods, introduced in [31]) were extracted and calculated as gridded (2° × 2° cell resolution) monthly values from April to August in 2012 and 2013 (electronic supplementary material). The effect of the covariates on the presence/absence of birds in a given cell was examined using generalized additive mixed-effects models (GAMMs), applying a separate smoothing function to each predictor variable (see supplementary material for statistical details). Generalized linear mixed-effects models were used to test the effects of distance to sea-ice edge and distance to colony. All tests were conducted in R v. 3.5.2 [32].
3. Results
A total of 69 bird-seasons were recovered over the two seasons, of which 64 yielded exploitable data (n = 25 bird-seasons in 2012, all devices from Lotek; n = 39 bird-seasons in 2013, 23 and 16 from Biotrack and Lotek, respectively) for a grand total of 48 individuals instrumented. Over the austral winter months, Antarctic petrels generally followed the expansion and subsequent recession of the sea-ice, being closest to the sea-ice edge around the midwinter (figures 1 and 2a). Although birds went farther away from the colony in 2012 than in 2013, the distance between the birds and the ice edge did not change across years (electronic supplementary material, tables S2 and S3). Antarctic petrels travelled up to 3000 km from the colony (figure 2a; electronic supplementary material, tables S2 and S3) and the average distance to the north of the sea-ice edge stayed relatively constant (around 500 km) throughout the winter (figure 2a). In this wintering area, petrels spent on average around 60% of their daytime in a dry state (either in flight or on the ice, figure 2b), with this proportion increasing to 80% during the night. The activity of birds was found not to be influenced by lunar cycle during austral winter (electronic supplementary material, tables S5–S11; figure S1). GAMMs showed the importance of all the variables considered here (SIC, icebergs and SSH) in explaining the distribution of petrels (electronic supplementary material, table S4). In particular, Antarctic petrels always preferred ‘open-water’ zones, where SIC is less than 15%, and the probability of presence of the birds was above 0.5 when small icebergs (less than 3 km, figure 2c) were present and significantly increased with iceberg sizes, especially in June (electronic supplementary material, figure S2 and table S4; table 1). For large icebergs, although there was a statistical trend, we found a bimodal pattern that was difficult to interpret (figure 2c). Finally, presence probability of Antarctic petrels decreased drastically for SSH above a range of −0.6 to −0.3 m (roughly corresponding to the Polar Front) and birds were not recorded where SSH exceeded +0.6 m (Subtropical Front), indicating that they stayed and foraged almost exclusively within the Antarctic Zone, south of the Polar Front (table 1 and figures 1 and 2c; electronic supplementary material, figure S2).
Figure 1.

Monthly distribution of Antarctic petrels during the non-breeding period with surface area of small icebergs (in km2, colour-coded according to a green-pink scale), SIC (blue) and maximum sea-ice extent (dark blue line). Polygons depict 95% (dotted), 50% (dashed) and 30% (solid) at-sea utilization distributions of petrels from the Svarthamaren breeding colony (black cross), Dronning Maud Land, Antarctica. Grey line shows the monthly position of the Polar Front (SHH = −0.58 m, [33]).
Figure 2.

(a) Average distance (±s.d.) of Antarctic petrels foraging to the north of the breeding colony (black and grey circles for 2012 and 2013, respectively) and to the north of the sea-ice edge (dark grey triangles). Distance to sea-ice edge was pooled for the 2 years as there was no significant difference between the years (see electronic supplementary material, table S2). (b) Proportion (±s.e.) of time Antarctic petrels spent in a dry state (out of water) by months over 2013 during daytime (open circles) and at night (closed circles). (c) Estimated smoothing curves (±s.e.) for environmental covariates in relation with the presence probability of petrels. Covariates considered are small (size of icebergs less than 3 km long) and large (residence time of icebergs greater than 5 km long) icebergs, sea-ice concentration (SIC, %) and sea surface height (SSH, in m). Months and years were used as fixed effects, and individuals as random effect.
Table 1.
Results of the GAMM explaining the presence/absence of Antarctic petrels as a function of environmental covariates. Variables selected in the best model and reference value occurrences are 2012 and April, respectively. The model explained 26.9% of the deviance.
| term | estimate | s.e | statistic | p-value | |
|---|---|---|---|---|---|
| parametric coefficients | intercept | −9.74 | 0.37 | −26.44 | <0.001 |
| 2013 | 0.12 | 0.05 | 2.66 | <0.01 | |
| May | 0.82 | 0.05 | 16.08 | <0.001 | |
| June | 1.47 | 0.05 | 28.72 | <0.001 | |
| July | 1.91 | 0.05 | 35.28 | <0.001 | |
| August | 2.83 | 0.05 | 54.04 | <0.001 | |
| term | edf | ref.df | statistic | p-value | |
| smooth terms | s(small icebergs) | 3.28 | 3.60 | 166.60 | <0.001 |
| s(large icebergs) | 3.91 | 3.99 | 105.34 | <0.001 | |
| s(sea ice concentration) | 3.95 | 4.00 | 2523.92 | <0.001 | |
| s(sea surface height) | 3.88 | 3.99 | 6257.35 | <0.001 | |
| s(bird ID) | 41.42 | 45.00 | 856.54 | <0.001 |
Body feather δ13C and δ15N values (n = 139) averaged −25.0 ± 0.7 and 9.2 ± 0.6‰, respectively. They encompassed large ranges, amounting to differences of 4.0‰ (from −27.1 to −23.1‰) and 3.4‰ (from 7.8 to 11.2‰). At the individual level (n = 16 and 19 in 2012 and 2013, respectively), δ13C and δ15N values ranged from −25.8 ± 1.5 to −23.9 ± 0.7‰, and from 8.2 ± 0.6 to 10.5 ± 0.6‰, respectively (figure 3).
Figure 3.
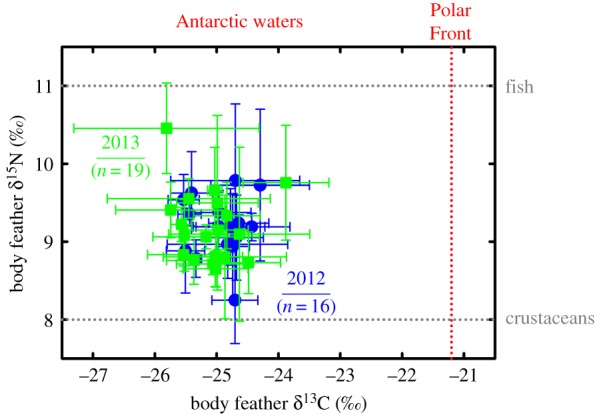
Feather δ15N versus δ13C values of Antarctic petrels from the inland colony of Svarthamaren in 2012 (blue) and 2013 (green). Values are means ± s.d. with four body feathers per individual bird. Vertical dotted line in red represents the δ13C estimate of the Polar Front [34]. The two horizontal dotted lines in grey correspond to the δ15N estimates of a fish-based diet (upper line) and a crustacean-based diet (lower line), as measured in the feathers of chicks from the crustacean-eater chinstrap penguin Pygoscelis antarctica in [35] and the fish-eater king penguin Aptenodytes patagonicus in [36] (see the electronic supplementary material).
4. Discussion
During summer, Antarctic petrels track the phenology of the sea ice over the breeding season, i.e. they target ice-melting areas as preferred foraging grounds [9]. Here, we show that this tight link with sea ice extends throughout the non-breeding period, with birds tracking the phenology of the sea-ice advance foraging primarily in open waters associated with icebergs. This seems to be in line with the fact that food availability at the surface appeared not to decrease in pack ice (contrary to open water) during winter [37,38].
Our results demonstrate the role that the marginal ice zone (MIZ, see [39])—a dynamic and biologically active region that transitions from the dense inner pack-ice zone to ice-free open ocean (e.g. [40,41])—plays in driving the distribution of Antarctic petrels during the winter months, as has been reported for other seabirds in the Arctic [42,43]. Birds remain within a large belt that stretches from the northern physical edge of the pack ice defined by satellite measurement (open water being defined here and elsewhere as cells where SIC was less than 15%; [44]) to the Polar Front in the North. This foraging zone included the progressively narrowing seasonal ice zone (SIZ) in the south and the permanent open ocean zone (POOZ) in the north. Stable isotopes confirmed this pattern, with all δ13C values being highly negative, indicating foraging exclusively south of the Polar Front during the body feather moulting period. The single dietary study on Antarctic petrels during winter highlighted the importance of two prey, the myctophid Electrona antarctica and the squid Psychroteuthis glacialis [45]. Those two organisms have similar high δ15N values that preclude differentiation [46,47], thus contrasting with the lower value of a third key prey species [19,20], the Antarctic krill Euphausia superba [46]. Feather δ15N values encompassed one full trophic level, meaning that prey ranged from crustacean (most likely Eu. superba) to fish/squid (El. antarctica/P. glacialis), with diet including various proportions of the two groups in most cases (figure 3). The behaviour of petrels was well known to be impacted by the lunar phase, through the influence on their activity level at breeding colonies or on their activity at sea during or outside the breeding period [48–51]. The lunar cycle is believed to strongly influence the vertical distribution of potential marine prey species, making them more accessible and/or visible to their predators [48,50]. Interestingly, and in contradiction with these references, the behaviour of Antarctic petrels was not affected by the lunar cycle at the fine temporal scale of our study, while the potential prey, namely myctophid fish and Eu. superba, both perform diel vertical migration and are known to be influenced by the moonlight. This contradiction requires further investigations.
The Polar Front coincides with the northern boundary of the iceberg occurrence [52]. It represents a highly dynamic and heterogeneous region where the ice platform breaks, creating zones of mixing and turmoil, but also a corridor for icebergs that originate mostly from the ice shelves in the Weddell Sea and drift with the Antarctic Circumpolar Current [53,54]. Interestingly, the activity data indicated that petrels were predominantly out of the water (60–80% of the time), to a degree similar to that recorded during the chick-rearing season, when birds spend extended periods of time at their nest between trips at sea [55]. The Antarctic petrels are frequently observed to rest and huddle on ice surfaces (floes and bergs) [10]. This strongly suggests that Antarctic petrels use icebergs as platforms to stand on and/or rest during winter, although it was not possible to confirm this with the coarse scale at which petrels were, by necessity, tracked in our study. The exact nature of the interaction between the petrels and the icebergs remains to be elucidated, but recent reports of icebergs being visited by a wide range of foraging seabirds, including Antarctic petrels [16,18], supports the view that these structures constitute important features shaping seabirds' distribution. Icebergs are associated with higher ocean net primary productivity, especially in the SIZ and POOZ, suggesting a role of hotspots of biological activity for these features [8,54,56–58]. This association is relevant in the context of an observed increase in iceberg occurrence over the last decades in the southern Atlantic section of the Southern Ocean, in conjunction with global warming [7,8,53,59,60].
5. Conclusion
The Antarctic petrel is associated throughout its annual cycle with icebergs and/or open waters that follow the large-scale seasonal sea-ice movements. We demonstrated that the birds were associated during the entire inter-breeding period with MIZ (icescape: pack-ice zone, sea-ice edge, cold water-masses and icebergs) and frontal system, confirming at-sea observations. Our individual tracking investigation allowed us to analyse processes involved at the individual level (temporal and spatial scale) on distribution and behaviour throughout the entire inter-breeding period. This brings new longitudinal insights on effects of environmental parameters on distribution during austral winter over a large oceanic area. The Antarctic petrel was previously found to forage mainly on myctophid fish and krill during the breeding period [10]. Feather stable isotope values suggest that birds also feed on krill and myctophids during the non-breeding period, so that it is reasonable to assume that the Antarctic petrel can be used as a good indicator of prey availability throughout the year. This association makes the species a relevant sentinel of environmental changes, like the closely related fulmarine snow petrel Pagodroma nivea [61], the emperor Aptenodytes forsteri [62] and the Adélie Pygoscelis adeliae [63] penguins do in other areas of the Antarctic. Hence, we encourage ecological studies to be conducted more broadly on this species, in various Antarctic locations, so as to help provide key information on environmental changes to conservation bodies, e.g. the Commission for the Conservation of Antarctic Marine Living Resources (https://www.ccamlr.org).
Supplementary Material
Acknowledgements
We thank all the fieldworkers who contributed to collecting the data, R. Reisinger for help with statistical modelling and S. Harris for the revision of the English version. H. Lormée was an active helper in the CEBC ThinkTank morning sessions. The authors thank the anonymous referees for helpful reviews and constructive suggestions to improve the manuscript.
Ethics
All capture and handling procedures were in accordance with the permits provided by the Norwegian Animal Research Authority (NARA/FDU permit nos. 3714 and 5746).
Data accessibility
Datasets supporting this article were uploaded as part of the electronic supplementary material.
Authors' contributions
Study design: K.D., S.D., A.T. and Y.C. Fieldwork: S.D., A.T. and Y.C. Data analysis and processing: K.D., A.K., C.C., F.O., A.T., Y.C. and K.D. wrote the text and all authors edited and revised the manuscript, gave final approval for publication and agreed to be held accountable for the content therein.
Competing interests
We declare we have no competing interests.
Funding
Funding was provided by the Norwegian research council (NARE programme). This study is a contribution to programme SENSEI (grant agreement no. 2017-00000006497 to C. Barbraud and Y.R.-C.) funded by the BNP Paribas Foundation.
References
- 1.Parkinson CL, Cavalieri DJ. 2012. Antarctic sea ice variability and trends, 1979–2010. Cryosphere 6, 871–880. ( 10.5194/tc-6-871-2012) [DOI] [Google Scholar]
- 2.Parkinson CL, Cavalieri DJ. 2008. Arctic sea ice variability and trends, 1979–2006. J. Geophys. Res.-Oceans 113, C07003 ( 10.1029/2007JC004558) [DOI] [Google Scholar]
- 3.Turner J, Overland J. 2009. Contrasting climate change in the two polar regions. Polar Res. 28, 146–164. ( 10.1111/j.1751-8369.2009.00128.x) [DOI] [Google Scholar]
- 4.Turner J, Bindschadler R, Convey P, di Prisco G, Fahrbach E, Gutt J, Hodgson D, Mayewski P, Summerhayes C.. 2009. Antarctic climate change and the environment Cambridge, UK: Scientific Committee on Antarctic Research. [Google Scholar]
- 5.Jones JM, et al. 2016. Assessing recent trends in high-latitude Southern Hemisphere surface climate. Nat. Clim. Change 6, 917–926. ( 10.1038/NCLIMATE3103) [DOI] [Google Scholar]
- 6.Vaughan DG, Marshall GJ, Connolley WM, King JC, Mulvaney R. 2001. Climate change: devil in the detail. Science 293, 1777–1779. ( 10.1126/science.1065116) [DOI] [PubMed] [Google Scholar]
- 7.Merino N, Le Sommer J, Durand G, Jourdain NC, Madec G, Mathiot P, Tournadre J. 2016. Antarctic icebergs melt over the Southern Ocean: climatology and impact on sea ice. Ocean Model. 104, 99–110. ( 10.1016/j.ocemod.2016.05.001) [DOI] [Google Scholar]
- 8.Wu S-Y, Hou S. 2017. Impact of icebergs on net primary productivity in the Southern Ocean. Cryosphere 11, 707–722. ( 10.5194/tc-11-707-2017) [DOI] [Google Scholar]
- 9.Marchant S, Higgins PJ. 1990. Handbook of Australian, New Zealand and Antarctic birds. Melbourne, Australia: Oxford University Press. [Google Scholar]
- 10.Ainley DG, Ribic CA, Spear LB. 1993. Species-habitat relationships amongst Antarctic seabirds: a function of physical or biological factors? The Condor 95, 806–816. ( 10.2307/1369419) [DOI] [Google Scholar]
- 11.Lefebvre W, Goosse H. 2008. Analysis of the projected regional sea-ice changes in the Southern Ocean during the twenty-first century. Clim. Dyn. 30, 59–76. ( 10.1007/s00382-007-0273-6) [DOI] [Google Scholar]
- 12.Chambert T, Rotella JJ, Garrott RA. 2012. Environmental extremes versus ecological extremes: impact of a massive iceberg on the population dynamics of a high-level Antarctic marine predator. Proc. R. Soc. B 279, 4532–4541. ( 10.1098/rspb.2012.1733) [DOI] [PMC free article] [PubMed] [Google Scholar]
- 13.Labrousse S, et al. 2017. Under the sea ice: exploring the relationship between sea ice and the foraging behaviour of southern elephant seals in East Antarctica. Prog. Oceanogr. 156, 17–40. ( 10.1016/j.pocean.2017.05.014) [DOI] [Google Scholar]
- 14.van Franeker JA, Gavrilo M, Mehlum F, Veit RR, Woehler EJ. 1999. Distribution and abundance of the Antarctic petrel. Waterbirds 22, 14–28. ( 10.2307/1521989) [DOI] [Google Scholar]
- 15.Ainley DG, O'Connor EF, Boekelheide RJ. 1984. The marine ecology of birds in the Ross Sea, Antarctica. Ornithol. Monogr. 32, 1–97. ( 10.2307/40166773) [DOI] [Google Scholar]
- 16.Ruhl HA, Ellena JA, Wilson RC, Helly J. 2011. Seabird aggregation around free-drifting icebergs in the northwest Weddell and Scotia Seas. Deep-Sea Res. Part II-Top. Stud. Oceanogr. 58, 1497–1504. ( 10.1016/j.dsr2.2010.11.028) [DOI] [Google Scholar]
- 17.Fauchald P, Tarroux A, Tveraa T, Cherel Y, Ropert-Coudert Y, Kato A, Love OP, Varpe O, Descamps S. 2017. Spring phenology shapes the spatial foraging behavior of Antarctic petrels. Mar. Ecol. Prog. Ser. 568, 203–215. ( 10.3354/meps12082) [DOI] [Google Scholar]
- 18.Joiris CR. 2018. Seabird hotspots on icebergs in the Amundsen Sea, Antarctica. Polar Biol. 41, 111–114. ( 10.1007/s00300-017-2174-4) [DOI] [Google Scholar]
- 19.Lorentsen SH, Klages N, Rov N. 1998. Diet and prey consumption of Antarctic petrels Thalassoica antarctica at Svarthamaren, Dronning Maud Land, and at sea outside the colony. Polar Biol. 19, 414–420. ( 10.1007/s003000050267) [DOI] [Google Scholar]
- 20.Descamps S, et al. 2016. At-sea distribution and prey selection of antarctic petrels and commercial krill fisheries. PLoS ONE 11, e0156968 ( 10.1371/journal.pone.0156968) [DOI] [PMC free article] [PubMed] [Google Scholar]
- 21.Descamps S, Tarroux A, Lorentsen S-H, Love OP, Varpe O, Yoccoz NG. 2016. Large-scale oceanographic fluctuations drive Antarctic petrel survival and reproduction. Ecography 39, 496–505. ( 10.1111/ecog.01659) [DOI] [Google Scholar]
- 22.Jenouvrier S, Barbraud C, Weimerskirch H. 2003. Effects of climate variability on the temporal population dynamics of southern fulmars. J. Anim. Ecol. 72, 576–587. ( 10.1046/j.1365-2656.2003.00727.x) [DOI] [PubMed] [Google Scholar]
- 23.Fretwell SD. 1972. Populations in a seasonal environment. Princeton, NJ: Princeton University Press. [PubMed] [Google Scholar]
- 24.Ainley D, Jacobs S. 1981. Sea-bird affinities for ocean and ice boundaries in the Antarctic. Deep-Sea Res . 28A, 1173–1185. ( 10.1016/0198-0149(81)90054-6) [DOI] [Google Scholar]
- 25.Fraser WR, Ainley DG. 1986. Ice edges and seabird occurrence in Antarctica. BioScience 36, 258–263. ( 10.2307/1310216) [DOI] [Google Scholar]
- 26.Hobson KA, Clark RG. 1992. Assessing avian diets using stable isotopes I: turnover of 13C in tissues. The Condor 94, 181–188. ( 10.2307/1368807) [DOI] [Google Scholar]
- 27.Hobson KA, Clark RG. 1993. Turnover of 13C in cellular and plasma fractions of blood: implications for non destructive sampling in avian dietary studies. The Auk 110, 638–641. ( 10.2307/4088430) [DOI] [Google Scholar]
- 28.Bearhop S, Waldron S, Votier SC, Furness RW. 2002. Factors that influence assimilation rates and fractionation of nitrogen and carbon stable isotopes in avian blood and feathers. Physiol. Biochem. Zool. 75, 451–458. ( 10.1086/342800) [DOI] [PubMed] [Google Scholar]
- 29.Beck J. 1970. Breeding seasons and moult in some smaller Antarctic petrels. Antarct. Ecol. 1, 542–550. [Google Scholar]
- 30.Cherel Y, Hobson KA, Weimerskirch H. 2000. Using stable-isotope analysis of feathers to distinguish moulting and breeding origins of seabirds. Oecologia 122, 155–162. ( 10.1007/PL00008843) [DOI] [PubMed] [Google Scholar]
- 31.Sokolov S, Rintoul SR. 2002. Structure of Southern Ocean fronts at 140 E. J. Mar. Syst. 37, 151–184. ( 10.1016/S0924-7963(02)00200-2) [DOI] [Google Scholar]
- 32.R Core Team. 2019. R: A language and environment for statistical computing. Vienna, Austria: R Foundation for Statistical Computing; See https://www.R-project.org/. [Google Scholar]
- 33.Venables H, Meredith MP, Atkinson A, Ward P. 2012. Fronts and habitat zones in the Scotia Sea. Deep Sea Res. Part II Top. Stud. Oceanogr. 59, 14–24. ( 10.1016/j.dsr2.2011.08.012) [DOI] [Google Scholar]
- 34.Jaeger A, Lecomte VJ, Weimerskirch H, Richard P, Cherel Y. 2010. Seabird satellite tracking validates the use of latitudinal isoscapes to depict predators' foraging areas in the Southern Ocean. Rapid Commun. Mass Spectrom. 24, 3456–3460. ( 10.1002/rcm.4792) [DOI] [PubMed] [Google Scholar]
- 35.Polito MJ, Trivelpiece WZ, Patterson WP, Karnovsky NJ, Reiss CS, Emslie SD. 2015. Contrasting specialist and generalist patterns facilitate foraging niche partitioning in sympatric populations of Pygoscelis penguins. Mar. Ecol. Prog. Ser. 519, 221–237. ( 10.3354/meps11095) [DOI] [Google Scholar]
- 36.Cherel Y, Hobson KA, Bailleul F, Groscolas R. 2005. Nutrition, physiology, and stable isotopes: new information from fasting and molting penguins. Ecology 86, 2881–2888. ( 10.1890/05-0562) [DOI] [Google Scholar]
- 37.Ainley D, Fraser W, Sullivan C, Torres J, Hopkins T, Smith W. 1986. Antarctic mesopelagic micronekton: evidence from seabirds that pack ice affects community structure. Science 232, 847–849. ( 10.1126/science.232.4752.847) [DOI] [PubMed] [Google Scholar]
- 38.Ainley D, Ribic C, Fraser W. 1994. Ecological structure among migrant and resident seabirds of the Scotia-Weddell confluence region. J. Anim. Ecol. 63, 347–364. ( 10.2307/5553) [DOI] [Google Scholar]
- 39.Massom RA, Stammerjohn SE. 2010. Antarctic sea ice change and variability—physical and ecological implications. Polar Sci. 4, 149–186. ( 10.1016/j.polar.2010.05.001) [DOI] [Google Scholar]
- 40.Wadhams P, Martin S. 2001. Ice in the Ocean. Arctic 54, 192. [Google Scholar]
- 41.Squire V. 2007. Of ocean waves and sea-ice revisited. Cold Reg. Sci. Technol. 49, 110–133. ( 10.1016/j.coldregions.2007.04.007) [DOI] [Google Scholar]
- 42.Divoky GJ, Douglas DC, Stenhouse IJ. 2016. Arctic sea ice a major determinant in Mandt's black guillemot movement and distribution during non-breeding season. Biol. Lett. 12, 20160275 ( 10.1098/rsbl.2016.0275) [DOI] [PMC free article] [PubMed] [Google Scholar]
- 43.Gilg O, et al. 2016. Living on the edge of a shrinking habitat: the ivory gull, Pagophila eburnea, an endangered sea-ice specialist. Biol. Lett. 12, 20160277 ( 10.1098/rsbl.2016.0277) [DOI] [PMC free article] [PubMed] [Google Scholar]
- 44.Cavalieri D, Germain KS. 1995. Arctic sea ice research with satellite passive microwave radiometers. IEEE-GRSS Newsl. 97, 6–12. [Google Scholar]
- 45.Ainley D, Fraser W, Smith W, Hopkins T, Torres J. 1991. The structure of upper level pelagic food webs in the Antarctic: effect of phytoplankton distribution. J Mar. Syst. 2, 111–122. ( 10.1016/0924-7963(91)90017-O) [DOI] [Google Scholar]
- 46.Cherel Y. 2008. Isotopic niches of emperor and Adélie penguins in Adélie Land, Antarctica. Mar. Biol. 154, 813–821. ( 10.1007/s00227-008-0974-3) [DOI] [Google Scholar]
- 47.Cherel Y, et al. 2011. Isotopic niches of fishes in coastal, neritic and oceanic waters off Adélie Land, Antarctica. Polar Sci. 5, 286–297. ( 10.1016/j.polar.2010.12.004) [DOI] [Google Scholar]
- 48.Yamamoto T, Takahashi A, Yoda K, Katsumata N, Watanabe S, Sato K, Trathan PN. 2008. The lunar cycle affects at-sea behaviour in a pelagic seabird, the streaked shearwater, Calonectris leucomelas. Anim. Behav. 76, 1647–1652. ( 10.1016/j.anbehav.2008.07.019) [DOI] [Google Scholar]
- 49.Dias MP, Romero J, Granadeiro JP, Catry T, Pollet IL, Catry P. 2016. Distribution and at-sea activity of a nocturnal seabird, the Bulwer's petrel Bulweria bulwerii, during the incubation period. Deep Sea Res. Part I: Oceanogr. Res. Pap. 113, 49–56. ( 10.1016/j.dsr.2016.03.006) [DOI] [Google Scholar]
- 50.Ramos R, Ramirez I, Paiva VH, Militao T, Biscoito M, Menezes D, Phillips RA, Zino F, Gonzalez-Solis J. 2016. Global spatial ecology of three closely-related gadfly petrels. Sci. Rep. 6, 1–11. ( 10.1038/srep23447) [DOI] [PMC free article] [PubMed] [Google Scholar]
- 51.Waap S, Symondson WO, Granadeiro JP, Alonso H, Serra-Gonçalves C, Dias MP, Catry P. 2017. The diet of a nocturnal pelagic predator, the Bulwer's petrel, across the lunar cycle. Sci. Rep. 7, 1384 ( 10.1038/s41598-017-01312-3) [DOI] [PMC free article] [PubMed] [Google Scholar]
- 52.Romanov YA, Romanova NA, Romanov P. 2017. Geographical distribution and volume of Antarctic icebergs derived from ship observation data. Ann. Glaciol. 58, 28–40. ( 10.1017/aog.2017.2) [DOI] [Google Scholar]
- 53.Tournade J, Girard-Ardhuin F, Legrésy B. 2012. Antarctic icebergs distributions, 2002–2010. J. Geophys. Res. 117, C05004 ( 10.1029/2011JC007441) [DOI] [Google Scholar]
- 54.Vernet M, et al. 2012. Islands of ice: influence of free-drifting Antarctic icebergs on pelagic marine ecosystems. Oceanography 25, 38–39. ( 10.5670/oceanog.2012.72) [DOI] [Google Scholar]
- 55.Tarroux A, et al. 2016. Flexible flight response to challenging wind conditions in a commuting Antarctic seabird: do you catch the drift? Anim. Behav. 113, 99–112. ( 10.1016/j.anbehav.2015.12.021) [DOI] [Google Scholar]
- 56.Schwarz JN, Schodlok MP. 2009. Impact of drifting icebergs on surface phytoplankton biomass in the Southern Ocean: ocean colour remote sensing and in situ iceberg tracking. Deep-Sea Res. Part I: Oceanogr. Res. Pap. 56, 1727–1741. ( 10.1016/j.dsr.2009.05.003) [DOI] [Google Scholar]
- 57.Smith KL, Robison BH, Helly JJ, Kaufmann RS, Ruhl HA, Shaw TJ, Twining BS, Vernet M. 2007. Free-drifting icebergs: hot spots of chemical and biological enrichment in the Weddell Sea. Science 317, 478–482. ( 10.1126/science.1142834) [DOI] [PubMed] [Google Scholar]
- 58.Duprat LPAM, Bigg GR, Wilton DJ. 2016. Enhanced Southern Ocean marine productivity due to fertilization by giant icebergs. Nat. Geosci. 9, 728 ( 10.1038/NGEO2809) [DOI] [Google Scholar]
- 59.Ballantyne J, Long DG.. 2002. A multidecadal study of the number of antarctic icebergs using scatterometer data In IEEE Int. Geoscience and Remote Sensing Symp., Toronto, Canada, 24–28 June. IEEE. [Google Scholar]
- 60.Long DG, Ballantyne J, Bertois C. 2002. Is the number of Antarctic icebergs really increasing? EOS Trans. Amer. Geophys. Union 83, 469–474. ( 10.1029/2002EO000330) [DOI] [Google Scholar]
- 61.Sauser C, Delord K, Barbraud C. 2018. Increased sea ice concentration worsens fledging condition and juvenile survival in a pagophilic seabird, the snow petrel. Biol. Lett. 14, 20180140 ( 10.1098/rsbl.2018.0140) [DOI] [PMC free article] [PubMed] [Google Scholar]
- 62.Jenouvrier S, Holland M, Stroeve J, Barbraud C, Weimerskirch H, Serreze M, Caswell H. 2012. Effects of climate change on an emperor penguin population: analysis of coupled demographic and climate models. Glob. Change Biol. 18, 2756–2770. ( 10.1111/j.1365-2486.2012.02744.x) [DOI] [PubMed] [Google Scholar]
- 63.Ainley D. 2002. The Adélie penguin: bellwether of climate change. New York, NY: Columbia University Press. [Google Scholar]
Associated Data
This section collects any data citations, data availability statements, or supplementary materials included in this article.
Supplementary Materials
Data Availability Statement
Datasets supporting this article were uploaded as part of the electronic supplementary material.