Abstract
Chromosome errors, or aneuploidy, affect an exceptionally high number of human conceptions causing pregnancy loss and congenital disorders. Here we have followed chromosome segregation in human oocytes from females aged 9 to 43 years, and report that aneuploidy follows a U-curve. Specific segregation error types show different age dependencies, providing a quantitative explanation for the U-curve. Whole-chromosome nondisjunction events are preferentially associated with increased aneuploidy in young girls, whereas centromeric and more extensive cohesion loss limit fertility as women age. Our findings suggest that chromosomal errors originating in oocytes determine the curve of natural fertility in humans.
Natural fertility in humans follows an inverse U-curve, where teenagers (≥13) and women of advancing maternal age (AMA, mid 30s and above) show reduced rates (1). The curve differs substantially from chimpanzees, where fertility rates remain steady throughout their reproductive lifespan (fig S1A) (1). Reduced fertility towards both ends of the inverse U-curve in humans is assumed to depend on selective forces that balance risks and evolutionary fitness associated with childbearing (2–5). However, the mechanism(s) that shapes the fertility curve are unclear. Since chromosome errors in female meiosis cause substantial pregnancy loss due to aneuploid conceptions in women of advanced maternal age (fig. S1B) (6, 7), we speculated that meiotic error rates throughout the entire reproductive lifespan may shape natural fertility.
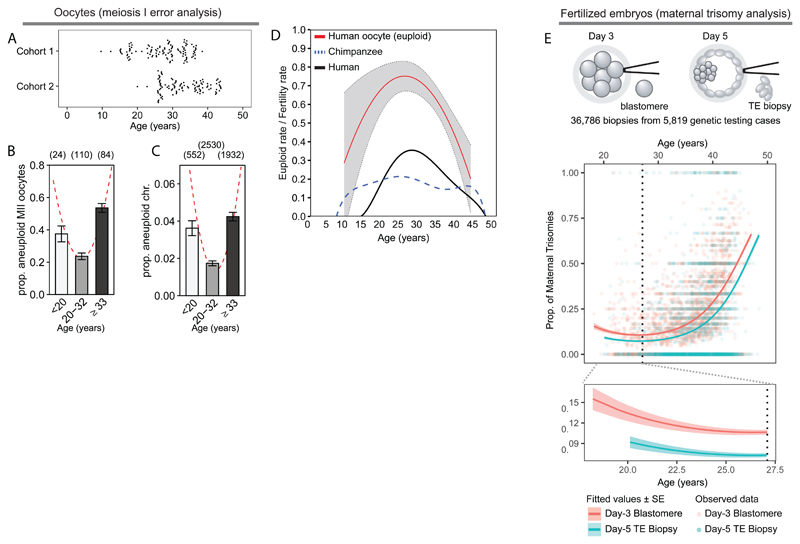
To address this, we used two sources of oocytes to determine aneuploidy rates that span females aged 9 to 43 years (fig. S2A; table S1). We obtained small antral follicles directly from ovarian tissue of unstimulated girls and women prior to chemotherapy for blood disorders and a range of cancers, excluding ovarian cancer (ages 9.1-38.8 years; fig. S2A-C, S3A; table S2; Methods). The age range overlapped with oocytes (mature and immature) from women receiving gonadotrophin-stimulation in IVF clinics (20-43 years), allowing us to validate findings in two independent patient cohorts (fig. 1A; fig. S2A-C; table S3, S4). Meiotic progression was similar between immature oocytes from the two cohorts (fig. S2-S7; table S2, S3, S5) and aneuploidy rates were not affected by maturation method (in vivo or in vitro) (8, 9), cohort, or technology (fig. S7-10; table S6-S8). Maternal age was the only significant factor that affected aneuploidy and the best-fit model was provided by a quadratic equation, suggestive of a U-curve of aneuploidy (χ2-of-deviance, p<0.001; pseudo-R2oocyte=0.10, pseudo-R2chromosome=0.12; fig. 1B-C). Both the slope from the mid-point (25.3 years) towards the younger oocytes, as well as upwards towards AMAs, contributed to the fit (χ2-of-deviance, p<0.05; pseudo-R2=0.137). A relatively modest rate of chromosome errors (1.7-4.2%) affects a large proportion of oocytes (23.6-53.5%; fig. 1B-C) providing a quantitative explanation for the suppression of fertility rates towards both ends of the U-curve, since a majority of even single-chromosome aneuploidies cause implantation failure or miscarriage. We conclude that the inverse U-curve of natural fertility is shaped by a corresponding U-curve of aneuploidy in human eggs (fig. 1D).
Fig. 1. Meiotic segregation errors follow a U-curve according to female age.
(A) Age ranges for aneuploidy analysis from cohort 1 (top) and cohort 2 (bottom).
(B and C) Aneuploidy rates of combined cohorts by (B) oocyte (n = 218) and (C) chromosome (n=5,014) analysed by NGS (n=90), chromosome spread (n=55), or SNP array (n=73) (table S1). Fitted curves in red. Error bars: standard error of a proportion.
(D) Oocyte euploid rate (1-aneuploidy rate; from fig. 1B) (red) with standard errors (grey), compared to age-specific fertility rates (ref. 1) in human (black) and chimpanzee (blue dotted line).
(E) Observed per-case proportions of embryos with one or more maternal meiotic chromosome gains (points). Lines indicate fitted values (dark) and standard errors across maternal age (pale). Sample type pink: day-3 blastomeres; blue: day-5 trophectoderm (TE) biopsies. (Top) A quadratic model fit to the full dataset (χ2-of-deviance, p<1×10-43; pseudo-R2=0.240). (Bottom) A linear model fit to patients younger than 27.1 years (dotted line; fig. S12), revealing a negative relationship with maternal age (β=-0.082, 95% CI [-0.157, 5.88×10⁻³], p=0.034).
We next tested the prediction that maternally inherited meiotic errors in preimplantation embryos should also follow a U-curve. We leveraged a published dataset consisting of 36,786 preimplantation embryo biopsies obtained during 5,819 cases of genetic testing for aneuploidy, where maternal and paternal haplotypes could be separated (10, 11). We found that a quadratic model provides a better fit than a linear model of maternal meiotic errors resulting in a trisomic embryo (χ2-of-deviance, p<3×10-43; pseudo-R2=0.240; fig. 1E). Consistent with our observations in human oocytes, meiotic errors declined significantly with female age within the lower age range (18-27.1 years; β=-0.082, 95% CI [-0.157 to 0.059], p<0.035; fig. S12). Thus, the U-curve of aneuploidy in human preimplantation embryos originates from female meiosis.
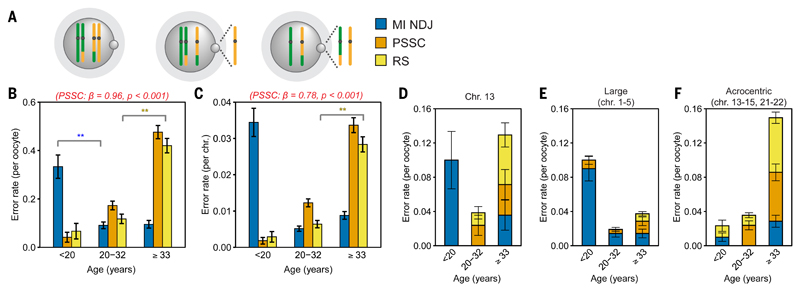
Our findings in oocytes and embryos suggest that the inverse U-curve of natural fertility is shaped by a chromosome-based mechanism (aneuploidy) that limits fertility in young and AMA. It was unclear, however, how the U-curve of aneuploidy rates emerges. To understand this, we inferred chromosome segregation at meiosis I and found the U-curve of aneuploidy to be a composite of three different error types (fig. 2A-C; fig. S13C). Meiosis I nondisjunction (MI NDJ), the gain or loss of a whole chromosome, decreased with female age (exact test, p<0.025; fig. 2B-C). In contrast, precocious separation of sister chromatids (PSSC) or predivision (12, 13), in which sister chromatids of one homolog separate in meiosis I, increased linearly with female age (βoocytes=0.96 and βchromosomes=0.78, p<0.001; fig. 2B-C). Reverse segregation (RS), when both homologous chromosomes split their two sister chromatids already at meiosis I (fig. S13) (14, 15), increased between the mid- and AMA groups (exact test, p<0.001; fig. 2B-C; table S9). Thus, this combination of distinct age-dependent error types shape the U-curve of aneuploidy in human oocytes.
Fig. 2. Meiosis I error types respond differentially to female age.
(A) Segregation error types.
(B and C) Rate of meiosis I error patterns by oocyte (B) and chromosome (C). Exact tests: p<0.05 (*) and p<0.025 (**). Beta and the p-value PSSC (red). Error bars: standard error of a proportion.
(D-F) Distinct age dependent segregation error trends identified for (D) chromosome 13, (E) the largest chromosomes (1-5; groups A & B), and (F) the acrocentric chromosomes (13-15, 21, and 22). Error bars: standard error of a proportion.
The aneuploidy curve is an average of all chromosomes. To understand how specific chromosomes respond to female age and contribute to the U-curve, we assessed segregation on a chromosomal level (fig. S14). Some chromosomes such as chromosome 13 followed the chromosome-averaged curve both in terms of the age response and the type of errors (fig. 2D). In contrast, the largest chromosomes were vulnerable to MI NDJ in the younger female group (fig. 2E) and the acrocentric chromosomes contributed disproportionately to PSSC and RS in the AMA group (fig. 2F). These observations suggest that chromosome-specific responses to maternal age underlie the U-curve of aneuploidy in human oocytes.
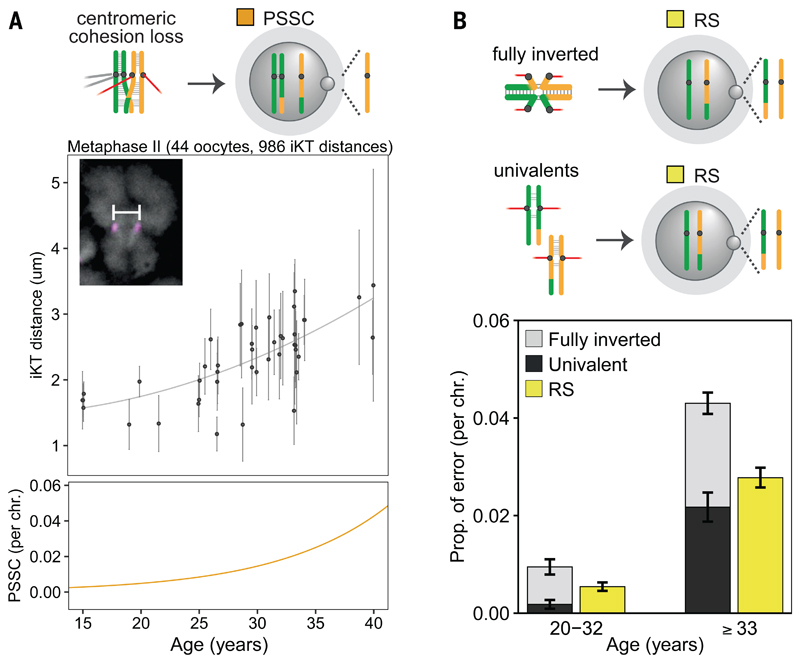
Current hypotheses of aneuploidy formation in human oocytes suggest that vulnerable crossover configurations (centromere-proximal, telomeric, or missing crossovers) and progressive weakening of sister chromatid cohesion during dictyate arrest disrupt the “bivalent” structure needed for accurate segregation in meiosis I (fig. S2A) (16–18). Cohesion weakening has been reported in human oocytes (19–22), but it is unclear how this translates to specific chromosome segregation outcomes, since cohesion weakening could give rise to all three meiosis I error types (fig. S2A). Previously centromeric cohesion was shown to weaken with advancing age (19–22). Our findings suggest this occurs in a linear fashion starting as young as 15 years of age (R2=0.24, p<0.001) and correlates with an elevation in PSSC (fig. 3A). We demonstrate that centromeric cohesion remained robust in teenagers, ruling out age-dependent effects that may act via cohesion perturbation to drive the elevated aneuploidy levels in teenagers. In contrast to centromeric cohesion weakening, more extensive cohesion loss, i.e., fully-inverted and deteriorated bivalents (univalents), where both sets of sister kinetochores form bipolar attachments in meiosis I (20, 23, 24), were correlated with the pronounced elevation in RS in AMAs (fig. 3B). The latter explains why RS is not a simple function of two independent PSSC events (15) and is mediated predominantly by acrocentric chromosomes (exact test, p<10-4; fig. 2F; fig. S14; table S9). Thus, cohesion weakening may act as a “molecular clock” that limits reproductive capacity as women age by predisposing specific chromosomes to errors, without causing genome-wide missegregation (fig. S11, S14).
Fig. 3. Centromeric and extensive cohesion weakening correlate with PSSC and RS.
(A) Sister kinetochore distances (mean and st. dev.) of MII oocytes. Inset: spread chromosome (gray: DAPI; magenta: centromeres marked by CREST serum) and iKT measurement (white bar). Quadratic fit to iKT distances in grey (top) compared to a linear regression to PSSC rates from fig. 2C in orange (bottom).
(B) Combined rate of univalents (dark grey) and fully-inverted bivalents (light grey; data from ref. 20), compared RS rate from MII oocytes in fig. 2C (yellow). Red: microtubules. Error bars: standard error of a proportion.
Although human oocytes are prone to aneuploidy, 94% of chromosomes segregate accurately despite decades of arrest that progressively weaken cohesion (fig. S13C). In fact, correct segregation outcomes are seen in human oocytes even when chromosomes would be expected to mis-segregate, such as the second meiotic division in RS. As sister-chromatid linkage during meiosis II is thought to be mediated by centromeric cohesion (25), the RS pattern, which results in premature loss of centromeric cohesion but a euploid MII egg, should generate two independent chromatids that segregate randomly at anaphase II. Yet, 78% of non-sisters segregate accurately (fig. S13B).
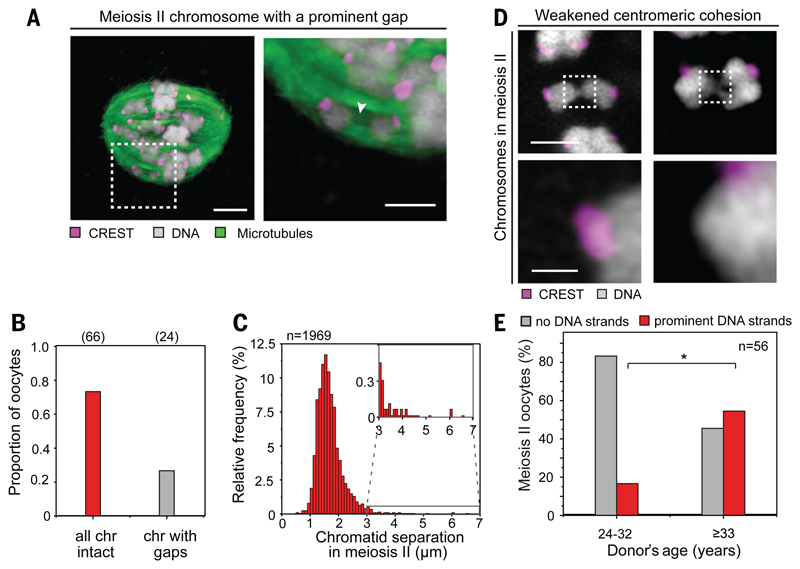
To understand how chromosomal architecture may contribute to faithful chromosome segregation despite pronounced cohesion weakening, we conducted high resolution imaging of intact metaphase II spindles. Twenty seven percent of MII eggs exhibited at least one chromosome where two sister chromatids were separated by a prominent gap with no DNA mass between them (fig. 4A-B). Although the average chromatid separation in our egg cohort was 1.7μm, ~5% of chromosomes had two chromatids separated by a pronounced gap ranging between 2.5 and 6.6μm (fig. 4C). Despite this pronounced cohesion weakening, the two chromatids remained correctly aligned at the spindle equator, suggesting that they still act as a single, functional pair.
Fig. 4. Chromatin threads in human meiosis.
(A) MII chromosomes with prominent gaps aligned correctly on the spindle. Arrow points to a prominent gap between sister chromatids (gray: DNA, magenta: centromeres marked by CREST serum, green: microtubules). Scale bars: 4μm (overview) and 2μm (inset).
(B and C) Proportion of oocytes having at least one chromosome with a pronounced gap (B) and quantitative analysis of separation of the two chromatids across the entire oocyte cohort (C).
(D) Chromatin threads between chromatids with weakened centromeric cohesion. All chromosomes captured prior to anaphase onset. Scale bars: 2μm (overview) and 0.5μm (insets).
(E) Proportion of MII oocytes with chromatin threads by donor age grouped into above and below our AMAs cut-off. Exact test: p<0.05 (*). All analysis performed on intact spindles.
Further analysis revealed prominent chromatin threads between paired chromatids in 46% of MII eggs (fig. 4D-E; fig. S15; movie S1). The chromatin threads consisted of B-DNA and frequently bridged not only the peri-centromeric regions, but also the distal portions of the chromosome arms (fig. 4D; fig. S15C) Consistent with extensive cohesion weakening from the mid- to AMA age groups (fig. 3A), the proportion of eggs that contained prominent chromatin bridges increased as well (fig. 4E). Chromatin threads consisting of B-DNA have been reported to connect and mediate segregation in Drosophila (26) and Luzula meiosis (27). The presence of chromatid threads in eggs implies a role of threads in linking chromatids in human meiosis II. This role may become more prominent once cohesin complexes are lost, such as after degradation of arm cohesin at anaphase I (28, 29) and may be particularly important if cohesion deteriorates as women age (fig. S15C, right panels). Chromatid threads in human oocytes may represent unresolved recombination intermediates, catenanes, or sites where residual cohesin rings selectively persist despite oocyte ageing. Thus, they may contribute to chromatid linkage throughout the two meiotic divisions, and thereby promote correct chromosome alignment and segregation in ageing females when centromeric cohesion is weakened.
In summary, we provide evidence that localized centromeric and more systemic (univalent formation) cohesion weakening drive the elevation in PSSC and RS as women age, whereas a separate, and currently unclear, mechanism causes elevated rates of MI NDJ in young females. Together, these two forces combined generate a chromosome-based system that causes the U-curve of aneuploidy, thereby shaping the distinct natural fertility curve in humans.
Supplementary Material
Acknowledgments
We thank the girls and women who participated and colleagues who helped with informed consent, fertility treatment, and ensured ethical adherence. We thank R. Moltrecht and H, Eckel from Kinderwunschzentrum Göttingen (Germany) for samples included in fig. 4. G. Hartshorneacknowledges the support of the clinical team and patients at Centre for Reproductive Medicine, University Hospitals Coventry and Warwickshire NHS Trust, and the research administrative team at the Biomedical Research Unit in Reproductive Health. Funding and author contributions are shown in the Methods.
Footnotes
Competing interests: The authors declare no competing interests.
Data availability: All data are available at dbGaP (study #35769) under appropriate Data Use Certification (DUC) agreement in accordance with Danish ethical regulation and General Data Protection Regulation (GDPR).
References
- 1.Hawkes K, Smith KR. Ann N Y Acad Sci. 2010;1204:43–53. doi: 10.1111/j.1749-6632.2010.05527.x. [DOI] [PMC free article] [PubMed] [Google Scholar]
- 2.Huseynov A, et al. Proc Natl Acad Sci U S A. 2016;113:5227–5232. doi: 10.1073/pnas.1517085113. [DOI] [PMC free article] [PubMed] [Google Scholar]
- 3.Kumar A, et al. Indian J Pediatr. 2007;74:927–931. doi: 10.1007/s12098-007-0171-2. [DOI] [PubMed] [Google Scholar]
- 4.Kim PS, et al. Proc Biol Sci. 2012;279:4880–4884. doi: 10.1098/rspb.2012.1751. [DOI] [PMC free article] [PubMed] [Google Scholar]
- 5.Zelazowski MJ, et al. Cell. 2017;171:601–614 e613. doi: 10.1016/j.cell.2017.08.042. [DOI] [PMC free article] [PubMed] [Google Scholar]
- 6.Capalbo A, et al. Hum Reprod Update. 2017;23:706–722. doi: 10.1093/humupd/dmx026. [DOI] [PubMed] [Google Scholar]
- 7.Hassold T, Chui D. Hum Genet. 1985;70:11–17. doi: 10.1007/BF00389450. [DOI] [PubMed] [Google Scholar]
- 8.Escrich L, et al. J Assist Reprod Genet. 2011;28:111–117. doi: 10.1007/s10815-010-9493-5. [DOI] [PMC free article] [PubMed] [Google Scholar]
- 9.Escrich L, et al. Fertil Steril. 2012;98:1147–1151. doi: 10.1016/j.fertnstert.2012.07.1116. [DOI] [PubMed] [Google Scholar]
- 10.McCoy RC, et al. PLoS Genet. 2015;11:e1005601. doi: 10.1371/journal.pgen.1005601. [DOI] [PMC free article] [PubMed] [Google Scholar]
- 11.McCoy RC, et al. Science. 2015;348:235–238. doi: 10.1126/science.aaa3337. [DOI] [PMC free article] [PubMed] [Google Scholar]
- 12.Darlington CD. Recent advances in cytology. ed. 2d. P. Blakiston's son & co., inc; Philadelphia: 1937. p. 671. pp. xvi. [Google Scholar]
- 13.Angell RR. Hum Genet. 1991;86:383–387. doi: 10.1007/BF00201839. [DOI] [PubMed] [Google Scholar]
- 14.Ottolini CS, et al. Sci Rep. 2017;7 doi: 10.1038/s41598-017-09693-1. 9744. [DOI] [PMC free article] [PubMed] [Google Scholar]
- 15.Ottolini CS, et al. Nat Genet. 2015;47:727–735. doi: 10.1038/ng.3306. [DOI] [PMC free article] [PubMed] [Google Scholar]
- 16.Henderson SA, Edwards RG. Nature. 1968;218:22–28. doi: 10.1038/218022a0. [DOI] [PubMed] [Google Scholar]
- 17.Chiang T, et al. Curr Biol. 2010;20:1522–1528. doi: 10.1016/j.cub.2010.06.069. [DOI] [PMC free article] [PubMed] [Google Scholar]
- 18.Lister LM, et al. Curr Biol. 2010;20:1511–1521. doi: 10.1016/j.cub.2010.08.023. [DOI] [PubMed] [Google Scholar]
- 19.Duncan FE, et al. Aging Cell. 2012;11:1121–1124. doi: 10.1111/j.1474-9726.2012.00866.x. [DOI] [PMC free article] [PubMed] [Google Scholar]
- 20.Zielinska AP, et al. Elife. 2015;4 doi: 10.7554/eLife.11389. [DOI] [PMC free article] [PubMed] [Google Scholar]
- 21.Patel J, et al. Biol Open. 2015;5:178–184. doi: 10.1242/bio.016394. [DOI] [PMC free article] [PubMed] [Google Scholar]
- 22.Lagirand-Cantaloube J, et al. Sci Rep. 2017;7 doi: 10.1038/srep44001. 44001. [DOI] [PMC free article] [PubMed] [Google Scholar]
- 23.Angell RR. Cytogenet Cell Genet. 1995;69:266–272. doi: 10.1159/000133977. [DOI] [PubMed] [Google Scholar]
- 24.Kouznetsova A, et al. Nat Genet. 2007;39:966–968. doi: 10.1038/ng2065. [DOI] [PubMed] [Google Scholar]
- 25.Jessberger R. EMBO Rep. 2012;13:539–546. doi: 10.1038/embor.2012.54. [DOI] [PMC free article] [PubMed] [Google Scholar]
- 26.Gilliland WD, et al. G3 (Bethesda) 2014;5:175–182. doi: 10.1534/g3.114.014316. [DOI] [PMC free article] [PubMed] [Google Scholar]
- 27.Heckmann S, et al. Nat Commun. 2014;5 doi: 10.1038/ncomms5979. 4979. [DOI] [PMC free article] [PubMed] [Google Scholar]
- 28.Buonomo SB, et al. Cell. 2000;103:387–398. doi: 10.1016/s0092-8674(00)00131-8. [DOI] [PubMed] [Google Scholar]
- 29.Kudo NR, et al. Cell. 2006;126:135–146. doi: 10.1016/j.cell.2006.05.033. [DOI] [PubMed] [Google Scholar]
Associated Data
This section collects any data citations, data availability statements, or supplementary materials included in this article.


