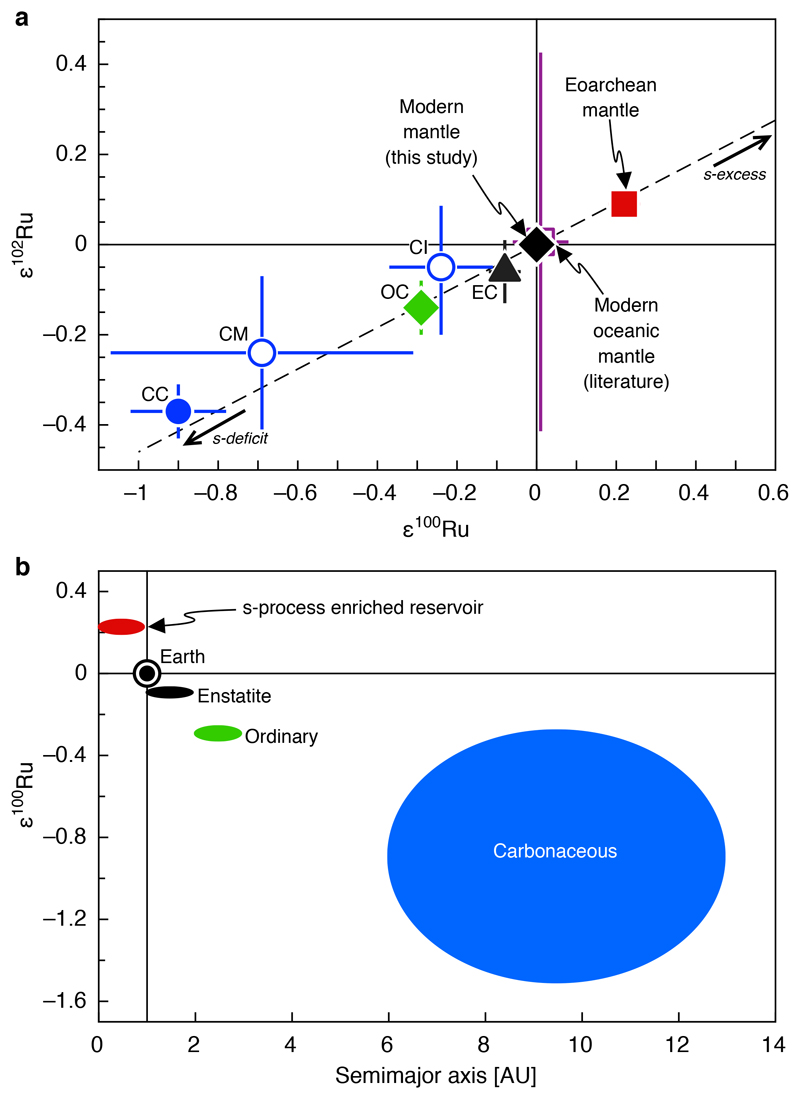
Figure 2. Ruthenium isotope plot illustrating compositional differences between enstatite (EC), ordinary (OC), average carbonaceous (CC), CI and CM carbonaceous chondrites, modern mantle and Eoarchean mantle.
a: Dashed line represents a mixing line between the modern mantle composition (ε100Ru = 0) and an s-process component as defined by Ru isotope data for pre-solar silicon carbide (SiC) grains34. The compositions of enstatite chondrites (EC, ε100Ru = –0.08 ± 0.04, 95% confidence interval); ordinary chondrites (OC, ε100Ru = –0.29 ± 0.03, 95% confidence)5, CI chondrites (CI, ε100Ru = –0.24 ± 0.13, 2 s.d.)5; CM chondrites (CM, ε100Ru = –0.69 ± 0.38, 95% confidence)5, and average carbonaceous chondrites (average CC, ε100Ru = –0.90 ± 0.12, 95% confidence interval)5 are shown for comparison. The uncertainties for CI chondrites reflect a single measurement and are thus shown with the external uncertainty of the method (2 s.d. as stated in ref. 5). Uncertainties for the modern and the Eoarchean mantle composition are the same as stated in Fig. 1. Note that the uncertainty of the modern oceanic mantle composition from the literature is shown as 2 s.d.12.
b: Plot illustrating the heliocentric zoning of ε100Ru anomalies5. The presence of an s-process enriched reservoir that contributed to the Earth’s growth is inferred from the Ru isotope composition obtained for the Eoarchean mantle of SW Greenland (Fig. 1). Chondrite groups formed at increasing heliocentric distances exhibit more negative ε100Ru because they are more depleted in s-process Ru relative to Earth’s modern mantle5. The ε100Ru uncertainty for carbonaceous chondrites in b is shown as 2 s.d. to account for significant within-group variation of their ε100Ru values (Figure modified from ref. 5).

