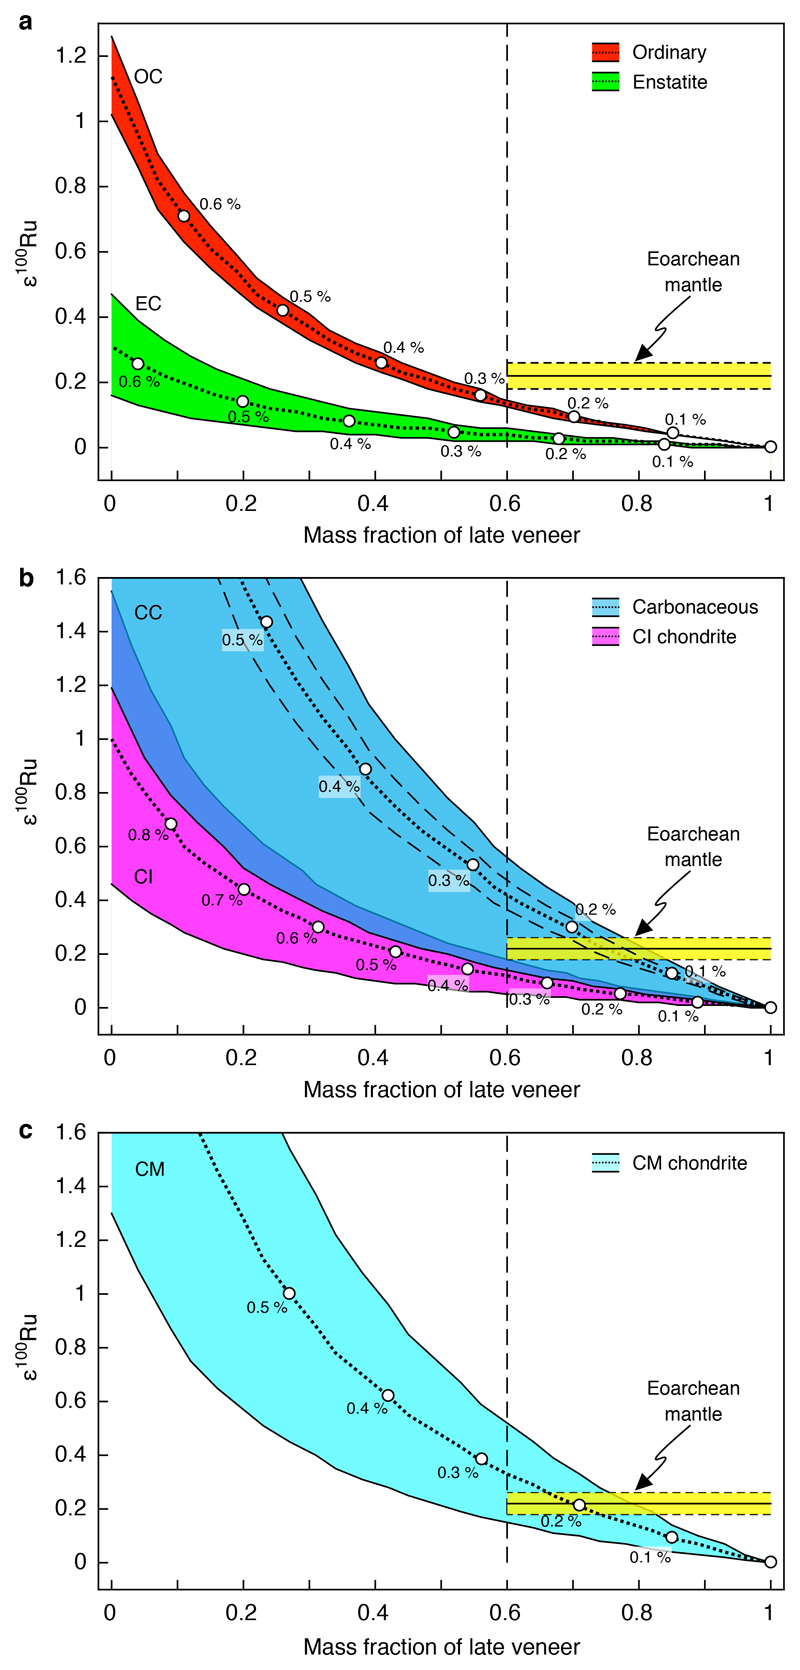
Figure 3. Model estimates for the amount of late veneer added to the Eoarchean mantle based on Ru isotope compositions.
The model illustrates the effect of subtracting variable mass fractions of late veneer from the Ru isotope composition of the modern mantle. The composition of the modern mantle was fixed at ε100Ru = 0, as indicated by the composition obtained for samples from the Bushveld complex (Extended data Table 1), which is indistinguishable from previously reported data for the modern oceanic mantle composition12. Dotted lines indicate the respective mass fractions of different chondritic late veneer compositions subtracted from the modern mantle composition. Solid black lines show the minimum and maximum ε100Ru values for different chondrite classes in a: enstatite chondrites (EC, ε100Ru = –0.08 ± 0.04, 95% confidence interval); ordinary chondrites (OC, ε100Ru = –0.29 ± 0.03, 95% confidence)5; b: carbonaceous chondrites (CC, ε100Ru = –0.90 ± 0.61, 2 s.d.; ± 0.12, 95% confidence)5; CI chondrites (CI, ε100Ru = –0.24 ± 0.13, 2 s.d.)5; and c: CM chondrites (CM, ε100Ru = –0.69 ± 0.38, 95% confidence)5. The uncertainties for carbonaceous chondrites in b are given as 2 s.d. to account for significant within-group variation of their ε100Ru values (dashed line indicates 95 % confidence interval uncertainty). The 2 s.d. uncertainty for CI chondrites reflects the external uncertainty of the method (as stated in ref. 5). The amount of subtracted late veneer material for each respective chondrite composition was adjusted to match a presumed Ru concentration in the pre-late veneer mantle of ~1.4 ng g-1, corresponding to ~20% of the Ru contained in the modern mantle. The yellow box in a, b and c indicates the composition of the Eoarchean mantle inferred from the mean value of all analyzed 3.8–3.7 Gyr-old samples originating from various localities of the Itsaq gneiss complex (ε100Ru = +0.22 ± 0.04, average value shown as solid black line, dashed lines indicate 95% confidence interval uncertainty, Extended data Table 1). The solid vertical dashed line indicates the minimum late veneer contribution inferred for the mantle source of peridotite samples from the Narssaq ultramafic body (NUB) and the south of Isua supracrustal belt (SOISB), based on previously reported 187Os/188Os data and HSE concentrations14. The parameters used for the mixing model are given in Extended Data Table 3.

