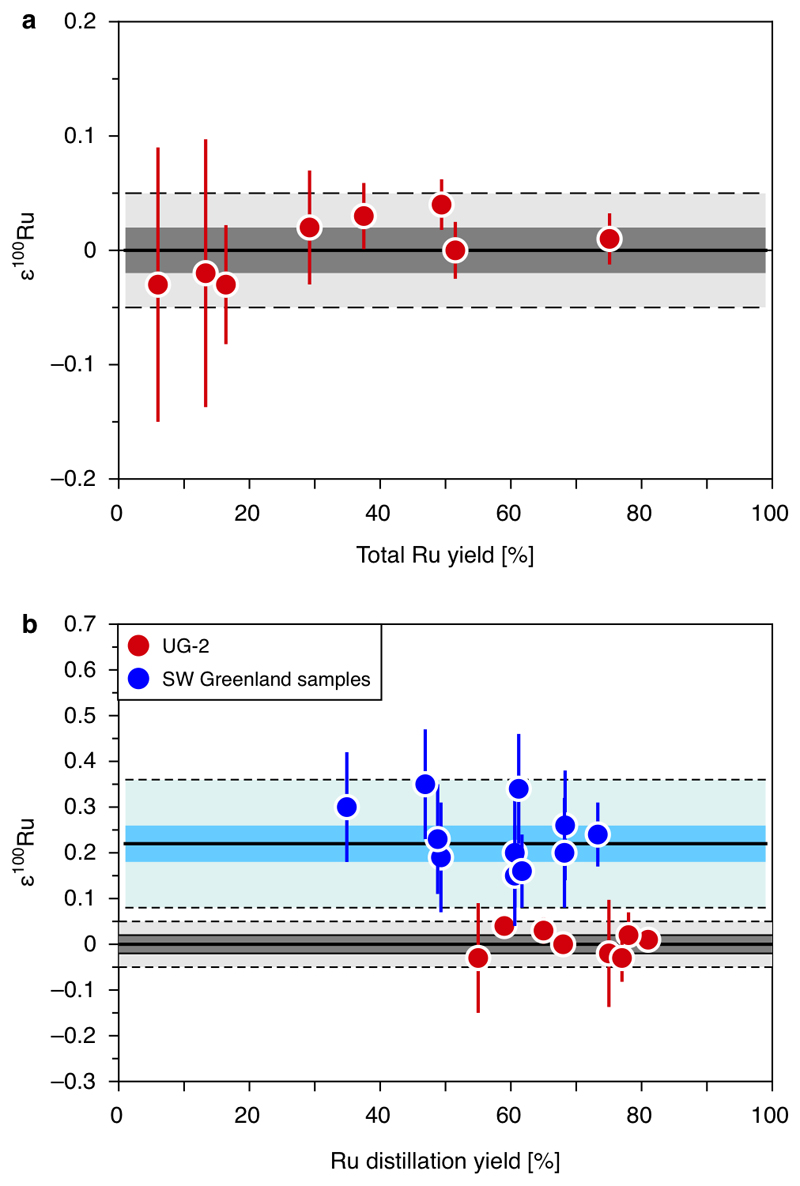
Extended data Figure 1. Ruthenium yields of the total analytical procedure and Ru yields from the distillation plotted against ε100Ru data for replicate digestions of UG-2 and SW Greenland samples.
The plot shows that the accuracy of the ε100Ru data is not affected by the Ru yield of the total analytical procedure (a) or the Ru yield of the distillation (b), respectively. The grey and blue areas represent the 95% confidence interval uncertainties, light grey and blue areas limited by dashed lines indicate the 2 s.d. uncertainty as stated for the calculated mean values of the Bushveld igneous complex and the Itsaq gneiss complex (Extended Data Table 1). Note that in (b) for the SW Greenland samples it was not possible to determine the Ru distillation yield for all replicates of the analyzed samples.

