Summary
In fission yeast and plants, RNA-processing and degradation contribute to heterochromatin silencing, alongside conserved pathways of transcriptional repression. It was unknown if similar pathways exist in metazoans. Here we describe a pathway of silencing in C. elegans somatic cells, in which the highly conserved RNA binding complex LSM2-8 contributes selectively to the repression of heterochromatic reporters and endogenous genes bearing the Polycomb mark, histone H3K27me3. It acts by degrading selected transcripts through the XRN-2 exoribonuclease. Disruption of the LSM2-8 pathway leads to mRNA stabilization. Unlike previously described pathways of heterochromatic RNA degradation, LSM2-8-mediated RNA degradation does not require nor deposit H3K9 methylation. Rather, loss of this pathway coincides with a localized reduction in H3K27me3 at lsm-8-sensitive loci. Thus, we have uncovered a mechanism of RNA degradation that selectively contributes to the silencing of a subset of H3K27me3-marked genes, revealing a previously unrecognized layer of post-transcriptional control in metazoan heterochromatin.
Keywords: LSM8, XRN2, RNA degradation, Polycomb, PRC2, mes-2, C. elegans, Heterochromatin silencing, H3K27me3, epigenetics, LSM complex
Introduction
Organization of genomic DNA into highly condensed, dark-staining heterochromatin correlates with reduced gene expression1–3. Heterochromatin is generally classified as either constitutive or facultative. Trimethylation of histone H3 lysine 9 (H3K9me3) typifies constitutive heterochromatin, and is highly enriched on repetitive elements1, 4. Polycomb-mediated trimethylation of H3K27 is the hallmark of facultative heterochromatin, and silences genes in response to temporal and spatial conditions2, 5. Both are thought to act primarily by repressing transcription, although pathways that silence post-transcriptionally have been documented in fission yeast and plants6, 7.
Transcription and noncoding RNAs are implicated in the establishment of H3K9me3-mediated repression in fission yeast 8, 9, either through the RNAi machinery and the RITS complex6, 7, 10, or through, RNAi-independent RNA degradation via the exosome11. This latter mechanism was later extended to heterochromatic repeat silencing in Drosophila12, and centromeric and pericentromeric repression in Arabidopsis13, 14. In S. pombe, multiple RNA associated factors promote H3K9me2/3 silencing in a partially redundant manner, including HP1(Swi6)15, Red1 and Mmi116–19, Pla1 and Pab218, 20, and Dhp1/Xrn221, 22. To date no compelling parallel has been reported for facultative (e.g., Polycomb) repression of genes in animals, although the Polycomb repressive complex 2 has been shown to bind RNA23, 24.
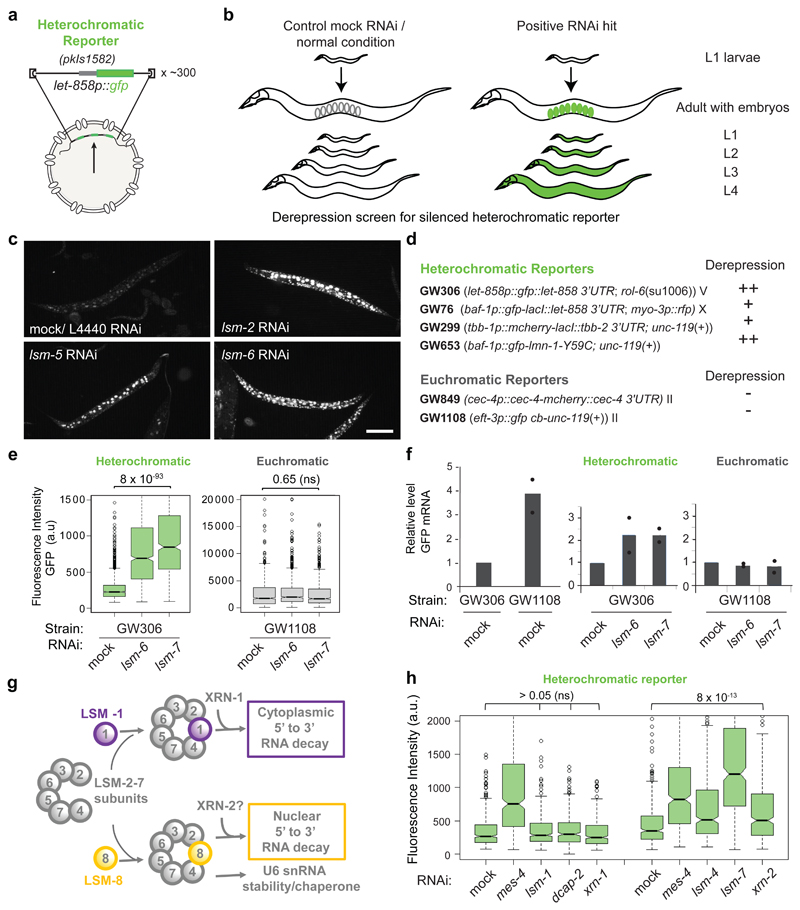
Using a genome-wide RNAi screen to identify repressors of an integrated heterochromatic reporter in C. elegans embryos, we identified 29 validated hits25 (Fig. 1a,b). Although most were chromatin modifiers, three were subunits of RNA-binding Like-SM (LSM) complexes (gut-2/lsm-2, lsm-5 and lsm-6)25. The C. elegans LSM proteins share up to 94% homology with their human counterparts (Extended data Fig.1a), and are found across all species in two LSM complexes, one cytoplasmic (LSM1-7) and one nuclear (LSM2-8)26–31. Both are implicated in RNA metabolism; LSM1-7 complex partners with decapping enzymes to render mRNA sensitive to the 5' to 3' XRN-1 exonuclease, while the LSM2-8 complex stabilizes U6 snRNA and promotes nuclear RNA decay in yeast 26, 27.
Figure 1. LSM proteins silence heterochromatic reporters, but not euchromatic reporters.
a, Sketch of the integrated, high-copy number heterochromatic reporter pkIs1582 from strain GW306 used in the genome-wide screen 25. The pkIs1582 reporter is integrated as about 300 copies and expresses GFP from the ubiquitously active promoter let-858. b, Here RNAi-based derepression was monitored in progeny of all stages by increased GFP fluorescence in the nuclei. c, Fluorescence microscopy of pkIs1582-encoded GFP in L4 larvae with indicated RNAi versus control (mock/L4440). Bar, 100 μm. These experiments were repeated four times independently with similar results. d, Heterochromatic and euchromatic reporters scored by eye for derepression (+, ++: strong and very strong derepression, respectively) upon LSM RNAi (Table S1). The experiment was repeated twice independently with similar results. e, Quantitation of derepression in L1 larvae by the worm sorter following indicated RNAi. Notched box plots of fluorescence intensity in arbitrary units (a.u), with whiskers = 25th and 75th percentiles, min and max 5th and 95th percentiles, black circles outliers, thick line: median. The notch around the median represents 95% confidence interval of the median. Quantification and statistical analysis were based on n =2000 (GW306-mock), 1068 (GW306- lsm6), 613 (GW306-lsm7) and 875 (GW1108-mock), 111 (GW1108- lsm6), 1026 (GW1108-lsm7) worms pooled from 3 independent experiments. P values indicated; n.s.= non-significant; two-tailed unpaired t test. f, qPCR analysis of GFP mRNA in L1 larvae as in (e), normalized to his-56 and its-1 mRNA. GFP from GW306 strain is set as 1 (left), and mock RNAi conditions are set as 1 (right). Dots show two independent biological replicates. bars = mean. g, The two main LSM complexes and functions [26, 27]. h, GFP fluorescence of the heterochromatic reporter (pkIs1582; GW306) in L1 larvae after RNAi treatment for indicated genes. Quantification and statistical analysis were based on n =396 worms for each treatment pooled from 3 independent experiments.. P values indicated; two-tailed unpaired t test; p values > 0.05 are 0.82, 0,44 and 0.05 for lsm-1, dcap-2, and xrn-1, respectively. Statistical source data are provided in Source Data fig. 1.
RNAi against the C elegans lsm-2, lsm-5 and lsm-6 genes led to robust derepression of the heterochromatic reporter pkIs1582 in worm embryos25 (Fig. 1a,b). This integrated reporter array bearing histone H3K9me2/3 and H3K27me3 contains 200 to 300 copies of a GFP-encoding reporter under control of a ubiquitously active promoter (let-858p::gfp)3, 25, 32, 33. Loss of either of the two H3K9 methyltransferases (MET-2, SET-25) or of the EZH2 homolog, MES-2, derepressed this reporter25.
We now show that the LSM2-8 complex contributes to Polycomb-mediated silencing at all developmental stages and in all somatic cells. LSM2-8 works through XRN-2 to mediate post-transcriptional RNA decay, selectively targeting transcripts that arise from endogenous genes bearing H3K27me3. The LSM1-7 complex is not involved. The level of H3K27me3 on these LSM8-sensitive loci drops in animals lacking lsm-8, suggesting a feedback loop in which LSM2-8 serves as an intermediary that triggers the degradation of transcripts arising specifically from Polycomb-marked genes, concomitantly enhancing the repressive chromatin state. This argues that the nuclear degradation of transcripts from H3K27me3-marked genes can supplement the transcriptional repression mediated by this mark.
Results
LSM proteins selectively silence heterochromatic reporters throughout somatic differentiation
We first extended the initial observations of Towbin et al.25 by analyzing repression of the heterochromatic reporter pkIs1582 throughout C. elegans development (Fig. 1a,b; Table S1). Following RNAi against lsm-2, lsm-5 and lsm-6, we found the reporter-encoded GFP to be robustly derepressed at all stages, including embryos, L1 to L4 larval stages and adult worms (Fig. 1c, Extended Data Fig. 1b). GFP levels were elevated in nearly every somatic cell type.
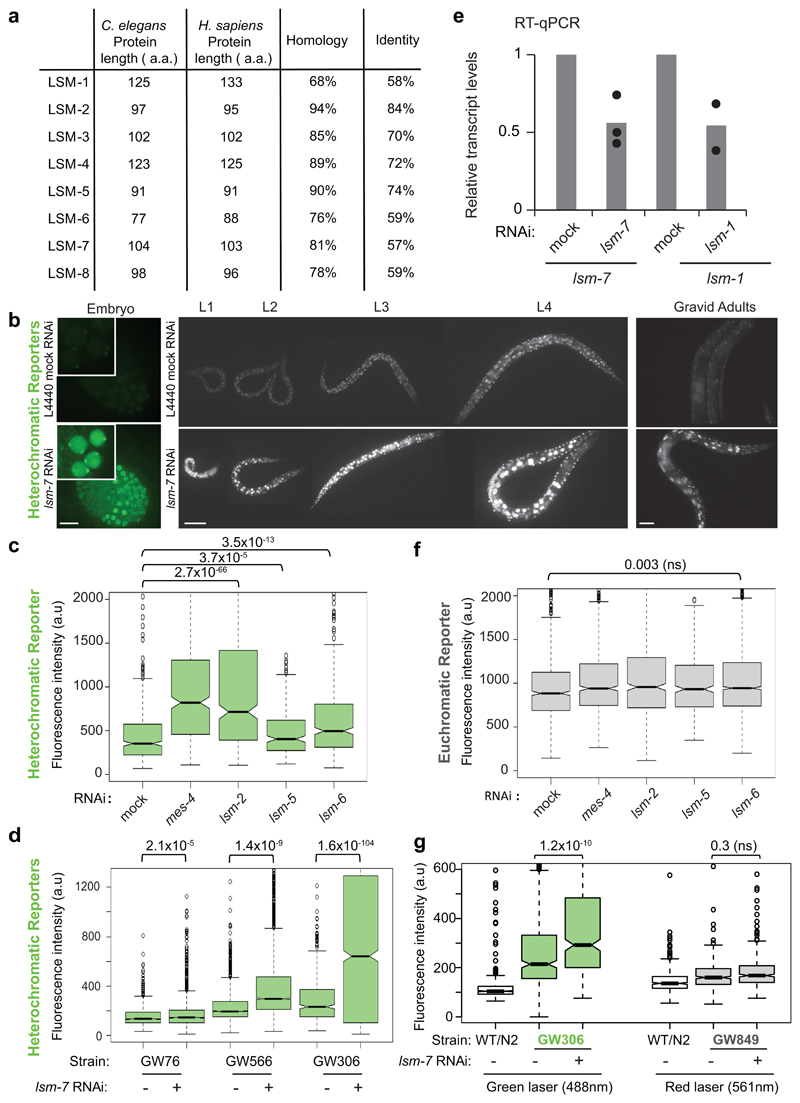
The ubiquitous derepression of the reporter allowed quantification of GFP expression by flow cytometry, generating robust population-wide measurements. These confirmed a statistically significant up-regulation of GFP in L1 larvae following RNAi for lsm-2, lsm-5 and lsm-6 and for the positive control mes-425, relative to the L4440/mock control RNAi (Extended Data Fig. 1c). To ask whether the derepression depended on sequence characteristics of the reporter, we monitored the effect of lsm RNAi on the expression of four different heterochromatic reporters each with a unique combination of promoter, reporter gene (encoding GFP or mCherry), 3’ UTR, site of integration and basal expression level (Fig. 1d, Table S1). All the heterochromatic reporters showed significant derepression (Fig. 1d,e, Extended Data Fig. 1b-d). In contrast, none of the two euchromatic reporters (single copy transgenes integrated into a non-heterochromatic genomic region) with either low or high expression level, showed any change in expression following lsm RNAi (Fig. 1d,e, Extended Data Fig. 1f,g, Table S1). We concluded that neither the sequence of the reporter, nor basal expression level correlated with lsm sensitivity, yet LSM proteins contributed specifically to the repression of reporters with heterochromatic, but not euchromatic, features.
We further confirmed that the increased expression following lsm RNAi is due to changes in mRNA level, and not altered protein synthesis or turnover, by scoring gfp mRNA levels from let-858p::gfp/GW306 and eft-3p::gfp/GW1108 by qPCR. The heterochromatic let-858p::gfp reporter showed higher steady-state levels of gfp mRNA following lsm-6 and lsm-7 RNAi, while the euchromatic eft-3p::gfp mRNA was unchanged (Fig. 1f). Thus, LSM factors silence exclusively reporters with heterochromatic features by altering mRNA levels, both during and after somatic cell differentiation.
RNAi implicates LSM2-7 and XRN-2, but not LSM-1 and XRN-1, in reporter repression
The LSM proteins 2 through 7 are shared by two related complexes: the cytoplasmic LSM1-7 complex and the nuclear LSM2-8 complex27 (Fig. 1g). LSM1-7 acts together with the 5’→3’exoribonucleases, XRN-1 and the decapping enzymes DCAP-1 and DCAP-2 to mediate cytoplasmic RNA decay, while LSM2-8 was suggested to work with the nuclear 5’→3’exoribonuclease XRN-226. To determine which LSM complex contributes to heterochromatic gene silencing, we compared reporter derepression levels after RNAi against lsm-1, the only unique LSM1-7 subunit, with that against shared subunits, lsm-4 and lsm-7. Strong derepression was scored upon knockdown of lsm-4 and lsm-7, while the down-regulation of lsm-1 RNAi had no effect (Fig. 1h). We confirmed that RNAi efficiency was similar for lsm-1 and lsm-7 (Extended Data Fig. 1e). In addition, RNAi against LSM1-7- associated factors, dcap-2 and xrn-1, failed to provoke heterochromatic reporter derepression, while RNAi against xrn-2 did (Fig. 1h).
Deletion of lsm-8 leads to derepression, while lsm-1 or dacp-2 deletions do not
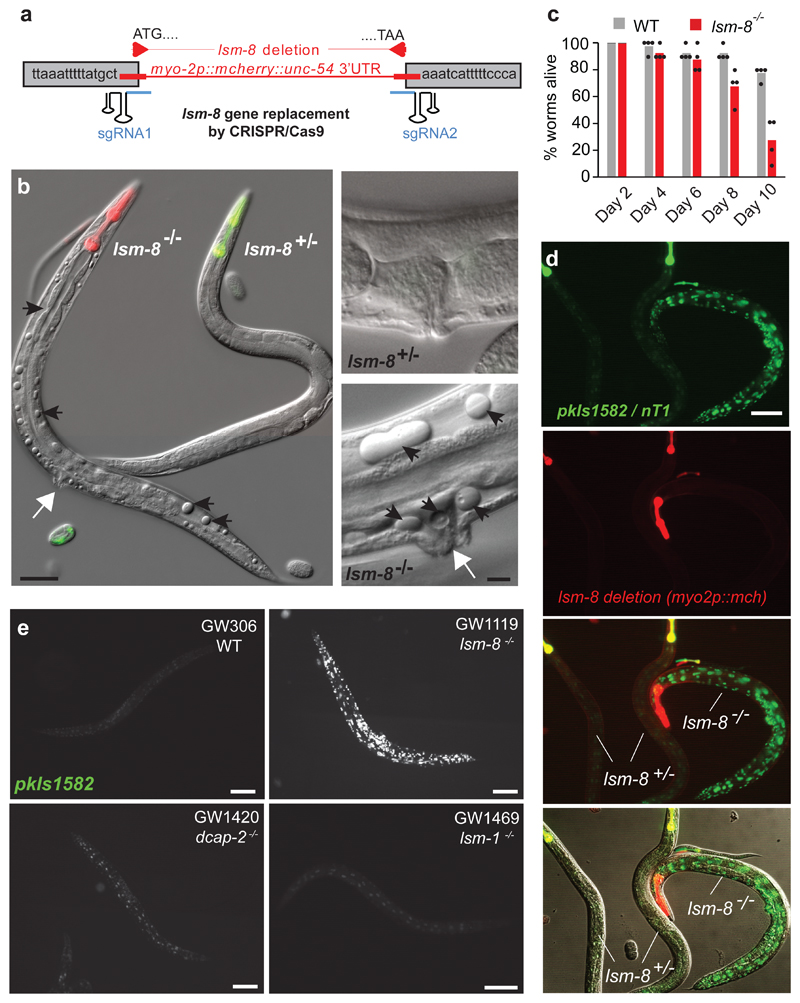
These RNAi results implicated LSM2-8, but not LSM1-7, in silencing. To confirm this, we first generated a full lsm-8 deletion by CRISPR/Cas9. We replaced the lsm-8 locus with a red fluorescent marker gene with pharynx-specific expression, through which we could track the null allele through development (Fig. 2a,b). To stably maintain the lsm-8 deletion, it required the nT1[qIs51] balancer, which expresses a GFP marker in the pharynx. This allowed us to sort homozygous from heterozygous worms: heterozygous lsm-8+/- worms have both red and green pharyngeal fluorescence, while homozygous lsm8-/- worms express only the red marker (Fig. 2b).
Figure 2. LSM2-8 mediates heterochromatic silencing, and prevents sterility and premature death.
a, Schematic view of the lsm-8 deletion/gene replacement created by CRISPR-Cas9. b, Differential interference contrast (DIC) images of young adults (GW1120) merged with pharynx fluorescence to identify genotypes, as in (d). lsm-8-/- worms accumulate cavities and vacuoles (black arrows), and protruding vulva (white arrows). Right, enlargement of the vulva region. Bars, 50 μm (left) and 10 μm (right); data shown represent 4 independent experiments. c, Survival assay at 22.5°C after hatching shows premature death of lsm-8-/- worms. Bars represent mean value derived from four independent experiments, with each experimental value shown as a dot. The four experiments examined 40 worms in total per genotype. d, View of lsm-8+/- (yellow pharynx in merge) and lsm-8-/- (red pharynx only) worms carrying the pkIs1582 heterochromatic reporter. Red and green channels are shown separated and merged. Bar, 100 μm. Data shown represent 4 independent experiments. e, Heterochromatic reporter pkIs1582 derepression in lsm-8-/- background compared to the WT, dcap-2-/- and lsm-1-/- background level. Data shown represent 2 independent experiments. Bars, 100 μm, Statistical source data are provided in Source Data fig. 2.
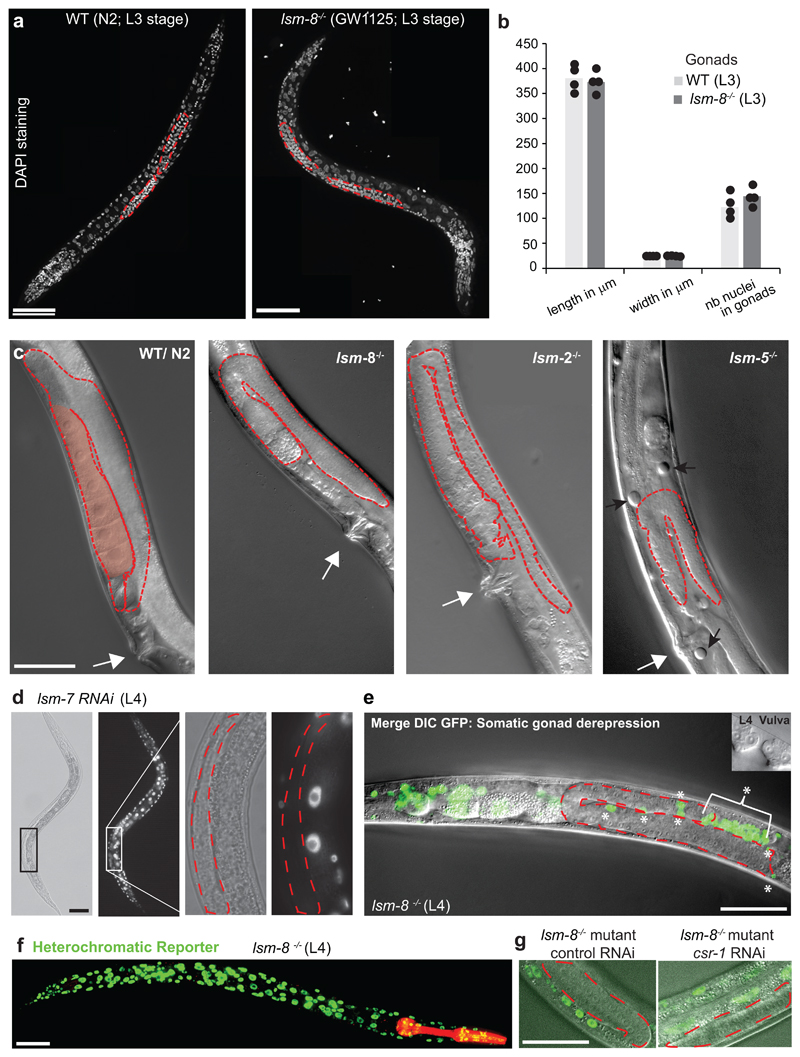
We found that lsm-8-/- animals developed to adulthood and that gonad formation was similar to wild-type larvae up through the L4 stage (Extended Data Fig. 2a,b). However, adult homozygous mutants were 100% sterile, since gonads in lsm-8 -/- young adults became abnormal and failed to support oocyte maturation (no oocytes; Extended Data Fig. 2c). Moreover, adult mutants had protruding vulva phenotype (Fig. 2b), empty cavities or vacuoles in differentiated tissues, and died prematurely after 6 days as adults (Fig. 2c). Worms lacking lsm-2 or lsm-5 were phenotypically similar to lsm-8-/- mutants (Extended Data Fig. 2c), unlike lsm-1 mutants31.
We then monitored expression from the integrated heterochromatic reporter pkIs1582 in lsm-8 null animals. Derepression was equivalent to that scored after lsm-7 RNAi and was not seen in heterozygous lsm-8+/- animals (Fig. 2d). To confirm specificity for the LSM2-8 complex, we obtained and backcrossed animals bearing homozygous genomic deletions of lsm-1 or dcap-2, with the pkIs1582 reporter strain. The lsm-8-/- larvae had stronger nuclear GFP expression compared to the WT background level, reflecting reporter derepression. lsm-1 and dcap-2 deficient animals did not (Fig. 2e). Thus, the loss of heterochromatic silencing stems exclusively from loss of a functional LSM2-8 complex.
Given the sterility in the lsm-8-/- animals, we investigated the heterochromatic reporter derepression in the gonad. pkIs1582 was derepressed in the somatic gonadal cells (distal tip cell, gonadal sheath, and spermathecal cells, Extended Data Fig. 2d-f), as in nearly every somatic cell of the lsm-8-/- L4 larvae, or after lsm-7 RNAi. In contrast, the germline itself (germ cells, Extended Data Fig. 2d,e) had no sign of reporter derepression. We tested redundancy with the piRNA pathway, which mediates germline specific silencing34, but the coupling of lsm8-/- with RNAi against the piRNA-related factor, csr-1 showed no germline GFP expression (Extended Data Fig. 2g). Thus, the LSM2-8 effect is detectable primarily in somatic cells.
LSM2-8 is required to maintain silent endogenous heterochromatin
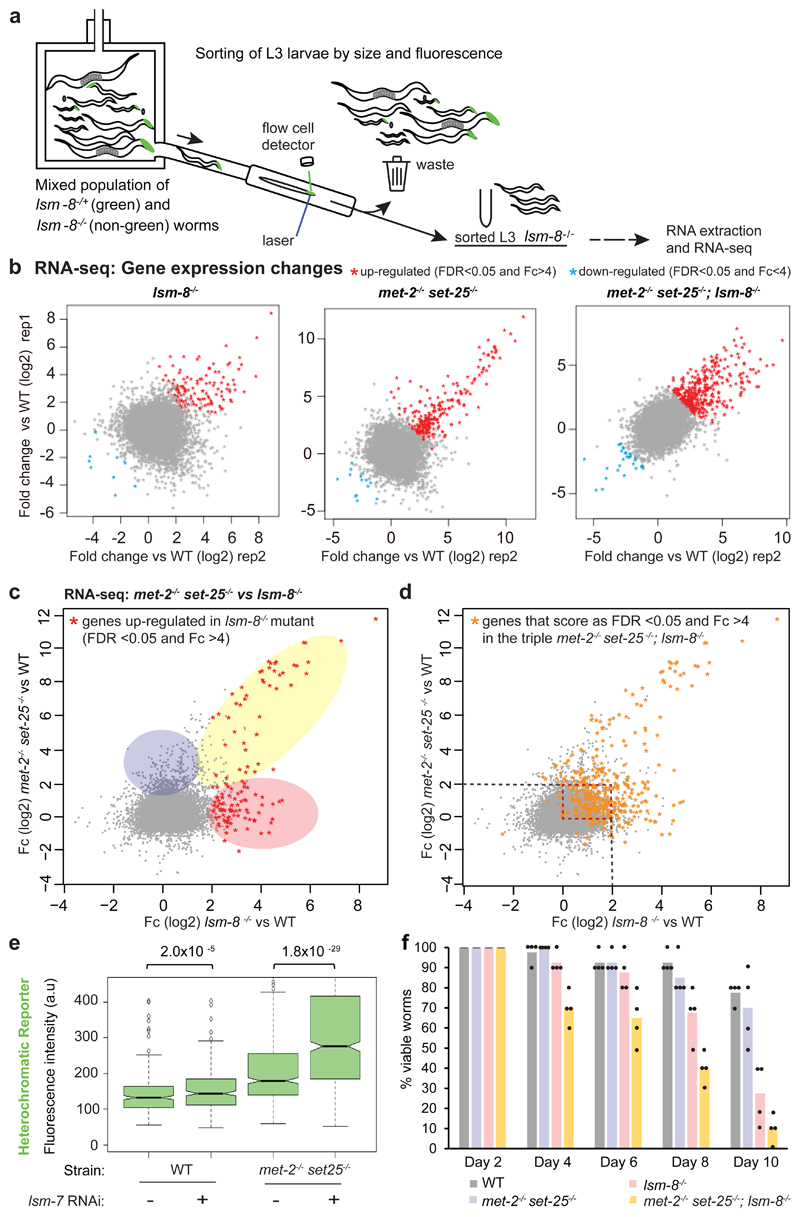
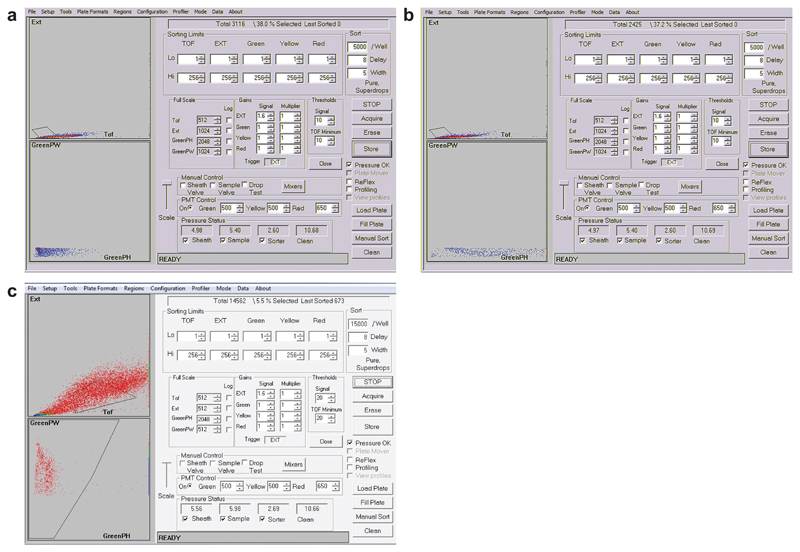
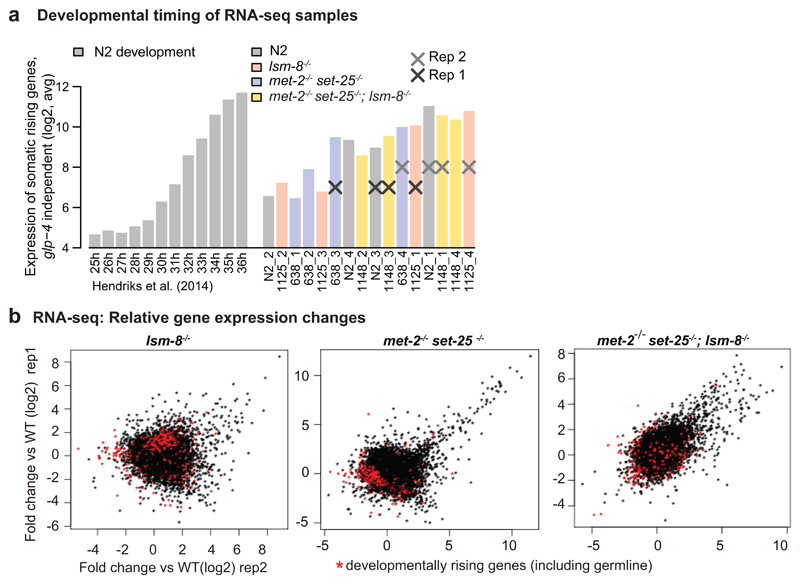
To see if the lsm-8-/- mutation induces changes in endogenous transcript levels, we performed a strand-specific total RNA-seq on WT and homozygous lsm-8-/- sorted L3 larvae (Fig. 3a). We compared the effect of LSM2-8 with that of the H3K9me-deficient met-2-/- set-25-/- mutant 4, 25, or of the triple met-2-/- set-25-/-; lsm-8-/- mutant, to determine if the two silencing pathways (LSM2-8 and the classic H3K9me heterochromatin repression) are epistatic or additive. For each genotype, worms were sorted by fluorescence and by size, to generate uniform populations of L3 stage larvae (Extended Data Fig. 3). Developmental timing was determined (see Methods) using the characteristic temporal fluctuation of a subset of somatic genes as markers for synchrony35. Shifts between replicates of 1-2 h were detected, reflecting variation in the time required for sorting. To minimize the effect of developmental shifts, we performed a comparative analysis on samples from the four genotypes for which the developmental timing was best matched (Extended Data Fig. 4a).
Figure 3. The LSM2-8 complex silences endogenous transcripts, and acts both independently and additively to H3K9 methylation.
a, Worm sorting process. L3 worms with the four following genotypes: lsm-8-/-; met-2-/- set-25-/-; triple mutant and WT were sorted and harvested using the same criteria. b, Relative gene expression profiles are shown as scatter plots, with Fold-change (Fc) in log2 for two RNA-seq biological replicas of L3 sorted worms of the indicated genotype versus WT (Table S2). Each dot corresponds to a gene. Deletion of lsm-8 (lsm-8-/-) derepresses significantly >100 genes (FDR <0.05 and Fc >4, calculated by edgeR, see Methods). c, Scatter plot comparing the relative gene expression between the lsm-8 (x axis) and the met-2 set-25 double mutant (y axis). Common up-regulated genes are shaded yellow; 36% of genes up-regulated in the lsm-8 mutant (FDR <0.05 and Fc >4) are also up-regulated (FDR<0.05 and Fc >4) in the met-2 set-25 mutant. lsm-8-/--specific up-regulated genes are shaded in pink; met-2-/- set-25-/--specific are in blue. d, Comparison of the lsm-8 and met-2 set-25 mutants RNA-seq data, as in (c), overlaid by the set of genes that are up-regulated (FDR <0.05 and Fc >4) in the triple mutant met-2 set-25; lsm-8 (orange dots). The dotted red square highlights genes for which the repression pathways are clearly additive. e, Quantitation of GFP derepression expressed from the gwIs4 heterochromatic reporter in L1 progeny in WT and met-2 set-25 mutant genotypes, respectively from strains GW76 and GW637, after control or lsm-7 RNAi, displayed as in Fig. 1e. P values indicated; two-tailed unpaired t test. Quantification and statistical analysis were based on n= 1460, 2399, 1593, 1189 worms for conditions indicated from left to right, pooled from 3 independent experiments. f, Survival assay. The met-2-/- set-25-/-; lsm-8-/- triple mutants die prematurely compared to the lsm-8-/- mutant. Bars represent mean value derived from four independent experiments, with the each experimental value shown as a dot. The four experiments examined 40 worms in total per genotype. Statistical source data are provided in Source Data fig. 3.
Deletion of lsm-8 resulted in the up-regulation of transcripts of 122 genes (false discovery rate (FDR) <0.05 and fold change (Fc) >4), while only 9 genes were down-regulated (Fig. 3b). Using less stringent cut-off values (Fc >2), there were 1332 genes selectively up-regulated in lsm-8-/- larvae (Table S2). A similar trend for up-regulation and down-regulation was observed upon loss of met-2 set-25, and 36% of the derepressed genes overlapped between the two mutants (Fig. 3b,c; yellow shading). We confirmed that the gene expression changes in lsm-8 -/- L3 larvae (or in other mutants) did not reflect the slight differences in developmental timing between samples (Extended Data Fig. 4b).
We found large subsets of derepressed genes that were up-regulated exclusively in the lsm-8-/- or in the met-2-/- set-25-/- mutant, suggesting that LSM2-8 and H3K9me repression pathways are at least partially independent (Fig. 3c, blue and pink shading, Table S2). Consistently, the triple mutant had the largest number of genes strongly derepressed (367 genes, FDR <0.05 and Fc >4, vs 122 and 219; Fig. 3b,d, Table S2), indicating additivity. Moreover, both pathways seems to work in parallel for commonly regulated genes. To illustrate this additivity, we selected a group of genes that were mildly up-regulated by either lsm 8-/- or met-2-/- set-25-/- (Fc <2; red boxed area in Fig. 3d) but highly derepressed Fc>4 in the triple mutant (orange dots). GFP expression from the heterochromatic reporter, which bears both H3K9me3 and H3K27me3, showed again additivity in the triple mutant (Fig. 3e). Together this suggests that the LSM2-8 pathway of silencing is distinct from the H3K9me-mediated repression, although some genes, like the array-borne gfp reporter, are silenced by both pathways. This phenotypic additivity extends beyond gene silencing. Unlike the adult lethality at 6-10 days in lsm 8-/-, when the mutations were combined, early lethality was strongly enhanced (Fig. 3f), arguing that LSM and H3K9me function on parallel pathways.
Over 93% of LSM2-8 silenced genes bear H3K27 trimethylation
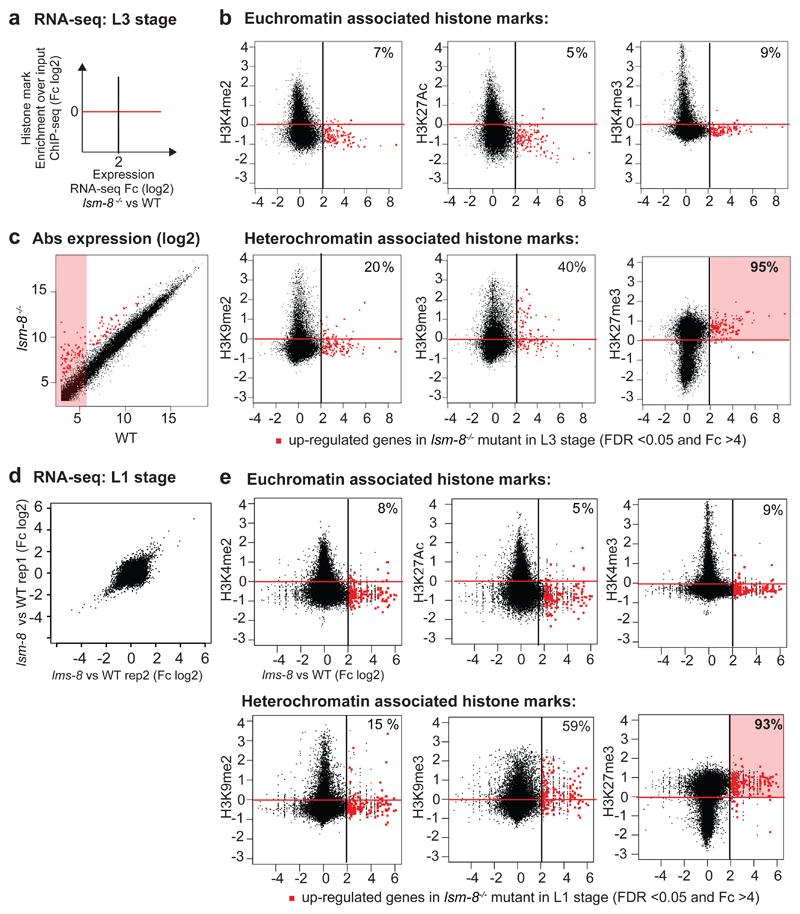
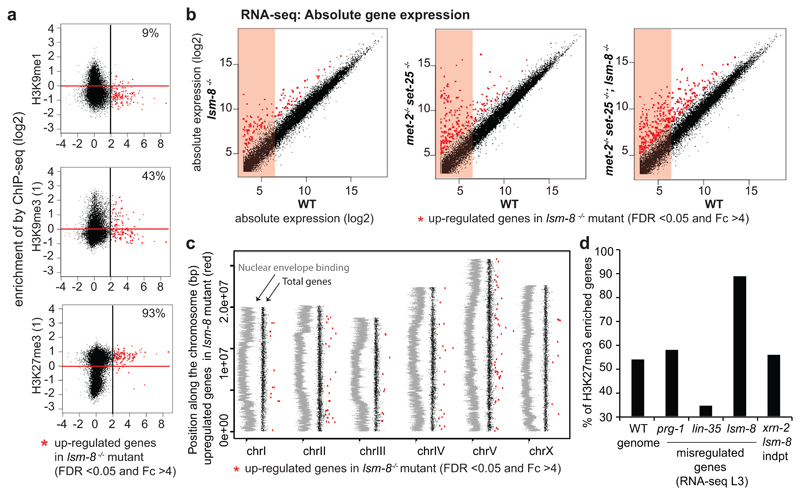
Given the selectivity of the LSM2-8 pathway for heterochromatic reporters, we examined whether the genes up-regulated by lsm-8-/- share a common set of histone modifications. We plotted our L3 RNA-seq data against the normalized ChIP-seq data generated by ModEncode for common histone modifications (Fig. 4, Table S3). In L3 larvae, as in most organisms, H3K4me2, H3K4me3, and H3K27ac are associated with active genes3, 36, 37, while H3K9me2/3 and H3K27me3 generally co-localized with heterochromatin3, 38. The genes silenced by LSM2-8, derepressed in the lsm-8-/- mutant (Fc>4 and FDR<0.05), were depleted for active marks and for H3K9me1 in WT L3 larvae (Fig. 4b; Extended Data Fig. 4a), but were almost exclusively enriched for the repressive Polycomb mark, H3K27me3. Over 95% of the genes that were derepressed in the lsm-8-/- mutant were enriched for H3K27me3 (Fig. 4b). This was true not only for the genes that met the stringent cut-off values (Fc>4 and FDR <0.05), but also for genes mildly up-regulated (2<Fc<4) in lsm-8-/- (Fig. 4b, Tables S2-S3). In contrast, only 20% of the lsm-8-/- targets carried H3K9me2, matching the genome-wide distribution of H3K9me2 on genes I L3 larvae (Fig. 4b). Approximately 40% of LSM-8 target genes bore H3K9me3, and importantly 100% of those also carry H3K27me3 (Fig. 4b, Tables S2-S3). This is similar to the level of overlap reported for H3K27me3 and H3K9me3 in L3 larvae in C.elegans36.
Figure 4. Over 93% of genes silenced by LSM2-8 carry the Polycomb mark H3K27me3.
a, Scatter plot that compares the average gene expression changes in lsm-8-/- worms (x-axis in log2, RNA-seq L3 stage) versus enrichment for a histone modification (y-axis in log2, ModEncode data of WT L3 stage). Up-regulated genes (FDR >0.05 and Fc >4 calculated by edgeR, see Methods) in the lsm-8-/- mutant are in red to the right of the black line, and genes enriched for the histone mark are above the red line (enriched over input). b, Scatter plots as (a), with each dot representing a gene. Upper row, euchromatic marks; lower row, heterochromatin marks. % indicates genes in upper right zone: LSM-8 regulated and enriched genes for indicated mark. c, Scatter plot of absolute gene expression (normalized reads count, log2) of lsm-8-/- versus WT. Red dots as in (b). Values under 6 (log2) are considered to have very low expression (pink shading). d, Relative gene expression profiles are shown as scatter plots, with Fold-change (Fc) in log2 for two RNA-seq biological replicas of L1 sorted mutant larvae versus WT. Each dot corresponds to a gene. Deletion of lsm-8 (lsm-8-/-) at the L1 stage leads to a significant increase in expression of >100 genes (FDR <0.05 and Fc >4, calculated by edgeR, see Methods and Table S4) and down-regulates <60 genes. e, Scatter plots as in (b), contrasting the gene expression changes in L1 to the enrichment of the indicated histone mark over input samples. Data shown in a-e are derived from two independent RNA-seq experiments. Statistical source data are provided in Source Data fig. 4.
Consistent with its role in Polycomb-mediated repression37, 39–41, we found that most of the genes that are significantly up-regulated by lsm-8-/-, are genes that have very low steady-state expression levels in WT worms (Fig. 4c). lsm-8-sensitive genes were not enriched on chromosomal arms nor depleted from chromosome cores (Extended Data Fig. 5b,c), unlike H3K9me3-repressed repeats 38. Other types of repression at the L3 stage, mediated by the Rb-like repressor, LIN-35, or the PRG-1/PIWI pathway, repressed genes that were not enriched for H3K27me3 (Extended Data Fig. 5b). Together, this argues strongly that LSM2-8 selectively silences endogenously H3K27me3-marked genes.
To assess whether LSM2-8 targets H3K27me3-marked genes in other developmental stages than L3 larvae, we performed total RNA-seq on synchronized and sorted WT and homozygous lsm-8-/- at the L1 larval stage. The lsm-8-/- mutation led to the up-regulation of transcripts of 151 genes (FDR <0.05 and Fc >4; 1501 genes at Fc >2), while 59 genes were down-regulated (Fig. 4d, Tables S2, S4). Importantly, lsm-8-sensitive genes were again significantly depleted for euchromatic histone marks, while 93% of the lsm-8-sensitive genes were enriched for H3K27me3 (Fig. 4e, Table S3).
Consistent with the engagement of Polycomb in cell-type or stage-specific gene repression37, 39–42, we find that in L3 larvae lsm-8-sensitive genes are enriched for genes involved in the innate immune response, body morphogenesis and cell shape regulation (Table S5). These processes are regulated by Polycomb in other species as well. Interestingly, the 22 genes that are up-regulated in lsm-8-/- at both L1 and L3 larval stages are involved in innate immunity (Tables S2, S4).
HOX gene silencing by LSM2-8 is cell-type specific
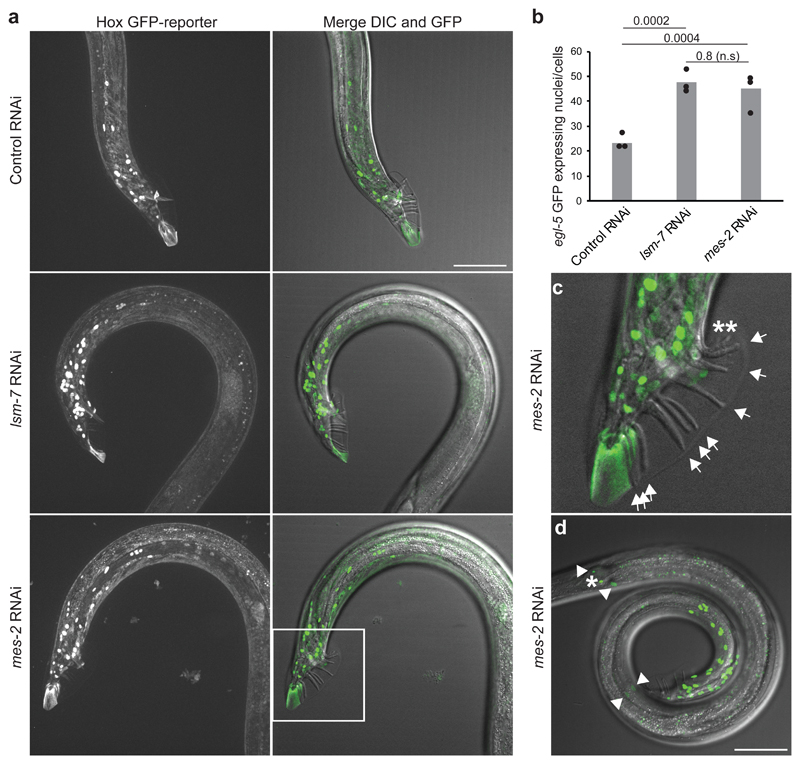
In C. elegans, PRC2 consists of MES-2/E(z)/EZH2, MES-3, and MES-6/Esc5, 43, 44. Loss of lsm-8 did not alter expression of the PRC2-complex, or of the PRC1-like factors sor-1 and sop-2 (Table S2), ruling out that lsm-8 directly controls PRC1/2. We were surprised that HOX genes, canonical targets of Polycomb with a role in body patterning, were missing from the strongly derepressed genes in the lsm-8-/- transcriptome. For example, the egl-5 gene, a conserved and Polycomb-regulated HOX gene45, 46, which is expressed in the tail regions of both hermaphrodites and males, and required for male tail development45, 47 showed only mild derepression in all lsm-8-/- replicates (log2 Fc = 0.32). However, if HOX genes are expressed in a subset of cells, it is possible that they may be below the limit of detection in whole larval RNA-seq. We therefore analyzed the expression pattern of the egl-5::gfp reporter by microscopy, comparing adult males treated with lsm-7, mes-2 or control RNAi.
As reported in Ross and Zarkower45, males lacking mes-2 displayed ectopic derepression of this reporter in the male tail region (Fig. 5a-d) and occasionally displayed anterior expansions of tail structure (Fig. 5c). Similar misexpression was found after lsm-7 RNAi, in up to 45 cells (Fig. 5a,b). Thus, cell-specific HOX locus repression is lsm-8-sensitive, strengthening the link between LSM2-8 and Polycomb.
Figure 5. lsm-7, like the EZH2 homolog mes-2, is required to silence theegl-5 Hox gene.
a, On the left, Z-projection of confocal images showing the GFP fluorescence of the egl-5 GFP HOX reporter (bxIs13) under Control (mock/L4440) RNAi, lsm-7 and mes-2 (EZH2 homolog) RNAi conditions, in adult males. On the right, merged images of the Z projection of the GFP signal with the DIC image at the best focal plan to visualize the rays of the male tail. Bar, 50 μm. b, Quantification of the number of expressing egl-5 GFP nuclei/cells under the indicated RNAi conditions per proximal region of worms. P values indicated; two-tailed unpaired t test. Bars represent mean value derived from three independent experiments, with each experimental value shown as a dot. The three experiments examined 18, 19 and 17 worms in total for RNAi conditions indicated from left to right. c, Enlarged male tail inset as in (a) showing the 9 normal rays by arrows and an example of 2 ectopic abnormal rays in mes-2 (asterisks). d, egl-5 GFP derepression is observable mostly in male tail region, as in (a) but a few nuclei (0 up to 4, as shown by the arrowheads) could also exhibit this derepression in other regions of the worm in lsm-7 and mes-2 RNAi conditions. The nucleus indicated by an asterisk express egl-5 GFP in all conditions tested. Bar, 50 μm. Data shown in a, c, and d represent results from 3 independent experiments. Statistical source data are provided in Source Data fig. 5.
lsm-8 mutation does not induce transcription from both strands nor alter splicing efficiency
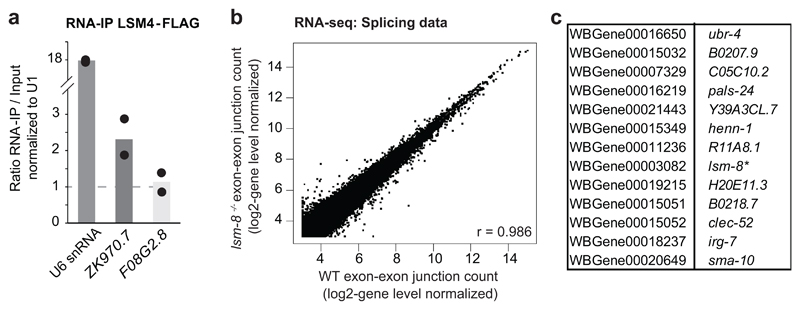
To elucidate the mechanism of LSM2-8 silencing, we carried out a careful analysis of strand-specificity by mapping the RNAs recovered in the lsm-8 mutant. This showed that derepression occurs over normal gene-coding sequences, without inaccurate termination or initiation, nor complementary strand transcription (Extended Data Fig. 6a,b). Given that the LSM2-8 complex bind (Extended Data Fig. 7a) and is known to stabilize U6 snRNA27, 30, 48, we checked our RNA-seq data for splicing defects and found no prominent ones. Out of 134'836 exon-exon junctions examined, only 18 junctions, which mapped to 13 genes, were reproducibly affected by lsm-8-/- (Extended Data Fig. 7b,c). Besides binding U6 snRNA, we also found that LSM2-8 co-precipitates with a transcript from a H3K27me3-marked gene that it regulates, and not with a lsm-8-insensitive transcript (Extended Data Fig. 7a).
LSM2-8 silences gene expression cooperatively with XRN-2
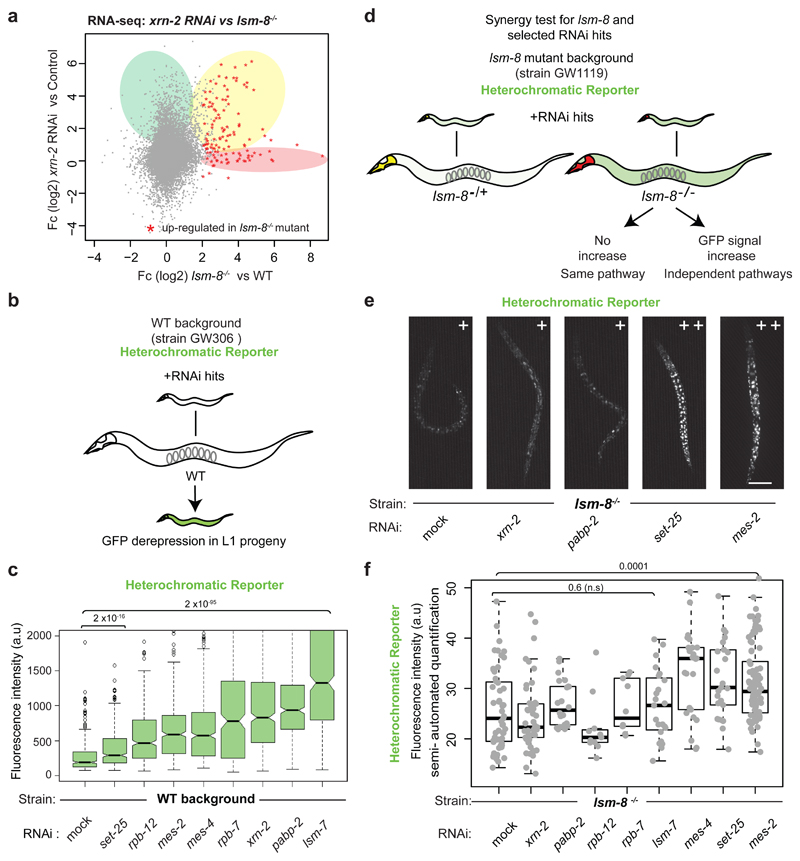
To see if LSM2-8 mediates RNA degradation, we examined further the role of XRN-2, which is an exonuclease whose loss led to reporter derepression (Fig. 1h). The comparison of RNA-seq datasets from L4 larvae treated with xrn-2 RNAi49 and lsm-8-/- L3 larvae (Fig. 6a) showed that 71% of the genes up-regulated by lsm-8-/- were also derepressed following xrn-2 RNAi (Fig. 6a, yellow) and 95% of those genes are enriched for H3K27me3 (Tables S2-S3). This argued that LSM-8 and XRN-2 likely function in the same heterochromatin silencing pathway. Nonetheless, a subset of LSM2-8 target genes (< 33%, pink) were unaffected by xrn-2 RNAi, and many genes were affected by xrn-2 independently of lsm-8 (green). This is consistent with the fact that XRN-2 has a broader range of functions50, 51. Importantly, the genes silenced only by xrn-2 (green) showed no H3K27me3 enrichment (Extended Data Fig. 5d), confirming that cooperation with LSM2-8 is only part of XRN-2’s role.
Figure 6. LSM2-8 and XRN-2 work on the same silencing pathway.
a, Scatter plot comparing relative gene expression changes of lsm-8-/- L3 larvae (this study) and xrn-2 RNAi treated L4 49. Common up-regulated genes are shaded yellow; 71% of genes up-regulated in the lsm-8 mutant (FDR <0.05 and Fc >4) are also up-regulated to some extent (50% increase) in xrn-2 depleted worms. lsm-8-/--specific up-regulated genes are shaded pink; xrn-2 RNAi-specific are shaded green. Data shown are derived from two independent RNA-seq experiments (Table S2). b, Experimental flow for testing the involvement of additional factors in LSM2-8 mediated silencing. RNAi experiments were performed in parallel in WT (b-c) and lsm-8 mutant (d-f) backgrounds, from strains GW306 and GW1119, respectively, both carrying the same heterochromatic reporter pkIs1582. Derepression assay in WT background confirming derepression following RNAi of indicated factors and RNAi efficiency. c, Quantitation of GFP expression from the heterochromatic reporter pkIs1582, scored in L1 progeny under different RNAi conditions. Fluorescence intensities are displayed as in Fig. 1e. P values are indicated; two-tailed unpaired t test. Quantitation and statistical analysis were based on n= 500 worms for each condition except for the xrn-2 RNAi where n = 295 worms. Samples were pooled from 3 independent experiments. d, Scheme for analysis of epistasis of RNAi targets with lsm-8 mutant worms bearing the reporter pkIs1582. e, Fluorescence microscopy of L4 larvae showing same/ non-additive (+) and additive (++) derepression of the reporter pkIs1582 in lsm-8-/- worms under indicated RNAi conditions. Bar, 50 μm. Data shown in e-f represent two independent experiments. f, Quantitation of GFP intensity by semi-automated analysis of microscopic images as in e, displayed as box plots overlaid with dots showing the individual sample values. Quantification and statistical analysis were based on n = 55, 45, 22, 11, 10, 23, 25, 25, 85 worms for RNAi conditions indicated from left to right, pooled from two independent experiments. P values were assessed with a two-tailed unpaired t test, and are 0.42, 0.38, 0.11, 0.76, 0.59; 0.0034, 0.0023 and 0.0001 respectively. Statistical source data are provided in Source Data fig. 6.
To see if RNA Pol II is involved in the LSM-8 pathway52, 53, we examined the effects of two RNA Pol II subunits (rpb-12, rpb-7) and the type II poly(A) binding protein pabp-2 (HsPABPN1 and SpPab2). We found that rpb-12, rpb-7 and pabp-2 RNAi each derepresses the heterochromatic reporter, as does xrn-2 RNAi (Fig. 6b,c). To see if XRN-2, RPB-12, RPB-7 and PABP-2 act on a common pathway with LSM-8, we performed RNAi against these factors in WT and in lsm-8-/- worms, and scored for additive or epistatic effects on GFP derepression (Fig. 6b,d). We found that down-regulation of xrn-2, pabp-2 rpb-12 or rpb-7, and lsm-7 was fully epistatic with lsm-8 deletion for reporter derepression (Fig. 6e,f). RNAi against the Polycomb HMT mes-2 was additive with lsm-8 deletion, albeit less so than either set-25 (H3K9me3 HMT) or mes-4 (H3K36 HMT). We conclude that LSM2-8 acts on a pathway of silencing that is dependent on XRN-2-mediated RNA metabolism, and in part on RNA pol II cofactors.
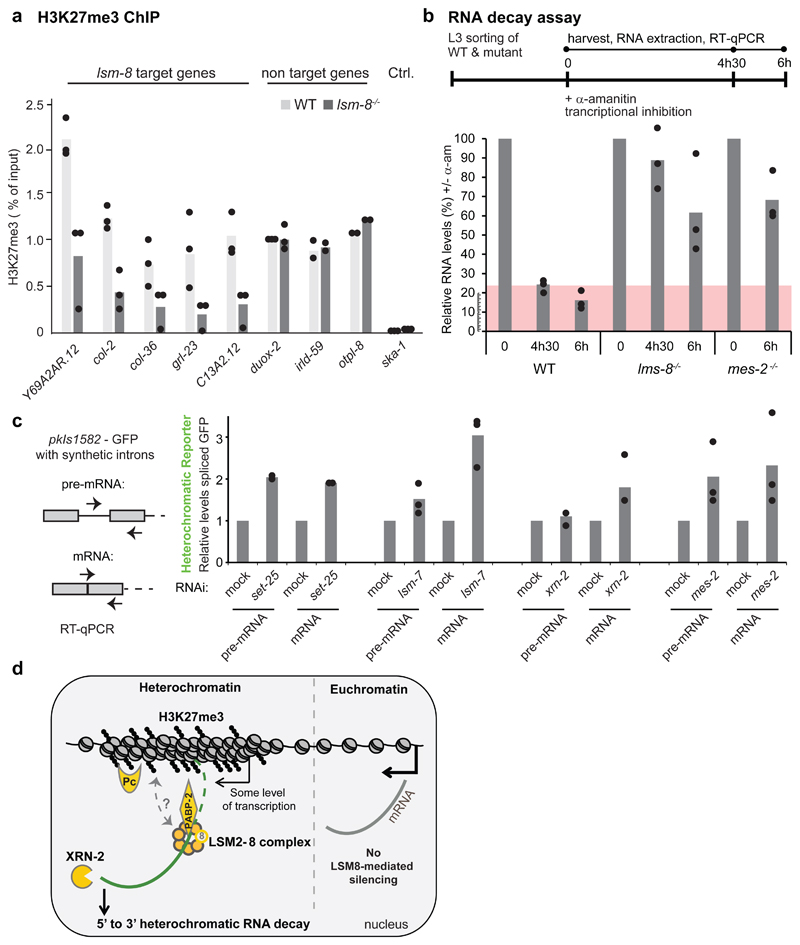
The fact that lsm-8 and mes-2 are not fully epistatic is expected, assuming that Polycomb-mediated repression is not entirely dependent on LSM-8 (Fig. 6e,f,). We next asked if LSM2-8 silencing requires the presence of H3K27me3. To this end, we tried to combine a mes-2 null mutant with the balanced lsm-8 deletion, but because each provoked sterility, this was not possible. Moreover, RNAi was extremely inefficient in the mes-2 null background. Instead, we asked whether the loss of LSM2-8 alters the accumulation of H3K27me3. Indeed, quantitative ChIP-qPCR for H3K27me3 on lsm-8 target genes showed a significant decrease (>50%) in H3K27me3 levels in lsm-8-/- vs WT larvae (Fig. 7a). Several lsm-8-insensitive genes did not. This suggests that the LSM2-8 complex feeds back to maintain H3K27me3 levels selectively at H3K27me3-marked loci, either directly or indirectly.
Figure 7. LSM2-8 mediates silencing primarily through RNA degradation.
a, H3K27me3 ChIP-qPCR on lsm-8-target genes in WT and lsm-8-/- worms. Bars represent mean value derived from three independent experiments, with each experimental value shown as a dot, except for otpl-8 and irdl-59, for which two independent experiments were done. b, WT lsm-8-/- and mes-2-/- worms treated with 50 µg/ml of the transcriptional inhibitor α-amanitin for indicated times. Levels of transcripts from 3 genes regulated by LSM-8 (see Extended Data Figure 7) were tested by RT-qPCR and normalized to 18S rRNA levels. 0h was defined as 100%. c, RNA levels of the pre-mRNA and mRNA of GFP from the heterochromatic reporter pkIs1582 from the strain GW306 were determined by RT-qPCR and normalized to pmp-3 mRNA. The levels on mock RNAi conditions are defined as 1. mes-2 RNAi depletes MES-2/PRC2-like and H3K27me3 levels; set-25 RNAi depletes SET-25 and H3K9me3 levels. Bars in b and c represent mean value derived from three independent experiments, with each experimental value shown as a dot.
d, LSM2-8 complex and XRN-2 silence transcripts arising from heterochromatic H3K27me3-enriched domains through RNA degradation. The LSM-8 mediated silencing pathway makes use of XRN-2 ribonuclease, and may involve other transcript binding factors, such as PABP-2 (HsPABPN1, see Discussion). We hypothesize that RNA arising from H3K27me3 genomic regions that are controlled by the LSM2-8 complex may acquire a specific feature during transcription (e.g. a specific structure, RNA modification, 3'UTR, poly-A/U tail, or specific RNA binding protein(s)), that allows recognition and processing by LSM2-8. LSM2-8-mediated silencing also feeds back to regulate H3K27me3 levels on LSM-8-regulated genes, although it is unclear if the interaction with PRC2 or H3K27me3 is direct (dotted arrow). The LSM-2-8-mediated silencing of H3K27me3-bound loci defines a selective post-/co-transcriptional silencing through RNA decay, beyond the transcriptional repression attributed to facultative heterochromatin. Statistical source data are provided in Source Data fig. 7.
LSM-8 and XRN-2 cooperate to promote RNA decay
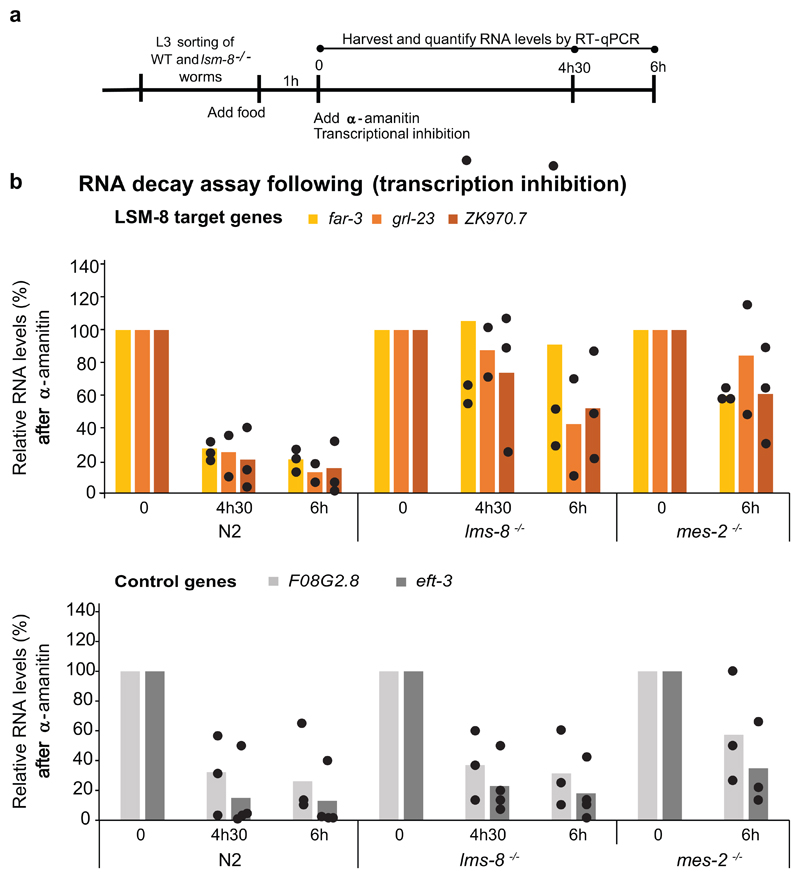
The cooperation between the RNA-binding LSM2-8 complex and XRN-2 suggests that LSM2-8 may silence genes by triggering mRNA degradation. To test this, we added α-amanitin, an inhibitor of RNA pol II and pol III elongation, to L3 larvae and monitored RNA decay over 6 hours by RT-qPCR comparing WT, lsm-8-/- and mes-2-/- strains. mRNA signals were normalized to 18S rRNA levels which are insensitive to α-amanitin (Extended Data Fig. 8a). We monitored a delayed rate of decay for lsm-8-sensitive genes in the absence of LSM-8 (Fig. 7b). The rate varied slightly among the three genes monitored (far-3, grl-23 and ZK970.2), yet all were significantly different from lsm-8-insensitive control genes (eft-3, F08G2.8; Fig. 7b, Extended Data Fig. 8a). This suggests that the elevated levels of mRNA detected in lsm-8-/- worms stem from RNA stabilization and that the LSM2-8 complex can silence by targeting specific transcripts for degradation. Importantly, a similar increase in mRNA stability was scored in the mes-2 mutant for lsm-8-sensitive transcripts (Fig. 7b, Extended Data Fig. 8a), implicating H3K27me3 as a pre-requisite for LSM8-mediated RNA degradation.
To see whether RNA degradation is co- or post-transcriptional (i.e. acting primarily on nascent or mature transcripts), we compared the levels of unspliced and spliced mRNA derived from the pkIS1582 reporter, following lsm-7, xrn-2 and mes-2 RNAi. The set-25 RNAi served as a control. We reasoned that if spliced mRNA levels are higher than the pre-mRNA levels following lsm-7 RNAi, then the mRNA degradation is likely to be post-transcriptional. Loss of H3K9me HMT SET-25 altered pre-RNA and mRNA levels equally, as we could expect for transcriptional repression (Fig. 7c). In contrast, qPCR showed a much stronger accumulation of mature mRNA over pre-mRNA following lsm-7 and xrn-2 RNAi. This suggests that LSM2-8 and XRN-2 act primarily on degradation of mature RNAs. The mes-2 RNAi had an intermediate effect that could be interpreted as a dual role: both targeting LSM2-8 to degrade mRNA and it repressing transcription (Fig. 7c).
Our data suggest that LSM2-8/XRN-2 confers a secondary level of regulation for the repression of Polycomb-marked genes, by mediating the degradation of processed RNAs (Fig. 7d).
Discussion
We show here that nematodes use a conserved RNA binding nuclear complex, LSM2-8, and a nuclear 5’-3’ exoribonuclease, XRN-2, to ensure tight repression of facultative heterochromatin bearing the Polycomb deposited mark, H3K27me3. This is achieved post-transcriptionally through specific degradation of mRNA. Heterochromatin-linked RNA processing pathways in plants and fission yeast, which include the RITS, TRAMP and exosome complexes7–9, 54, silence by targeting a H3K9 histone methyltransferase to heterochromatic regions. While the principle of using post-transcriptional silencing to reinforce transcriptional repression seems to be similar, the C. elegans pathway acts independently of H3K9-specific HMTs. We observe LSM2-8-mediated silencing of endogenous transcripts arising almost exclusively from genes marked with H3K27me3, in the transcriptomes of both L1 and L3 larvae. Derepression of a Polycomb-marked reporter could be detected in nearly every somatic cell and tissue of lsm-8 deficient worms, with exception of the germline. The process seems to require, at least in part, the presence of the C. elegans EZH2 homolog MES-2, and acts in parallel to H3K27me3-mediated transcriptional repression.
Figure 7d illustrates a proposed mode of action. LSM2-8 complex could be targeted either by H3K27me3, by MES-2 (EZH2), or by a unique but unknown feature of the nascent transcripts, such as a specific structure, 5’cap, RNA modification, or poly-A/U tail. The conserved nature of the LSM proteins and of other factors implicated in this pathway (XRN-2, MES-2, and PABP-2) suggests that this mechanism might be active in other species.
Our genetic studies implicate the type II poly(A) binding protein (PABP-2)55 and the RNA Pol II subunits, RPB-12 and RBP-7, in LSM-8-targeted RNA decay. The pathway acts independently of DCAP-2, XRN-1, LSM-1 and H3K9me-binding factors. PABP-2 is nuclear and appears to regulate 3’UTR and poly(A) tail length56 and binds nascent RNAs early during the elongation step57, 58. Given that the LSM2-8 complex is known to bind to the 3’ oligo(U) tail of the U6 snRNA48, as well as 3’ poly(A+) nuclear RNAs28, we hypothesize that PABP-2 could contribute to the specificity of LSM2-8/XRN-2 transcript degradation by modulating the 3’ end of mRNAs derived from H3K27me3-marked genes.
The misregulation of egl-5, however, was only observed in ~45 posterior cells in male worms44–46, 59, 60, mimicking the derepression scored upon loss of MES-2, the EZH2 homologue. This suggests that LSM2-8 and XRN-2 likely regulate even more developmentally relevant, tissue-specific H3K27me3-marked genes.
Many other factors may be involved in the observed degradation events, although two other Polycomb-like factors, SOR-1 and SOP-2, did not score as hits in our genome-wide screen for array derepression25. Nonetheless, they contribute to HOX gene silencing61, 62, and may help target LSM2-8/XRN-2 message degradation. Similarly, the loss of the RNA Pol II subunits RBP-7 and RBP-12 were shown to derepress a H3K27me3-marked reporter epistatically with lsm-8-/-. The S. pombe RBP-7 homolog has been implicated in centromeric repeat transcription and RNAi-directed silencing63, while in S. cerevisiae, the same RNA Pol II subunit contributes to Pat1/Lsm1-7 mediated mRNA decay in the cytoplasm52, 53. Thus we can hypothesize that RPB-7 and RPB-12 somehow tag LSM2-8-regulated transcripts for XRN-2 degradation.
Finally, we have shown by ChIP that H3K27me3 levels drop on LSM-8-sensitive genes in lsm-8-/- animals, suggesting that there is feedback from the post-transcriptional silencing machinery to the chromatin, to enhance transcriptional repression. A recent but still debated suggestion was made that ncRNAs that bind PRC2, such as Xist or HOTAIR, help target Polycomb in cis or in trans to target gene64–67. This could parallel the feedback loop documented here. Overall, our study shows that facultative heterochromatin in a multicellular organism can be silenced through a mechanism of selective transcript degradation, and not only by transcriptional repression. LSM2-8-mediated gene silencing furthermore links a specific epigenetic state to transcript degradation, adding an additional layer of control over differentiation and development.
Methods
Worm strains and growing conditions
Table S1 lists the strains and primers used in this study. Strains with deletion alleles and reporters obtained from the C. elegans knockout consortium or made by the CRISPR/Cas9 system were outcrossed 2 to 6 times to the N2 (WT) strain. Worms were grown on OP50 and maintained at 22.5°C, except when frozen or manipulated at room temperature (RT).
The lsm-8 deletion allele xe17 (sequence below) was generated by replacing the entire coding sequence of the lsm-8 gene with the red pharynx marker [myo2p::mCherry::unc54 3’UTR] using an adapted version of the CRISPR/Cas9 technique68. For this, the N2 worms were injected with the following mix pDD162 (Cas9)69 100 ng/μl, LSM8 sgRNA1 (Fwd) in PIK111 100 ng/μl, LSM8 sgRNA3 (Rev) in PIK111 100 ng/μl, the indel plasmid lsm-8Δ-mCherry in pIK37 100 ng/μl and Pmyo-3::gfp 5 ng/μl.
DAPI staining and live microscopy
DAPI staining was carried out on WT and lsm-8-/- (handpicked) worms from different developmental stage (not mixed) and mounted on poly-L-lysine coated slides. Two independent biological replicates were performed. The freeze cracking of worms by liquid nitrogen in Eppendorf tubes was followed by fixation for 5 min in methanol at -20°C, and 2 min in 1% paraformaldehyde at RT for all stages. After fixation, 3 x 5 min washes with PBS supplemented with 0.25% TritonX100 (PBSX) were done with the last wash optionally lasting overnight (ON) at 4°C. DAPI (1μg/ml) was added for 10 min at RT and was washed twice before mounting the slides with n-propyl gallate. For live imaging, animals were mounted on slides coated with 2% agarose pads, supplemented with 0.1% sodium azide and 1mM levamisole, in most cases.
Microscopy was carried out on a spinning disc confocal microscope (AxioImager M1 [Carl Zeiss] + Yokogawa CSU-22 scan head, Plan-Neofluar 100×/1.45 NA oil objective, EM-CCD camera [Cascade II; Photometrics], and VisiView 2.1.4 software, either Axo imager 2.1 Zeiss, (Fig. 1b, Fig. 2d-e, Fig. 6e, Extended data Fig. 1b, Extended Data Fig. 2d). Images, 3D reconstruction (maximum intensity Z-projections) and fluorescence intensity analysis were generated using Fiji/ImageJ software.
RNAi experiments
RNAi was performed at 22.5°C by placing synchronized L1 worms on feeding plates as previously described70. Synchronized L1 larvae were obtained by bleaching gravid adults and the eggs recovered were left to hatch overnight at RT in M9. All RNAi clones used against LSM complexes subunits and used in the targeted RNAi screen were sequenced and a blast analysis performed first to confirm the specificity of the targets. At least, three independent biological replicates were performed for each RNAi experiment. As a mock RNAi control, the L4440 vector (Fire vector library) was modified by removing an EcoRV fragment containing 25b.
For RNAi against xrn-2, bacteria expressing dsRNA were diluted with mock RNAi bacteria to feed the GW306 and GW1119 strain in order to get a milder phenotype and thus enough progeny in which to assess derepression. Both lsm-8 heterozygous and homozygous worms (GW1119) were subjected to RNAi treatment, but only homozygous worms were used to assess the RNAi effect. For the RNAi with LSM-8 potential co-factors, most of the chosen candidates were LSM2-8 subunits related or controls. Co-regulated genes, such as rpb-7, rpb-12 and pabp-2 were predicted though a clustering analysis in SPELL (http://spell.caltech.edu:3000/).The derepression was assessed by the worm sorter as described in Figure 1 for RNAi hits that produce L1 larvae in the next generation.
Quantitation of derepression
Derepression was scored at specific developmental stages by fluorescence microscopy using standardized exposure and illumination conditions. Quantitation of GFP intensity in different conditions was done using Fiji/ImageJ software and the ROI manager, for semi-automated analyses.
Quantitation of derepression by the worm sorter, COPAS BIOSORT (Union Biometrica), was performed in L1 worms according to manufacturer’s guidelines. Visual inspection of the selected and monitored worms showed that >99% of all worms matched the size criteria (Extended Data Fig.2a). Data corresponding to the fluorescence intensity (PH Green or PH Red) were analyzed and plotted in boxplots using R studio. The EXT (1-5) was extracted to exclude possible remaining bacteria. The reporter fluorescence intensity can fluctuate even in mock RNAi condition or WT according to the laser intensity (that can fluctuate slightly over time), to the room temperature, and possibly to additional parameters. Therefore, each derepression assay refers to its controls.
Survival assay
Worms of indicated genotypes were synchronized by bleaching, and when they reached the L4 stage (Day 2 at 22.5°C), ten worms were isolated onto plates containing OP50 bacteria. Four independent biological replicates were performed. The number of worms alive was determined every 24h. At Day 4, surviving adults worms from each genotype (even sterile ones, lsm-8-/- and met-2 set-25; lsm-8-/-) were transferred to a new plate to avoid contamination with the progeny and at Day 6, only adults of WT and met-2 set-25 strains were transferred, since the other sterile worms were too fragile to move without being killed.
Chromatin Immunoprecipitation (ChIP) experiments
~20,000 WT and lsm-8-/- homozygous L3-L4 larvae stage were isolated using the COPAS BIOSORT instrument (Union Biometrica), according to manufacturer’s guidelines. Three independent biological replicates were performed. Visual inspection of the sorted worms showed that >90% of all worms were expressing appropriate markers (i.e., red fluorescence but no GFP expression in the pharynx for lsm-8-/-, and no markers for the WT) and 90% matched the desired size and morphological criteria that corresponds to the stage of interest.
Antibodies used for the ChIP were rabbit anti-H3K27me3 (ChIP, Millipore, 07-449), whose specificity was confirmed by peptide binding, and IF on a mes-2 mutant.
H3K27me3 ChIP was performed as previously described 4. In brief, chromatin was incubated overnight with 3 µg of antibody coupled to Dynabeads Sheep Anti-Rabbit IgG (Invitrogen), in FA-buffer (50 mM HEPES/KOH pH7.5, 1 mM EDTA, 1% Triton X-100, 0.1% sodium deoxycholate, 150 mM NaCl) containing 1% SDS. Chromatin/ antibody complexes were washed with the following buffers: 3 x 5 min FA buffer; 5 min FA buffer with 1M NaCl; 10 min FA buffer with 500 mM NaCl; 5 min with TEL buffer (0.25 M LiCl, 1% NP-40, 1% sodium deoxycholate, 1 mM EDTA, 10 mM Tris-HCl, pH 8.0) and twice for 5 min with TE. Complexes were eluted at 65°C in 100 µl of elution buffer (1% SDS in TE with 250 mM NaCl) for 15 min. Both input and IP samples were incubated with 20 µg of RNAse A for 30 minutes at 37°C and 20 µg of proteinase K for 1 h at 55°C. Crosslinks were reversed overnight at 65°C. DNA was purified using a Zymo DNA purification column (Zymo Research).
RNA-IP in native conditions
Enriched L3 stage worms (GW1004 which contains extrachromosomal arrays expressing LSM-4-GFP/3xFLAG-tagged from a fosmid which was obtained from the “C. elegans TransgeneOme” consortium) were collected as 300-500 μl of pelleted worms and lysed at 4°C with a Dounce Tissue Grinder (150 strokes for each 500 μl, BC Scientific, Miami, FL, USA) in an equal volume of lysis buffer (30 mM HEPES/KOH pH 7.4, 100 mM KCl, 1.5 mM MgCl2, 0.1% Triton X-100, Protease Inhibitor Cocktail Tablets, EDTA-free, Roche Rnase inhibitor, rRNAsin 1.25μl/ml of lysis buffer). Lysates were cleared at 16 000 x g for 15 min. 4 mg of lysate proteins were incubated with 40 μl of pre-washed anti-FLAG M2 magnetic beads (Sigma–Aldrich) for 2 h. Washes were performed in lysis buffer. For RNA extraction, washed magnetic beads were resuspended with 100 μl of lysis buffer and 400 μl Trizol® (Ambion) and the samples were snap-frozen in liquid nitrogen. Two independent biological replicates were performed.
RNA extraction
For the RNA-seq experiment WT, met-2 set-25, lsm-8-/-, and met-2 set-25; lsm-8-/- worms were isolated using the COPAS BIOSORT instrument according to the fluorescent criteria (non-green pharynx worms, Extended Fig.3) using the size criteria of L3 stage larvae in 4 independent biological replicates. For L1 RNA-seq experiment, worms were synchronized prior to the sorting process. Synchronized L1 larvae were obtained by bleaching gravid adults and the eggs recovered were left to hatch 16h at RT in M9.The isolation of WT and lsm-8-/- L1 larvae was made similarly with the fluorescent criteria (non-green pharynx worms) and the size criteria of L1 stage larvae. The larvae were refed for 2.5h after the sorting process. For all RNA based experiments, before RNA extraction, worms were washed 3x in M9 and re-suspended in 100μl of M9, 400μl of Trizol® (Ambion) and snap-frozen in liquid nitrogen.
Extraction of RNA used 4 freeze-thaw cycles from liquid nitrogen to a 42°C heat bath, followed by the addition of 200μl of Trizol® to each sample. Vigorous vortexing at RT in 5 cycles (30 sec vortex, 30 sec on ice), was followed by 5 min at RT. RNA extraction was with 140μl chloroform, vigorous shaking for 15 sec, and 2 min at RT. The samples were centrifuged at 12000 rcf at 4°C, and the aqueous phases were transferred to fresh tubes. An equal volume of 70% EtOH was added slowly and the homogeneous mixture was transferred to a Qiagen RNeasy spin column (RNeasy kit, QIAGEN 74104). QIAGEN protocols including a subsequent 30 min DNAse treatment. For L1 RNA-seq samples, the extraction was done using the Zymo DirectZol microRNA kit (R2060).
RT-qPCR
Primers were designed to be exon-junction spanning where possible, and are listed below. cDNA synthesis was performed using the (AMV cDNA kit, NEB, E6550S) according to the manufacturer’s protocol using random primers and 0.1-3 µg of total RNA per sample according to the experiment. qPCR was performed on a StepOnePlus real time PCR system (Applied Biosystems) using SYBR Green Mastermix (Applied Biosystems; 4309155). Further analysis was done in Microsoft Excel. All primer pairs were tested and selected for amplification efficiencies ranging from 85-100%. For gene expression analysis in Fig. 1 and Extended Data Fig. 1, ΔΔCT method was used, his-56 and pmp-3 were used for sample normalization. For ChIP-qPCR, sample data were normalized to corresponding input chromatin. Candidate genes were chosen in Fig. 7 based on their expression changes and on their enrichment for H3K27me3 in WT worms. For RIP-qPCR in Extended data Fig. 7, RNA levels were normalized to corresponding input and to the U1snRNA levels.
RNA decay assay
WT, lsm-8-/- and mes-2-/ - (F2) L3 larvae were sorted and re-fed with OP50 in liquid culture for 1 h at RT. Subsequently α-amanitin (Sigma-Aldrich) was added to a final concentration of 50 mg/ml, to block transcription and stall larval development 51. About 750 worms were harvested in duplicate in each of the three independent biological replicates, and for each sampling point. They were washed twice with M9 medium, resuspended in 400 ml of Trizol® (Life Technologies) and frozen in liquid nitrogen. To assess the RNA decay, RNA levels of genes affected or not by the LSM2-8 complex (expression level) were quantified before and after the transcriptional inhibition in each genotype. LSM-8 target genes were selected by their higher expression levels in lsm-8-/- versus WT (RNA-seq), and their enrichment for H3K27me3 in L3 larvae, yet it was desired to have detectable levels in WT control. In this assay, cDNA was generated from total RNA by the SuperScript III First-Strand Synthesis System (Thermo Fisher Scientific) using random primers and the 5x FS buffer for better yields. Three micrograms of total RNA were used as a template for reverse transcription reaction (20μl), and 0.66μl of the reaction was used for qPCR reaction (10μl). RT-qPCR for this assay was performed using PowerUp SYBR Green Master Mix (Thermo Fisher Scientific), specific primers for mature/spliced mRNAs (complementary to an exon-exon junction; grl-23, F08G2.8) or for pre- and mature mRNAs (far-3, ZK970.7) or for pre-mRNA only (eft-3) and using StepOnePlus Real-time PCR Systems (Applied Biosystems) according to the suppliers’ protocols. For primer sequences for eft-3 and 18S ribosomal RNA, see51. Because pre-mRNA levels are expected to be more directly affected by transcription inhibition, eft-3 pre-mRNA was used by us and by others51 as a control for the efficiency of the α-amanitin treatment in inhibiting transcription. The high expression levels of eft-3 makes it an adequate control to verify the potential extent of the transcriptional inhibition. In addition, eft-3 is also a control gene in the sense that it is not regulated by lsm-8.
RNA-seq
Total RNA was treated for the L3 samples additionally with the Turbo DNA free kit (Ambion, AM1907), depleted for rRNA using Ribo-Zero Gold kit from Epicentre and depletion validated through Agilent Bioanalyzer analysis. Subsequent library preparation was performed with a ScriptSeq v2 RNA-Seq library preparation kit, stranded (Epicentre). Library preparation for the L1 samples was performed with the TrueSeq Total RNA preparation kit, stranded (Illumina). The quality of the resulting libraries was assessed with an Agilent Bioanalyzer and concentrations were measured with a Qubit fluorometer prior to pooling. 50 bp single-end sequencing was done on an Illumina HiSeq 2500.
Processing of the RNA-seq and ChIP-Seq data
The RNA-seq samples from four independent biological replicate samples L3 were mapped to the C. elegans genome (ce6) with the R package QuasR v1.22.0, (www.bioconductor.org/packages/2.12/bioc/html/QuasR.html) with the included aligner bowtie 71 considering only uniquely mapping reads for mRNA. The command "proj <-qAlign("samples.txt","BSgenome. Celegans.UCSC.ce6")" instructs bowtie to align using the parameters "-m 1 --best --strata --phred33-quals". Since the used replicas differed slightly in timing (Extended Fig. 4), we incorporated a blocking factor in the linear model treating the replicates as different batches. For splice junction quantification we used the spliced alignment algorithm SpliceMap72. The command used was "proj <- qAlign("samples.txt","BSgenome.Celegans. UCSC.ce6",splicedAlignment=TRUE)". The command to create various count tables was qCount(proj,exons,orientation="same"). For gene quantification, gene annotation from WormBase was used (WS190). The EdgeR package v 3.24.0 was used to determine fold changes (Fc) and false discovery rates (FDR) of differential transcript abundances. The repeat element quantitation was based on UCSC (genome.uscsc.edu) repeat annotation. To normalize for sequencing depth, each sample was divided by the total number of reads and multiplied by the average library size. Transformation into log2 space was performed after the addition of a pseudocount of 8 in order to minimize large changes in expression caused by low count numbers. The various count tables used throughout this study were normalized separately. To determine the developmental timing of each RNA-seq sample, we previously used a set of 2050 genes shown to gradually rise between 25h and 36h post hatching at 25°C (all rising genes)35. While most of those genes are germline genes and thus stop being expressed in glp-4 mutants which are devoid of germ cells (Extended data Fig. 4a), we noticed that a subset of those rising genes (n=162) actually still continued to rise even in glp-4 mutant worms35 (Extended data Fig 4a). We therefore split the 2050 genes into two separate groups, a germline developmental signature (n=1888) and a somatic developmental signature (n=162) and used the latter to infer developmental timing (Extended data Fig 4a). To quantify potential changes in splicing in lsm-8-/- as opposed to WT, we quantified the expression of all the exon-exon junctions from the spliced alignments using no annotation. The command used to create the exon-exon junction count table was qCount(proj2,NULL,reportLevel="junction"). These junction counts were then normalized for library size (as described above) and overlapped with gene annotation to assign them to their host gene. Junctions overlapping multiple genes were discarded. The assignment to the host gene was then used to correct the junction expression levels for differences in gene expression. This was done by dividing the junction counts of either WT or lsm-8-/- by the respective gene expression change depending on the direction of the change. This procedure ensured that junction counts were always deflated and not inflated by the gene expression correction. Finally a pseudocount of 8 was added and the data were log2 transformed. We specifically chose to not use reads overlapping intronic sequences for this analysis as they can reflect changes in mRNA transcription73 and thus would potentially complicate the interpretation of those results in the light of alternative splicing. The RNA-seq L1 samples were mapped to the C. elegans genome (ce10) and processed otherwise as mention above (no blocking factor applied, as for L3). The ChIP-seq data for L3_H3K9me1/2/3 (5036, 5050, 5037, 5040), L3_H3K27me3 (5045, 5051), L3_H3K27ac (5054), L3_H3K4me2/3 (5055, 3576) were downloaded from ModEncode (http://data.modencode.org/) and mapped to ce6 and ce10 using bowtie considering only uniquely mapping reads. Quantitation for each gene was performed by counting the reads overlapping the gene-body. All samples were normalized for total library size, log2 transformed after adding a pseudocount of 8 and and Fc enrichments (log2) were calculated by subtracting the log2 transformed values of the specified input sample (3576, Rep-1) from each ChIP-seq sample.
Misregulated genes in the prg-1 and lin-35 mutants74, 75 were converted into WB gene names through the Gene ID conversion tool (DAVID), and the resulting genes were compared to their enrichment in H3K27me3 similarly as for the misregulated genes in the lsm-8 mutant (Table S3). Sequence information for xe17 allele [lsm8 indel myo2p::mcherry::unc-54 3'UTR] and flanking regions can be found in Supplementary Information.
Statistics and reproducibility
Experiments shown in this study were performed independently two to four times as indicated in the figure legends, and no inconsistent results were observed. The exact information on number of independent biological replicates and exact sample size of each is indicated in each figure legend. RNA-seq data of each genotype was performed in four replicates for the L3 stage. The two closest (developmentally timed), were used for the main analysis, but the other datasets were used for additional validations. Data plotted as Notched box plots have whiskers: 25th and 75th percentiles, minima and maxima 5th and 95th percentiles, black circles are outliers, thick lines: median, and the Notch around the median represents 95% confidence interval of the median. Some data are plotted in bar graphs as mean ± s.d, unless specified otherwise. Bar graphs are overlaid with dots representing individual biological replicates or sample values, as stated in the legends. Statistical testing to assess p values was performed using unpaired two-tailed t tests. False Discovery Rate (FDR) index was calculated with the edgeR package, see Methods. Details of the particular statistical analyses used, precise P values, statistical significance, number of biological replicas and sample sizes for all of the graphs are indicated in the figure or figure legends. n represents the number of animals tested, unless mentioned otherwise. The source data for all figures are provided.
Extended Data
Extended Data Fig. 1. LSM proteins are highly conserved and silence heterochromatic, but not euchromatic reporters.
a, LSM protein comparison between C. elegans and H. sapiens. b, Heterochromatic reporters derepression at all developmental stages. lsm-7 RNAi is compared to control RNAi. Derepression monitored by GFP live imaging was assessed at the embryonic stage (strain GW566, Table S1, Bar: 10 μm), with nuclei enlarged in the inset and at larval stages L1-L4, (strain GW306, Table S1, Bar: 50 μm, Bar: 100 μm for gravid adults). These observations were repeated ten times independently with similar results. c, Quantitation of derepression assays. In L1 progeny under gut-2/lsm-2, lsm-5, lsm-6 and control RNAi conditions (mock: negative control and mes-4: positive control), the GFP fluorescence intensity of the heterochromatic reporter pkIS1582 was measured by the worm sorter. F2: second generation. Quantification and statistical analysis were based on n =375 worms for each condition pooled from three independent experiments. Data are displayed as in Fig. 1e. P values indicated were calculated with a two-tailed unpaired t test. d, Quantitation of derepression of different heterochromatic reporters (Table S1). P values indicated were calculated with a two- tailed unpaired t test. Quantification and statistical analysis were based on n= 1460, 2399, 2631, 3850, 634, 1855 worms for conditions indicated from left to right, pooled from two independent experiments. e, Confirmation of lsm-1 and lsm-7 knockdown by RNAi. qPCR analysis of lsm-7 and lsm-1 mRNA in L1 worms upon mock, lsm-7 or lsm-1 RNAi treatments. lsm-7 and lsm-1 mRNA are expressed relative to the levels in mock RNAi condition. Bars represent mean value derived from three (lsm-7 RNAi) and two independent experiments (lsm-1 RNAi), with the value of each experiment shown as dots. f, Quantitation of fluorescence intensity of the euchromatic reporter (GW849, gain2) in L1 progeny as in (c). P values calculated as in (c). Quantification and statistical analysis were based on n =375 worms for each condition pooled from three independent experiments. g, Same as in (f), with a gain=1) for the fluorescence of both the heterochromatic (GW306) and euchromatic (GW849) reporters. P values as in (c). Quantification and statistical analysis were based on n =370 worms for each condition, pooled from two independent experiments.
Statistical source data are provided in Source Data Extended Data Fig. 1.
Extended Data Fig. 2. lsm-8-/- mutant worms are 100% sterile but developing gonads resemble WT through L3 and L4 stages.
a, Z-projection of confocal images showing fixed DAPI staining of a WT (N2) worm, at L3 stage. Gonad arms are highlighted by the red dashed line and same to right with a lsm-8-/- L3 larva (GW1125). b, Quantification of the length, width and gonad nuclei count. Bars represent mean value derived from two independent experiments, with the value of each experiment shown as the dot. The two experiments examined 4 worms in total per genotype. c, DIC image of a WT young adult (YA) with a normal anatomy and normal gonad (red dashed line) with oocytes (pink shading). The white arrow indicates the vulva as in YA. DIC image of lsm-8-/-, lsm-2-/- and lsm- 5-/- YA. The gonad (red dashed line) has no forming oocytes and has an abnormal composition of cells at that stage. Black arrows indicate the presence of vacuoles. d, Heterochromatic reporter (pkIs1582) derepression in WT (GW306) background following lsm-7 RNAi in a L4 larva. The enlargement to the right shows the gonad (red dashed line) with germ cells which are not derepressed. e, Merge DIC and live GFP microscopy of lsm-8 mutant (GW1119) carrying the heterochromatic reporter pkIs1582, at the L4 larvae stage as confirmed by the vulva in the inset. The derepression of the reporter in the gonad is not detectable in germ cells, but is in the somatic gonad cells marked with asterisks: DTC (distal tip cells), gonadal sheath, spermathecal cells. f, Z-projection of confocal images showing the nuclear GFP derepression of the heterochromatic reporter pkIs1582 (GW1119) in nearly all if not all somatic cells of an lsm8-/- worm. g, GFP and DIC merged images at a single focal plan showing the optimal view of germ cells (inside dashed red line), which are not derepressed in lsm8-/- worm (GW1119) even treated with RNAi against piRNA factors such as csr-1. Scale Bar in a, c-g, 50 μm. Data in a and c-g represent results from three independent experiments, except for a and g, where the experiments have been performed twice with similar results.
Statistical source data are provided in Source Data Extended Data Fig. 2.
Extended Data Fig. 3. Worm sorting and quantification settings based on gating region.
a, COPAS Biosort conditions optimised for the quantification of the heterochromatic reporter fluorescence. The COPAS Biosort (Union Biometrica) machine is an adapted flow cytometry version that can be used in order to quantify and collect worms according to their size and fluorescence criteria. The upper panel reflects the gating region based on the extinction peak height (ExtPH) and the extinction peak width (ExtPW) selecting the L1 worm population, as determined empirically in pilot experiments by verifying the stage through microscopic examination of sorted worms with this gate criteria. The same criteria gating was identical for every quantification of the heterochromatic reporter fluorescence. The lower panel shows the worm distribution of the size-selected worms based on green parameters (green peak height (green PH) and green peak width (green PW). A, represents the fluorescence of the heterochromatic reporter (GW306) in control RNAi condition and b, in lsm-7 RNAi conditions. c, COPAS Biosort conditions optimised for the sorting of homozygous lsm-8 mutant at the L3 stage. The upper panel reflects the gating region based on the extinction peak height (ExtPH) and the extinction peak width (ExtPW) selecting the L3 worm population. The lower panel shows the worm distribution based on green parameters (green peak height (green PH) and green peak width (green PW)), the second gating region shown
in that panel selects here the non-green worms, homozygous for lsm-8. The gating strategies were determined empirically in pilot experiments by verifying the size, shape gonad and vulva developmental stage by microscopic examination. Morphological validations during the sorting process were also performed. Sorting of the homozygous animals was done by selecting non- GFP pharynx animals, and the gating was also determined stringently by examining the two populations and by verifying the different criteria with fluorescent microscopy.
Extended Data Fig. 4. Control of the developmental timing of the RNA-seq samples within the L3 stage.
a, Gene expression data were collected over larval development at 25°C and the average expression of somatic genes that were found to increase during this time course (rising somatic genes) is plotted in the left part ([35], see Methods). This analysis allowed us to compare the average expression of somatic genes that increase naturally during development to the average expression in our RNA-seq samples within the L3 larval stage. Samples from the four biological replicates of the four different genotypes that were the closest by developmental timing were selected accordingly and assigned to replica 1 and replica 2. Those two matched replicates (developmentally timed) were used for the main bioinformatics analysis, but the other samples were used for additional validations, and confirmed the main findings. b, Relative gene expression profiles as scatter plots. Fold-change (log2) in gene expression of two biological replicas of RNA-seq from sorted L3 worms of lsm-8 -/-, met-2-/- set-25-/- and the triple (lsm-8-/-, met-2-/- set-25-/-) mutant versus WT. Each dot corresponds to a gene. Red dots here are rising genes, genes with increased expression level during the time course described [35], which do not change significantly in any of the mutant strains. Statistical source data are provided in Source Data Extended Data Fig. 4.
Extended Data Fig. 5. Genes silenced by LSM2-8 have a low steady-state expression and are not enriched on chromosome arms.
a, Scatter plots comparing the mean of log2(Fc) in lsm-8-/- vs WT (x axis) from two independent RNA-seq with the H3K9me1 mark ChIP-seq data and with additional ChIP- seq data for H3K9me3 and H3K27me3 (y axis) from ModEncode using different antibodies than those used in Figure 4. b, Scatter plots comparing absolute transcript abundances (log2 of normalized reads count) of annotated genes in lsm-8-/-, met-2-/- set-25-/- and the triple (lsm-8-/-, met-2-/- set-25-/-) mutant versus WT from the two biological replica 1 and 2. Boxes with pink background indicate low abundance values smaller than 6 in log2 scale for genes considered to be repressed in WT. This corresponds to <64 normalized RNA-seq reads per gene, in contrast to 1024 reads per gene represented by a value of 10. Note the large proportion among the genes upregulated in the assessed mutants (above the diagonal), which are repressed or very poorly expressed in WT. c, Distribution of upregulated genes in lsm-8-/- along chromosomes. LEM-2 ChIP enrichment plotted over chromosomes (embryonic WT data from [76] is in grey, indicating proximity to the nuclear periphery. Up- regulated genes in lsm-8-/- (FDR <0.05 and Fc >4) represented by the red dots are plotted over autosomes and X chromosome. Data shown represent two RNA-seq experiments. d, Comparison between our RNA-seq and other available RNA-seq datasets [49, 74, 75] in L3 stage C. elegans, for the percentage of H3K27me3-enriched genes among misregulated genes, Average of two replicas, N=1. We classify a gene as enriched for H3K27me3, if it has positive reproducible enrichment of H3K27me3 over input from two ChIP-seq datasets from ModEncode (Table S3). Genes upregulated in xrn-2 RNAi treated worms [49] but not upregulated in lsm-8 mutant worms are not significantly enriched for H3K27me3 (Table S2). Statistical source data are provided in Source Data Extended Data Fig. 5.
Extended Data Fig. 6. LSM-8 ablation does not alter transcription termination accuracy, strand specificity nor splicing.
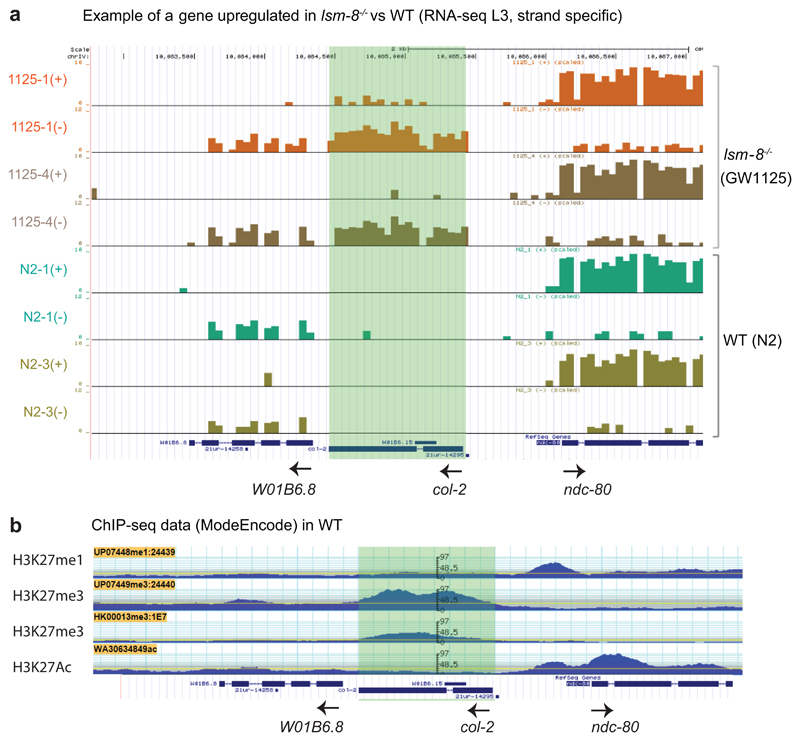
a, UCSC genome browser view showing wiggle tracks from positive (+) or negative (-) strands show the differential expression of the col-2 gene, which is upregulated in lsm-8 -/- compared to WT (y axis in log2). Data shown are derived from the two independent biological RNA-seq replicas. The expression level of the neighboring genes is not affected and termination defects are not observed. All introns were as efficiently spliced in lsm-8-/- as in WT. b, G browse view showing the ModEncode ChIP-seq tracks for H3K27me1, H3K27me3 (two different antibodies) and H3K27Ac at the same genomic locus (IV:10,082,495..10, 087, 496) around the col-2 gene, as shown in (a). The col-2 gene is upregulated in lsm-8 -/- compared to WT and enriched for H3K27me3, as 95% of the genes upregulated in lsm-8 -/-. Statistical source data are provided in Source Data
Extended Data Fig. 7. lsm-8 deletion does not affect splicing globally.
a, RNA IP-qPCR. LSM-4-FLAG RNA IP analysis in native conditions. RNA levels were normalized to input and U1snRNA levels. ZK970.7 is upregulated in lsm-8-/- (lsm-8 target gene) and associate with LSM4 (>1), whereas F08G2.8 is not (non-target gene) and do not associate with LSM4. Those two examples suggest that the LSM-8 complex can bind to the RNAs it regulates. Bars represent mean value derived from two independent experiments, with the value of each experiment shown as a dot. b, Reads which align on exon-exon junctions were counted in lsm-8-/- and WT worms. Scatter plot compares exon-exon junction mapped reads (log2) normalized to their intrinsic gene level in WT (x-axis) and lsm-8-/- worms (y-axis). r: Pearson correlation coefficient. c, List of genes including the 18 exon-exon junctions reproducibly affected in lsm-8-/- worms as in (b). Statistical source data are provided in Source Data Extended Data Fig. 7.
Extended Data Fig. 8. LSM2-8 promotes the degradation of specific transcripts.
a, Scheme of the RNA decay assay. WT and lsm-8 -/- worms were sorted, re-fed with OP50 in liquid culture for 1h at room temperature and treated with 50 μg/ml final concentration of α-amanitin, which inhibits Pol II and Pol III transcription. RNA was isolated at time 0, 4.5h and at 6h, as indicated for each independent experiment. b, RNA levels of three transcripts affected by LSM-8 (upper graph) and two control transcripts (expression not affected by LSM-8, lower graph) were determined by RT- qPCR and normalized to 18S rRNA levels which are insensitive to α-amanitin. The value at 0h is defined as 100%. Bars represent mean value derived from four independent experiments for eft-3, from three independent experiments for far-3, ZK970.7 and F08G2.8 and two independent experiments for grl-23, with the value of each experiment shown as the dot. Statistical source data are provided in Source Data Extended Data fig. 8
Supplementary Material
Acknowledgements
The accession number for the RNA-seq data is NCBI Gene Expression Omnibus is GSE92851. Some strains were provided by the Caenorhabditis Genetics Center (CGC), which is funded by NIH Office of Research Infrastructure Programs (P40 OD010440). We thank I. Katiç, the FMI Genomics and Microscopy facilities, P. Zeller and M. Fukushima for technical help, advice and discussion, and T.S. Miki for access to data and discussions. We thank M. Bühler, H. Großhans and W. Filipowicz for discussions and proofreading of the text. The authors acknowledge support of the Novartis Research Foundation, as well as a Marie Curie Intra-European grant (#PIEF-GA-2010-276589) and Swiss National Science Foundation Marie-Heim Vögtlin grant (#PMPDP3_151381, # PMPDP3_168717) to AM; SNF grant (#310030B_156936) to SMG and support of the NCCR RNA & Disease to H. Großhans (to FA.). This project received funding from the European Research Council under the European Union’s Horizon 2020 Research and Innovation programme (Epiherigans - grant agreement No 743312 to S.M.G.).
Footnotes
Data availability
RNA–seq data that support the findings of this study have been deposited in the Gene Expression Omnibus (GEO) under accession codes GSE92851. Previously published ChIP-seq data that were re-analysed here are available from ModEncode (http://data.modencode.org/), for L3_H3K9me1/2/3 (5036, 5050, 5037, 5040), L3_H3K27me3 (5045, 5051), L3_H3K27ac (5054), L3_H3K4me2/3 (5055, 3576). All other data supporting the findings of this study are available from the corresponding author on reasonable request.
Author Contributions
A.M. planned and executed most experiments, evaluated results and wrote the paper; S.M.G. planned experiments, evaluated results and wrote the paper; D.G. analyzed with A.M. the RNA-seq data and other genome wide data, C.S analyzed the L1 RNA-seq data, J.P. performed the H3K27me3 ChIP-qPCR experiment and analysis; V.K. performed the gonad staining and analysis and F.A. helped generate the lsm-8 mutant strain.
Competing financial interests: The authors declare no competing financial interests.
Contributor Information
Anna Mattout, Friedrich Miescher Institute for Biomedical Research, Maulbeerstrasse 66, CH-4058 Basel, Switzerland; Université Paul Sabatier- CNRS UMR 5088, Toulouse France.
Florian Aeschlimann, Friedrich Miescher Institute for Biomedical Research, Maulbeerstrasse 66, CH-4058 Basel, Switzerland; Faculty of Natural Sciences, University of Basel, Basel, Switzerland.
Véronique Kalck, Friedrich Miescher Institute for Biomedical Research, Maulbeerstrasse 66, CH-4058 Basel, Switzerland.
Susan M. Gasser, Friedrich Miescher Institute for Biomedical Research, Maulbeerstrasse 66, CH-4058 Basel, Switzerland; Faculty of Natural Sciences, University of Basel, Basel, Switzerland.
References
- 1.Saksouk N, Simboeck E, Dejardin J. Constitutive heterochromatin formation and transcription in mammals. Epigenetics & chromatin. 2015;8:3. doi: 10.1186/1756-8935-8-3. [DOI] [PMC free article] [PubMed] [Google Scholar]
- 2.Trojer P, Reinberg D. Facultative heterochromatin: is there a distinctive molecular signature? Molecular cell. 2007;28:1–13. doi: 10.1016/j.molcel.2007.09.011. [DOI] [PubMed] [Google Scholar]
- 3.Wenzel D, Palladino F, Jedrusik-Bode M. Epigenetics in C. elegans: facts and challenges. Genesis (New York, NY : 2000) 2011;49:647–661. doi: 10.1002/dvg.20762. [DOI] [PubMed] [Google Scholar]
- 4.Zeller P, et al. Histone H3K9 methylation is dispensable for Caenorhabditis elegans development but suppresses RNA:DNA hybrid-associated repeat instability. Nature genetics. 2016;48:1385–1395. doi: 10.1038/ng.3672. [DOI] [PubMed] [Google Scholar]
- 5.Gaydos LJ, Wang W, Strome S. Gene repression. H3K27me and PRC2 transmit a memory of repression across generations and during development. Science (New York, NY) 2014;345:1515–1518. doi: 10.1126/science.1255023. [DOI] [PMC free article] [PubMed] [Google Scholar]
- 6.Wang J, Jia ST, Jia S. New Insights into the Regulation of Heterochromatin. Trends in genetics: TIG. 2016;32:284–294. doi: 10.1016/j.tig.2016.02.005. [DOI] [PMC free article] [PubMed] [Google Scholar]
- 7.Buhler M. RNA turnover and chromatin-dependent gene silencing. Chromosoma. 2009;118:141–151. doi: 10.1007/s00412-008-0195-z. [DOI] [PubMed] [Google Scholar]
- 8.Grewal SI, Elgin SC. Transcription and RNA interference in the formation of heterochromatin. Nature. 2007;447:399–406. doi: 10.1038/nature05914. [DOI] [PMC free article] [PubMed] [Google Scholar]
- 9.Moazed D. Small RNAs in transcriptional gene silencing and genome defence. Nature. 2009;457:413–420. doi: 10.1038/nature07756. [DOI] [PMC free article] [PubMed] [Google Scholar]
- 10.Noma K, et al. RITS acts in cis to promote RNA interference-mediated transcriptional and post-transcriptional silencing. Nature genetics. 2004;36:1174–1180. doi: 10.1038/ng1452. [DOI] [PubMed] [Google Scholar]
- 11.Buhler M, Haas W, Gygi SP, Moazed D. RNAi-dependent and -independent RNA turnover mechanisms contribute to heterochromatic gene silencing. Cell. 2007;129:707–721. doi: 10.1016/j.cell.2007.03.038. [DOI] [PubMed] [Google Scholar]
- 12.Eberle AB, et al. An Interaction between RRP6 and SU(VAR)3-9 Targets RRP6 to Heterochromatin and Contributes to Heterochromatin Maintenance in Drosophila melanogaster. PLoS genetics. 2015;11 doi: 10.1371/journal.pgen.1005523. [DOI] [PMC free article] [PubMed] [Google Scholar]
- 13.Shin JH, et al. The role of the Arabidopsis Exosome in siRNA-independent silencing of heterochromatic loci. PLoS genetics. 2013;9:e1003411. doi: 10.1371/journal.pgen.1003411. [DOI] [PMC free article] [PubMed] [Google Scholar]
- 14.Vasiljeva L, Kim M, Terzi N, Soares LM, Buratowski S. Transcription termination and RNA degradation contribute to silencing of RNA polymerase II transcription within heterochromatin. Molecular cell. 2008;29:313–323. doi: 10.1016/j.molcel.2008.01.011. [DOI] [PubMed] [Google Scholar]
- 15.Keller C, et al. HP1(Swi6) mediates the recognition and destruction of heterochromatic RNA transcripts. Molecular cell. 2012;47:215–227. doi: 10.1016/j.molcel.2012.05.009. [DOI] [PubMed] [Google Scholar]
- 16.Egan ED, Braun CR, Gygi SP, Moazed D. Post-transcriptional regulation of meiotic genes by a nuclear RNA silencing complex. RNA (New York, NY) 2014;20:867–881. doi: 10.1261/rna.044479.114. [DOI] [PMC free article] [PubMed] [Google Scholar]
- 17.Zofall M, et al. RNA elimination machinery targeting meiotic mRNAs promotes facultative heterochromatin formation. Science (New York, NY) 2012;335:96–100. doi: 10.1126/science.1211651. [DOI] [PMC free article] [PubMed] [Google Scholar]
- 18.Yamanaka S, et al. RNAi triggered by specialized machinery silences developmental genes and retrotransposons. Nature. 2013;493:557–560. doi: 10.1038/nature11716. [DOI] [PMC free article] [PubMed] [Google Scholar]
- 19.Touat-Todeschini, et al. Selective termination of lncRNA transcription promotes heterochromatin silencing and cell differentiation. 2017;36:2626–2641. doi: 10.15252/embj.201796571. [DOI] [PMC free article] [PubMed] [Google Scholar]
- 20.St-Andre O, et al. Negative regulation of meiotic gene expression by the nuclear poly(a)-binding protein in fission yeast. The Journal of biological chemistry. 2010;285:27859–27868. doi: 10.1074/jbc.M110.150748. [DOI] [PMC free article] [PubMed] [Google Scholar]
- 21.Tucker JF, et al. A Novel Epigenetic Silencing Pathway Involving the Highly Conserved 5'-3' Exoribonuclease Dhp1/Rat1/Xrn2 in Schizosaccharomyces pombe. PLoS genetics. 2016;12:e1005873. doi: 10.1371/journal.pgen.1005873. [DOI] [PMC free article] [PubMed] [Google Scholar]
- 22.Chalamcharla VR, Folco HD, Dhakshnamoorthy J, Grewal SI. Conserved factor Dhp1/Rat1/Xrn2 triggers premature transcription termination and nucleates heterochromatin to promote gene silencing. Proceedings of the National Academy of Sciences of the United States of America. 2015;112:15548–15555. doi: 10.1073/pnas.1522127112. [DOI] [PMC free article] [PubMed] [Google Scholar]
- 23.Davidovich C, Zheng L, Goodrich KJ, Cech TR. Promiscuous RNA binding by Polycomb repressive complex 2. Nature structural & molecular biology. 2013;20:1250–1257. doi: 10.1038/nsmb.2679. [DOI] [PMC free article] [PubMed] [Google Scholar]
- 24.Wang X, et al. Targeting of Polycomb Repressive Complex 2 to RNA by Short Repeats of Consecutive Guanines. Molecular cell. 2017;65:1056–1067.e1055. doi: 10.1016/j.molcel.2017.02.003. [DOI] [PubMed] [Google Scholar]
- 25.Towbin BD, et al. Step-wise methylation of histone H3K9 positions heterochromatin at the nuclear periphery. Cell. 2012;150:934–947. doi: 10.1016/j.cell.2012.06.051. [DOI] [PubMed] [Google Scholar]
- 26.Tharun S. Roles of eukaryotic Lsm proteins in the regulation of mRNA function. International review of cell and molecular biology. 2009;272:149–189. doi: 10.1016/S1937-6448(08)01604-3. [DOI] [PubMed] [Google Scholar]
- 27.Beggs JD. Lsm proteins and RNA processing. Biochemical Society transactions. 2005;33:433–438. doi: 10.1042/BST0330433. [DOI] [PubMed] [Google Scholar]
- 28.Kufel J, Bousquet-Antonelli C, Beggs JD, Tollervey D. Nuclear pre-mRNA decapping and 5' degradation in yeast require the Lsm2-8p complex. Molecular and cellular biology. 2004;24:9646–9657. doi: 10.1128/MCB.24.21.9646-9657.2004. [DOI] [PMC free article] [PubMed] [Google Scholar]
- 29.Golisz A, Sikorski PJ, Kruszka K, Kufel J. Arabidopsis thaliana LSM proteins function in mRNA splicing and degradation. Nucleic acids research. 2013;41:6232–6249. doi: 10.1093/nar/gkt296. [DOI] [PMC free article] [PubMed] [Google Scholar]
- 30.Perea-Resa C, Hernandez-Verdeja T, Lopez-Cobollo R, del Mar Castellano M, Salinas J. LSM proteins provide accurate splicing and decay of selected transcripts to ensure normal Arabidopsis development. The Plant cell. 2012;24:4930–4947. doi: 10.1105/tpc.112.103697. [DOI] [PMC free article] [PubMed] [Google Scholar]
- 31.Cornes E, et al. Cytoplasmic LSM-1 protein regulates stress responses through the insulin/IGF-1 signaling pathway in Caenorhabditis elegans. RNA (New York, NY) 2015;21:1544–1553. doi: 10.1261/rna.052324.115. [DOI] [PMC free article] [PubMed] [Google Scholar]
- 32.Meister P, Towbin BD, Pike BL, Ponti A, Gasser SM. The spatial dynamics of tissue-specific promoters during C. elegans development. Genes & development. 2010;24:766–782. doi: 10.1101/gad.559610. [DOI] [PMC free article] [PubMed] [Google Scholar]
- 33.Towbin BD, Meister P, Pike BL, Gasser SM. Repetitive transgenes in C. elegans accumulate heterochromatic marks and are sequestered at the nuclear envelope in a copy-number- and lamin-dependent manner. Cold Spring Harbor symposia on quantitative biology. 2010;75:555–565. doi: 10.1101/sqb.2010.75.041. [DOI] [PubMed] [Google Scholar]
- 34.Shirayama M, et al. piRNAs initiate an epigenetic memory of nonself RNA in the C. elegans germline. Cell. 2012;150:65–77. doi: 10.1016/j.cell.2012.06.015. [DOI] [PMC free article] [PubMed] [Google Scholar]
- 35.Hendriks GJ, Gaidatzis D, Aeschimann F, Grosshans H. Extensive oscillatory gene expression during C. elegans larval development. Molecular cell. 2014;53:380–392. doi: 10.1016/j.molcel.2013.12.013. [DOI] [PubMed] [Google Scholar]
- 36.Ho JW, et al. Comparative analysis of metazoan chromatin organization. Nature. 2014;512:449–452. doi: 10.1038/nature13415. [DOI] [PMC free article] [PubMed] [Google Scholar]
- 37.Liu T, et al. Broad chromosomal domains of histone modification patterns in C. elegans. Genome research. 2011;21:227–236. doi: 10.1101/gr.115519.110. [DOI] [PMC free article] [PubMed] [Google Scholar]
- 38.Ahringer J, Gasser SM. Repressive Chromatin in Caenorhabditis elegans: Establishment, Composition, and Function. 2018;208:491–511. doi: 10.1534/genetics.117.300386. [DOI] [PMC free article] [PubMed] [Google Scholar]
- 39.Margueron R, Reinberg D. The Polycomb complex PRC2 and its mark in life. Nature. 2011;469:343–349. doi: 10.1038/nature09784. [DOI] [PMC free article] [PubMed] [Google Scholar]
- 40.Conway E, Healy E, Bracken AP. PRC2 mediated H3K27 methylations in cellular identity and cancer. Current opinion in cell biology. 2015;37:42–48. doi: 10.1016/j.ceb.2015.10.003. [DOI] [PubMed] [Google Scholar]
- 41.Grossniklaus U, Paro R. Transcriptional silencing by polycomb-group proteins. Cold Spring Harbor perspectives in biology. 2014;6 doi: 10.1101/cshperspect.a019331. a019331. [DOI] [PMC free article] [PubMed] [Google Scholar]
- 42.Patel T, Tursun B, Rahe DP, Hobert O. Removal of Polycomb repressive complex 2 makes C. elegans germ cells susceptible to direct conversion into specific somatic cell types. Cell reports. 2012;2:1178–1186. doi: 10.1016/j.celrep.2012.09.020. [DOI] [PMC free article] [PubMed] [Google Scholar]
- 43.Ketel CS, et al. Subunit contributions to histone methyltransferase activities of fly and worm polycomb group complexes. Molecular and cellular biology. 2005;25:6857–6868. doi: 10.1128/MCB.25.16.6857-6868.2005. [DOI] [PMC free article] [PubMed] [Google Scholar]
- 44.Yuzyuk T, Fakhouri TH, Kiefer J, Mango SE. The polycomb complex protein mes-2/E(z) promotes the transition from developmental plasticity to differentiation in C. elegans embryos. Developmental cell. 2009;16:699–710. doi: 10.1016/j.devcel.2009.03.008. [DOI] [PMC free article] [PubMed] [Google Scholar]
- 45.Ross JM, Zarkower D. Polycomb group regulation of Hox gene expression in C. elegans. Developmental cell. 2003;4:891–901. doi: 10.1016/s1534-5807(03)00135-7. [DOI] [PubMed] [Google Scholar]
- 46.Hench J, et al. The Homeobox Genes of Caenorhabditis elegans and Insights into Their Spatio-Temporal Expression Dynamics during Embryogenesis. PloS one. 2015;10:e0126947. doi: 10.1371/journal.pone.0126947. [DOI] [PMC free article] [PubMed] [Google Scholar]
- 47.Ferreira HB, Zhang Y, Zhao C, Emmons SW. Patterning of Caenorhabditis elegans posterior structures by the Abdominal-B homolog, egl-5. Developmental biology. 1999;207:215–228. doi: 10.1006/dbio.1998.9124. [DOI] [PubMed] [Google Scholar]
- 48.Zhou L, et al. Crystal structures of the Lsm complex bound to the 3' end sequence of U6 small nuclear RNA. Nature. 2014;506:116–120. doi: 10.1038/nature12803. [DOI] [PubMed] [Google Scholar]
- 49.Miki TS, Carl SH, Stadler MB, Grosshans H. XRN2 Autoregulation and Control of Polycistronic Gene Expresssion in Caenorhabditis elegans. PLoS genetics. 2016;12:e1006313. doi: 10.1371/journal.pgen.1006313. [DOI] [PMC free article] [PubMed] [Google Scholar]
- 50.Miki TS, Grosshans H. The multifunctional RNase XRN2. Biochemical Society transactions. 2013;41:825–830. doi: 10.1042/BST20130001. [DOI] [PubMed] [Google Scholar]
- 51.Miki TS, Ruegger S, Gaidatzis D, Stadler MB, Grosshans H. Engineering of a conditional allele reveals multiple roles of XRN2 in Caenorhabditis elegans development and substrate specificity in microRNA turnover. Nucleic acids research. 2014;42:4056–4067. doi: 10.1093/nar/gkt1418. [DOI] [PMC free article] [PubMed] [Google Scholar]
- 52.Lotan R, Goler-Baron V, Duek L, Haimovich G, Choder M. The Rpb7p subunit of yeast RNA polymerase II plays roles in the two major cytoplasmic mRNA decay mechanisms. The Journal of cell biology. 2007;178:1133–1143. doi: 10.1083/jcb.200701165. [DOI] [PMC free article] [PubMed] [Google Scholar]
- 53.Haimovich G, Choder M, Singer RH, Trcek T. The fate of the messenger is pre-determined: a new model for regulation of gene expression. Biochimica et biophysica acta. 2013;1829:643–653. doi: 10.1016/j.bbagrm.2013.01.004. [DOI] [PMC free article] [PubMed] [Google Scholar]
- 54.Coy S, Vasiljeva L. The exosome and heterochromatin : multilevel regulation of gene silencing. Advances in experimental medicine and biology. 2011;702:105–121. doi: 10.1007/978-1-4419-7841-7_9. [DOI] [PubMed] [Google Scholar]
- 55.Hurschler BA, Harris DT, Grosshans H. The type II poly(A)-binding protein PABP-2 genetically interacts with the let-7 miRNA and elicits heterochronic phenotypes in Caenorhabditis elegans. Nucleic acids research. 2011;39:5647–5657. doi: 10.1093/nar/gkr145. [DOI] [PMC free article] [PubMed] [Google Scholar]
- 56.Kuhn U, et al. Poly(A) tail length is controlled by the nuclear poly(A)-binding protein regulating the interaction between poly(A) polymerase and the cleavage and polyadenylation specificity factor. The Journal of biological chemistry. 2009;284:22803–22814. doi: 10.1074/jbc.M109.018226. [DOI] [PMC free article] [PubMed] [Google Scholar]
- 57.Lemieux C, Bachand F. Cotranscriptional recruitment of the nuclear poly(A)-binding protein Pab2 to nascent transcripts and association with translating mRNPs. Nucleic acids research. 2009;37:3418–3430. doi: 10.1093/nar/gkp207. [DOI] [PMC free article] [PubMed] [Google Scholar]
- 58.Beaulieu YB, Kleinman CL, Landry-Voyer AM, Majewski J, Bachand F. Polyadenylation-dependent control of long noncoding RNA expression by the poly(A)-binding protein nuclear 1. PLoS genetics. 2012;8:e1003078. doi: 10.1371/journal.pgen.1003078. [DOI] [PMC free article] [PubMed] [Google Scholar]
- 59.Soshnikova N, Duboule D. Epigenetic temporal control of mouse Hox genes in vivo. Science (New York, NY) 2009;324:1320–1323. doi: 10.1126/science.1171468. [DOI] [PubMed] [Google Scholar]
- 60.Bender LB, Cao R, Zhang Y, Strome S. The MES-2/MES-3/MES-6 complex and regulation of histone H3 methylation in C. elegans. Current biology : CB. 2004;14:1639–1643. doi: 10.1016/j.cub.2004.08.062. [DOI] [PubMed] [Google Scholar]
- 61.Zhang H, et al. The C. elegans Polycomb gene SOP-2 encodes an RNA binding protein. Molecular cell. 2004;14:841–847. doi: 10.1016/j.molcel.2004.06.001. [DOI] [PubMed] [Google Scholar]
- 62.Zhang T, et al. RNA-binding proteins SOP-2 and SOR-1 form a novel PcG-like complex in C. elegans. Development (Cambridge, England) 2006;133:1023–1033. doi: 10.1242/dev.02275. [DOI] [PubMed] [Google Scholar]
- 63.Djupedal I, et al. RNA Pol II subunit Rpb7 promotes centromeric transcription and RNAi-directed chromatin silencing. Genes & development. 2005;19:2301–2306. doi: 10.1101/gad.344205. [DOI] [PMC free article] [PubMed] [Google Scholar]
- 64.Ringrose L. Noncoding RNAs in Polycomb and Trithorax Regulation: A Quantitative Perspective. Annu Rev Genet. 2017;51:385–411. doi: 10.1146/annurev-genet-120116-023402. [DOI] [PubMed] [Google Scholar]
- 65.Brockdorff N. Noncoding RNA and Polycomb recruitment. RNA (New York, NY) 2013;19:429–442. doi: 10.1261/rna.037598.112. [DOI] [PMC free article] [PubMed] [Google Scholar]
- 66.Johnson WL, Straight AF. RNA-mediated regulation of heterochromatin. Current opinion in cell biology. 2017;46:102–109. doi: 10.1016/j.ceb.2017.05.004. [DOI] [PMC free article] [PubMed] [Google Scholar]
- 67.Wang X, Paucek RD. Molecular analysis of PRC2 recruitment to DNA in chromatin and its inhibition by RNA. 2017;24:1028–1038. doi: 10.1038/nsmb.3487. [DOI] [PMC free article] [PubMed] [Google Scholar]
- 68.Katic I, Xu L, Ciosk R. CRISPR/Cas9 Genome Editing in Caenorhabditis elegans: Evaluation of Templates for Homology-Mediated Repair and Knock-Ins by Homology-Independent DNA Repair. G3 (Bethesda, Md) 2015;5:1649–1656. doi: 10.1534/g3.115.019273. [DOI] [PMC free article] [PubMed] [Google Scholar]
- 69.Dickinson DJ, Ward JD, Reiner DJ, Goldstein B. Engineering the Caenorhabditis elegans genome using Cas9-triggered homologous recombination. Nature methods. 2013;10:1028–1034. doi: 10.1038/nmeth.2641. [DOI] [PMC free article] [PubMed] [Google Scholar]
- 70.Timmons L, Court DL, Fire A. Ingestion of bacterially expressed dsRNAs can produce specific and potent genetic interference in Caenorhabditis elegans. Gene. 2001;263:103–112. doi: 10.1016/s0378-1119(00)00579-5. [DOI] [PubMed] [Google Scholar]
- 71.Langmead B, Trapnell C, Pop M, Salzberg SL. Ultrafast and memory-efficient alignment of short DNA sequences to the human genome. Genome biology. 2009;10:R25. doi: 10.1186/gb-2009-10-3-r25. [DOI] [PMC free article] [PubMed] [Google Scholar]
- 72.Au KF, Jiang H, Lin L, Xing Y, Wong WH. Detection of splice junctions from paired-end RNA-seq data by SpliceMap. Nucleic acids research. 2010;38:4570–4578. doi: 10.1093/nar/gkq211. [DOI] [PMC free article] [PubMed] [Google Scholar]
- 73.Habacher C, et al. Ribonuclease-Mediated Control of Body Fat. Developmental cell. 2016;39:359–369. doi: 10.1016/j.devcel.2016.09.018. [DOI] [PubMed] [Google Scholar]
- 74.Latorre I, et al. The DREAM complex promotes gene body H2A.Z for target repression. Genes & development. 2015;29:495–500. doi: 10.1101/gad.255810.114. [DOI] [PMC free article] [PubMed] [Google Scholar]
- 75.Wang JJ, et al. The influences of PRG-1 on the expression of small RNAs and mRNAs. BMC genomics. 2014;15:321. doi: 10.1186/1471-2164-15-321. [DOI] [PMC free article] [PubMed] [Google Scholar]
Associated Data
This section collects any data citations, data availability statements, or supplementary materials included in this article.


