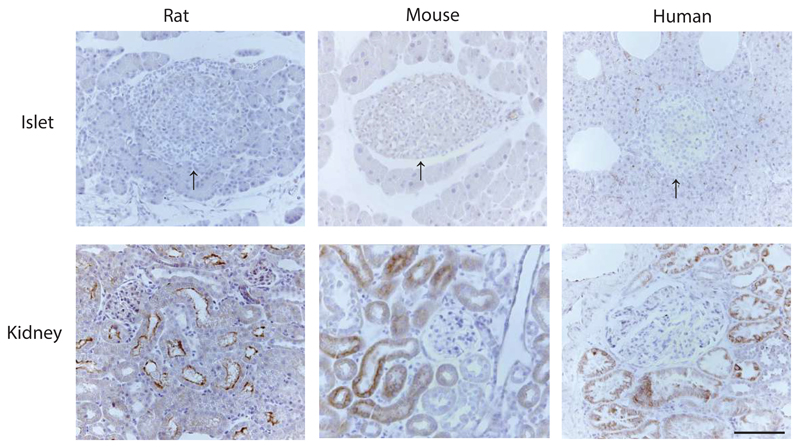
Figure 6. Sodium-glucose transporter 2 (SGLT2) stainings in rat, mouse and human pancreas.
Representative images for immunohistochemical stainings against SGLT2 in rat, mouse and human pancreas and kidney (positive control). Top panel shows representative pancraetic slets (indicated with black arrows), bottom panel shows kidney tissue staining. Repressentative images are shown from (n = 3 in all cases). Left side: rat, middle: mouse and right side: human tissue. All pictures are in the same scale. Scale bar is shown in the lower right picture is 100 µm.

