Abstract
Background
Computed tomography (CT) screening for lung cancer has led to frequent findings of small anterior mediastinal masses. It is very hard to distinguish small thymomas from thymic cysts. The objective of this study was to develop a clinical model for predicting small thymomas (<3 cm) in asymptomatic patients.
Methods
Patients who underwent thymectomy for anterior mediastinal masses between 2004 and 2016 were included. All preoperative CT scans (pre- and post-enhanced) were retrospectively reviewed. Size, location, contour, shape, presence of calcification, and enhancement [Hounsfield units (HU)] were evaluated. A nomogram was built based on the predictive factors. For external validation, patients undergoing thymectomy in 2017 were enrolled and thymoma prediction was computed using the proposed nomogram.
Results
The study population consisted of 43 patients with thymoma and 57 with thymic cyst. The multivariable analysis identified a lobulated contour and a large difference in HU between post- and pre-enhancement as predictive factors of thymoma. These factors were included in the nomogram, which showed 95% (19/20) power for predicting thymoma after external validation.
Conclusions
This clinical model can be used to predict thymoma in patients with small, asymptomatic thymic abnormalities on CT screening.
Keywords: Thymic cyst, thymoma, nomogram
Introduction
The increasing use of low-dose chest computed tomography (CT) has led to the more frequent identification of incidental lesions in the anterior mediastinum, and with recent advances in minimally invasive surgical techniques, an increasing number of thymic lesions are referred for surgical evaluation (1). However, it is very hard to distinguish small thymomas from thymic cysts on low-dose CT. Differentiating thymoma from thymic cyst is not necessary if a thymic lesion shows malignant features, such as invasion of vascular structures, the presence of suspicious metastatic lesions in the lung or pleura, or a size larger than 3 cm. In all such cases, except those that are unresectable, surgery is indicated regardless of the nature of the lesion. However, if the benignity of a thymic lesion could be determined on imaging with a reasonable level of confidence, then the need for surgical resection may potentially be obviated (2). Magnetic resonance imaging (MRI) is considered to be more suitable for the diagnosis of cystic lesions in the thymus (3), but its ability is not superior to that of chest CT for small thymic abnormalities. For this reason, enhanced chest CT is usually performed to differentiate thymic cyst from thymoma instead of chest MRI, which is more expensive than CT.
Therefore, the purpose of this study was to identify imaging features of chest CT that help in distinguishing thymic cyst from thymoma in small abnormalities (less than 3 cm).
Methods
Patients
Patients who underwent complete thymic resection at Seoul National University Bundang Hospital (SNUBH) between January 2004 and September 2016 were included. During the study period, 221 patients with thymoma and 267 with thymic cyst were enrolled. Of the 221 thymomas, we excluded 43 cases of thymic carcinoma because in all of those cases, the lesions were larger than 3 cm in the longest dimension, as well as 112 other lesions in which the longest diameter was larger than 3 cm, and 23 cases where no contrast CT was available, and of the 267 thymic cysts, we excluded 150 larger than 3 cm and 60 for which no contrast CT was available (Figure 1). Clinical information was collected retrospectively from patients’ medical records. This study was approved by the institutional review board of SNUBH (B-1904-532-107), and the requirement to obtain informed consent from the subjects was waived due to the retrospective nature of the study design.
Figure 1.
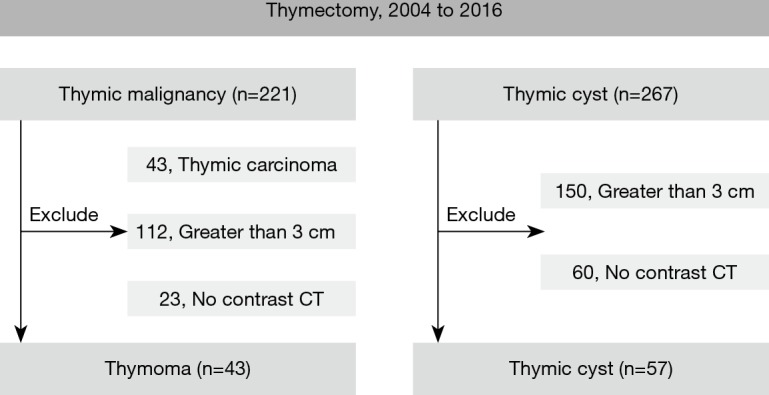
Inclusion criteria for the study population.
Imaging analysis
All preoperative CT scans were retrospectively reviewed by 1 thoracic surgeon and 1 radiologist who were blinded to the pathologic diagnoses. The imaging analysis was described using standard reporting terms for chest CT (4). The mean interval between CT acquisition and surgery was 41.2 days. The detailed parameters for CT acquisition were as follows: tube voltage, 120 kVp; tube current, 120–250 mAs with automatic exposure control; 1–2 mm slice thickness; reconstruction at a 3-mm slice thickness/2.5-mm interval increment; injection of the same amount of contrast medium in all patients (80 mL; 1 mL of contrast medium contains 350 mg of iodine); and injection speed, 2.0 mL/s, followed by a 20-mL saline chaser at the same rate. We performed the scan at the point where values of 150–250 Hounsfield units (HU) were reached in the ascending aorta. We drew a region of interest (ROI) of the same size as the tumor, measured the average HU values in the ROI at 3 different levels of the tumor, calculated the average of those three values, and used that average as the CT number. The location of a tumor was determined according to its position relative to a line drawn between the mid-sternum and the trachea, right, left, and midline. Size was defined as the longest lesion dimension on axial imaging (X), and on the same slice, the perpendicular short-axis measurement (Y) and the size of the coronal image (Z) were obtained. The shape was considered round if the ratio between the long–axis and short-axis dimensions was less than 1.5. A lobulated contour was defined as the presence of 1 or more lobulations, which are characterized as convex tumor contours with adjacent notches between tumor lobules; otherwise, the contour was considered smooth. The average value of HU in the region of interest (ROI) was measured to determine whether the ROI showed high attenuation or enhancement, using 50 HU as the threshold for high attenuation, and an increase in the mean HU value after contrast injection was considered to indicate the presence of enhancement. Enhancement before and after the contrast injection was evaluated and scored in HU, and the degree of enhancement (∆HU) was defined by calculating the difference between post-contrast HU and pre-contrast HU (post-contrast HU minus pre-contrast HU).
Statistical analysis
Analytical statistics
To determine the significance of differences in various characteristics between the thymoma and thymic cyst groups, P values were calculated using the Mann-Whitney test for continuous variables and the Fisher exact test for categorical variables. All analyses were conducted using SAS version 9.2 (SAS Institute, Cary, NC, USA).
Development of predictive model
Multivariable logistic regression analysis was conducted to generate a predictive model for thymoma using a set of independent predictive factors that showed statistical significance. Stepwise selection was used to determine a set of variables that jointly predicted thymoma. To provide a quantitative tool to predict an individual’s probability of thymoma, we built a nomogram on the basis of multivariable logistic analysis of the study population. For internal model validation, bias-corrected estimates of model performance were assessed by the bootstrapping method. To evaluate the predictive efficiency, receiver operating characteristic (ROC) curve analysis was conducted.
External validation population
In order to validate our predictive model for thymoma, 20 patients who underwent thymic resection in 2017 and satisfied the same inclusion criteria were selected as an external validation group. For external validation, nomogram-based thymoma prediction was computed using the proposed score formula. The predictive accuracy of the nomogram was assessed using the Harrell concordance index (C-index).
Results
Patients
A total of 100 patients, consisting of 43 with thymoma and 57 with thymic cyst, were enrolled in the study. The mean age of the study population was 53.4 years (range, 17–76 years), and 60 patients were male. According to the World Health Organization classification, tumors were classified as A in 2 (5%) patients, AB in 19 (44%), B1 in 10 (23%), B2 in 9 (21%), and B3 in 3 (7%). According to the Masaoka-Koga staging system, stage I was found in 22 (51%) patients, stage IIa in 18 (42%) patients, and stage IIb in 3 (7%).
Preoperatively, 17 patients (39.5%) with thymoma and 7 patients (12.3%) with thymic cyst were misdiagnosed as having thymic cyst and thymoma, respectively. Table 1 shows the characteristics of the patients with thymoma and those with thymic cyst. The mean Z-axis of tumor size was 25.7 and 21.0 mm in the thymic cyst and thymoma groups, respectively (P=0.018). Lobulation was more common in the thymoma group than in the thymic cyst group (8.8% vs. 62.8%, P<0.001). The median ∆HU of thymoma was 24.0 HU [interquartile range (IQR), 9.0–38.0 HU] and the median ∆HU of thymic cyst was −3.0 (IQR: −18.0 to −5.0 HU), which was statistically significant (P<0.001). The thymoma group had higher post-contrast HU values (P<0.001), and greater enhancement (∆HU, P<0.001) than the thymic cyst group (Figure 2).
Table 1. Characteristics of study population, 2004 to 2016.
| Characteristics | Thymic cyst (n=57) | Thymoma (n=43) | P |
|---|---|---|---|
| Demographic data | |||
| Age, years, mean (SD) | 54.7 (11.1) | 51.0 (12.6) | 0.115 |
| Sex, male, n (%) | 36 (63.2) | 24 (55.8) | 0.819 |
| Location, n (%) | 0.380 | ||
| Right | 18 (31.6) | 18 (41.9) | |
| Left | 27 (47.4) | 19 (44.2) | |
| Midline | 12 (21.0) | 6 (14.0) | |
| Size on CT scana, mm, mean (SD) | |||
| X | 21.7 (9.2) | 21.5 (5.8) | 0.861 |
| Y | 15.2 (5.7) | 15.5 (4.3) | 0.782 |
| Z | 25.7 (14.1) | 21.0 (6.2) | 0.018 |
| Contour, n (%) | <0.001 | ||
| Conformal to the shape of the adjacent mediastinum | 24 (42.1) | 2 (4.7) | |
| Smooth | 28 (49.1) | 14 (32.6) | |
| Lobulated | 5 (8.8) | 27 (62.8) | |
| Shape, n (%) | 0.519 | ||
| Ovoid | 25 (43.9) | 17 (39.5) | |
| Round | 24 (42.1) | 16 (37.2) | |
| Thymic shape | 8 (14.0) | 10 (23.3) | |
| Other CT findings | |||
| Calcification, yes, n (%) | 4 (7.0) | 0 (0.0) | 0.089 |
| Attenuation, high, n (%) | 28 (49.1) | 23 (53.5) | 0.401 |
| HU, median (1st and 3rd quartile) | |||
| Pre-contrast HU | 42.5 (27.5–57.0) | 45.5 (37.0–54.0) | 0.453 |
| Post-contrast HU | 38.0 (22.0–46.2) | 67.0 (47.0–85.0) | <0.001 |
| Enhancement (yes), n (%) | 10 (17.5) | 39 (90.7) | <0.001 |
| ∆HUb | −3.0 (−18.0, −5.0) | 24.0 (9.0–38.0) | <0.001 |
a, X is the longest diameter of the anterior mediastinal mass; Y is a diameter perpendicular to the longest diameter; Z axial diameter is a craniocaudal diameter of the mass. b, ∆HU is post-contrast HU minus pre-contrast HU. HU, Hounsfield unit.
Figure 2.
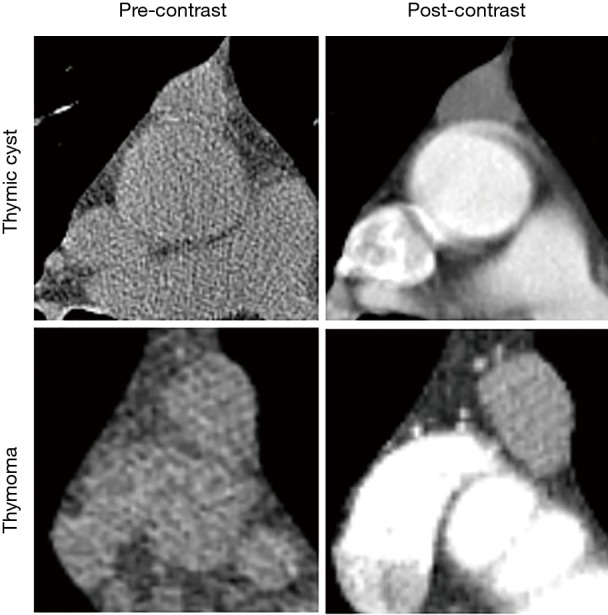
Representative CT images of each entity.
Predictive factors for thymoma
In the multivariable analysis, only 2 independent predictors for thymoma were identified: a lobulated contour [hazard ratio (HR), 10.938; 95% CI, 1.154–103.634; P=0.037] and enhancement (HR, 52.923; 95% CI, 11.800–237.357; P<0.001). The final predictive model for thymoma was made based on these 2 factors, with a different weighting of the hazard ratios for each factor (Table 2).
Table 2. Predictive factors for thymoma by multivariable logistic regression analysis.
| Characteristics | Adjusted ORa | 95% CI | P |
|---|---|---|---|
| Size on CT scan | 0.989 | 0.903–1.085 | 0.822 |
| Contour | |||
| Conformal to adjacent mediastinum | 1 (reference) | ||
| Smooth | 1.690 | 0.183–15.603 | 0.644 |
| Lobulated | 10.938 | 1.154–103.634 | 0.037 |
| Enhancement | |||
| No | 1 (reference) | ||
| Yes | 52.923 | 11.800–237.357 | 0.001 |
a, OR is adjusted by size, shape and enhancement.
Predictive model for thymoma, its nomogram, ROC curve, and internal validation
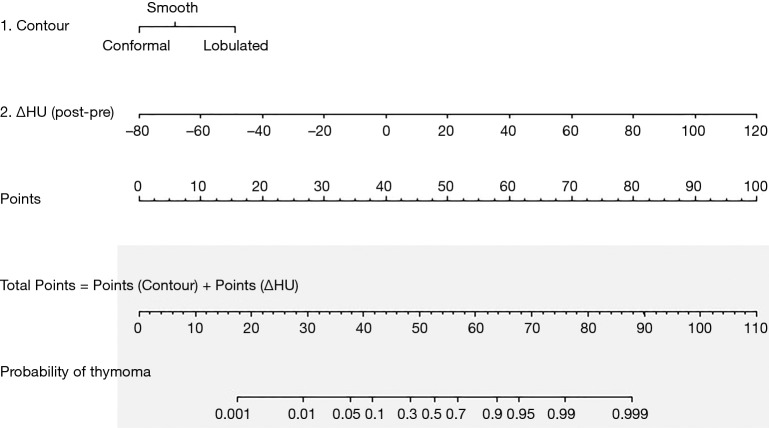
We developed a predictive model for thymoma and a nomogram based on the 2 independent predictive factors (Figure 3). Based on the results of the logistic regression model, the total score was calculated as:
Figure 3.
Nomogram of predictive factors for thymoma based on contour and enhancement.
Total score = contour points* + 0.5 × ∆HU + 40 (*Zero contour points are assigned when the surface contour of a mass conforms to the adjacent mediastinum, 6 when it is smooth, and 16 when it is lobulated).
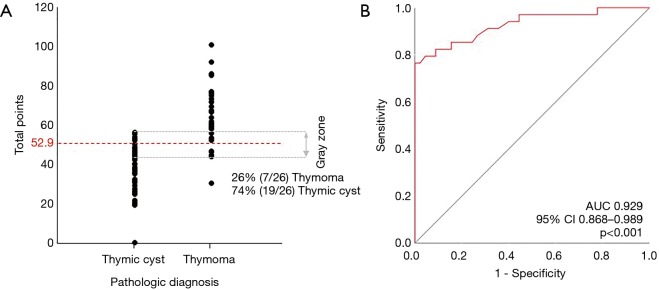
The scores were obtained from all enrolled patients. The median score for thymomas and thymic cysts was 61 (range, 31–101) and 43 (range, 1–57), respectively. All cases with more than 58 points were thymomas, and all with less than 30 were thymic cysts. In the range between 30 and 58 points, 16.7% of lesions were thymomas and 83.3% were thymic cysts (Figure 4A). This model had an area under the ROC curve of 0.929 (95% CI, 0.868–0.989) (Figure 4B). The maximal diagnostic Youden index was 73.5% with a cut-off value of 52.9 points, the sensitivity was 0.824 (95% CI: 0.655–0.932), the specificity was 0.889 (95% CI: 0.705–0.935), the positive likelihood ratio was 5.594, and the negative likelihood ratio was 0.209. In the internal validation process, our model was found to have a mean absolute error of 0.06, with a slightly higher probability than actual (Figure 5).
Figure 4.
ROC and distribution of total points. (A) Distribution of total points according to the pathologic diagnosis; (B) this model had an area under the receiver operating characteristic curve of 0.929 (95% CI: 0.868–0.989).
Figure 5.
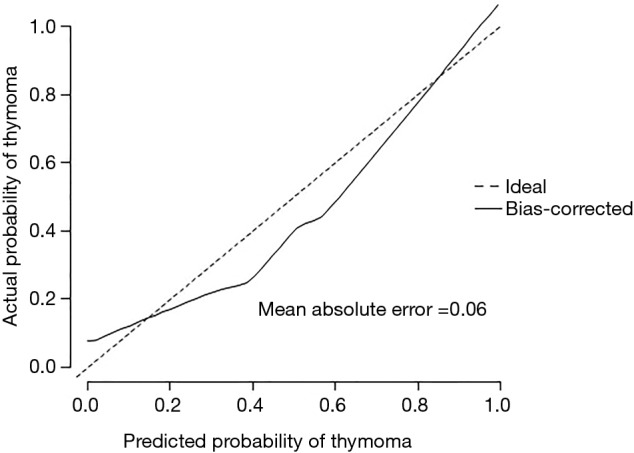
Internal validation of the predictive model.
External validation
Twenty patients who underwent thymectomy for a thymic abnormality according to the same inclusion criteria at our hospital at 2017 were enrolled for external validation of this predictive model. Table 3 shows the surface contour, degree of enhancement, probability of thymoma, and final pathology of all patients analyzed for external validation. The C-index of the model was 0.955, and it predicted thymoma with an accuracy of 88.8% and thymic cyst with an accuracy of 100.0%. Only 1 patient was incorrectly predicted, in whom the lesion was pathologically diagnosed as thymoma with a smooth surface contour and a relatively low degree of enhancement (∆HU of 11) (total score of 38) (Figure 6).
Table 3. External validation of predicting model for thymoma, 2017.
| No. | Contour | Post-pre HU | Probability | Pathology |
|---|---|---|---|---|
| 1 | Smooth | 30 | 80% | Thymoma |
| 2 | Lobulated | −5 | 40% | Cyst |
| 3 | Lobulated | 61 | 99% | Thymoma |
| 4 | Smooth | 20 | 65% | Thymoma |
| 5 | Smooth | −2 | 15% | Cyst |
| 6 | Smooth | 6 | 30% | Cyst |
| 7 | Lobulated | 25 | 95% | Thymoma |
| 8 | Smooth | −2 | 15% | Cyst |
| 9 | Smooth | −2 | 15% | Cyst |
| 10 | Smooth | 11 | 38% | Thymoma |
| 11 | Lobulated | 51 | 99% | Thymoma |
| 12 | Conformal | −16 | 1% | Cyst |
| 13 | Smooth | −5 | 15% | Cyst |
| 14 | Lobulated | 60 | 99% | Thymoma |
| 15 | Conformal | 2 | 15% | Cyst |
| 16 | Lobulated | −6 | 40% | Cyst |
| 17 | Conformal | 25 | 40% | Cyst |
| 18 | Smooth | 5 | 20% | Cyst |
| 19 | Lobulated | 7 | 65% | Thymoma |
| 20 | Lobulated | 13 | 90% | Thymoma |
Figure 6.
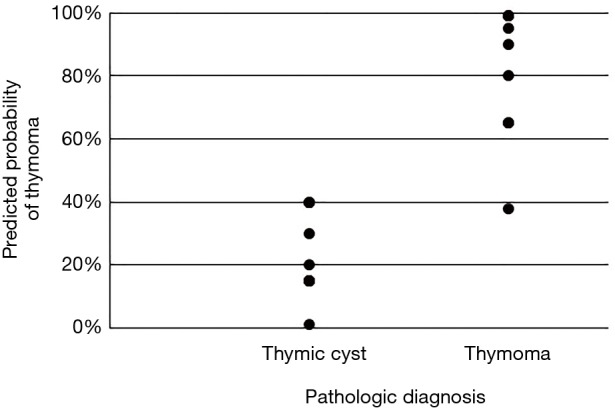
External validation of the predictive model.
Discussion
In this study, the surface contour of the mass and the degree of enhancement on contrast chest CT were found to be predictive factors for thymoma in thymic abnormalities smaller than 3 cm. As screening for lung cancer by low-dose CT is becoming popular, the detection rate of mediastinal masses is simultaneously increasing. In this study, thymic abnormalities were also detected by low-dose CT (LDCT) in most patients, and enhanced CT was performed 3 or 6 months after the first LDCT. In practice, when a small thymic abnormality is found on LDCT, enhanced CT is recommended after 6 months. McErlean et al. (1) and Henschke et al. (5) reported recent trends in detecting asymptomatic thymic abnormalities. In their study, thymic masses were the most frequent type of mediastinal mass, with a prevalence of 0.45% cases at baseline CT screening, and 87.8% of the thymic masses were smaller than 3.0 cm. The possibility that a small thymoma will invade adjacent structures or lymph nodes is very low, and needle biopsy is contraindicated for such small thymomas. Therefore, if a small thymic lesion is securely identified as thymoma, early surgical resection and minimally invasive surgery are actively recommended. In contrast, small cystic lesions can be followed without surgical resection, even though surgery is indicated for very large cystic lesions. However, discriminating thymomas from thymic cysts is very difficult in the setting of small thymic abnormalities. Therefore, non-therapeutic thymectomy rates have been reported to range from 22% to 68% (6,7). However, in most cases, thymic abnormalities larger than 3 cm were treated by surgical resection regardless of their characteristics (cyst or mass). Furthermore, thymic abnormalities larger than 3 cm are well differentiated from thymomas and thymic cysts by MRI. Therefore, we enrolled patients with thymic abnormalities measuring 3 cm or less.
Non-invasive thymoma is usually well-defined, has smooth contours, and shows homogeneous attenuation. In contrast, invasive thymoma is more likely to have a lobulated or irregular contour, and has a higher prevalence of low-attenuation areas and calcification within the tumor than non-invasive thymoma on CT (8). Thymic cysts typically manifest as well-circumscribed anterior mediastinal masses with water attenuation (9,10). When thymic cysts grow on the mediastinum-lung border, they are blocked by adjacent mediastinal structures; therefore the surface contour conforms to those structures (11).
According to a previous study, the diagnostic accuracy of thymoma by radiologists was 84% for CT and 85% for MRI, and that of thymic cyst was 46% for CT and 71% for MRI (3). In our study population, the diagnostic accuracy of the radiologist’s reading based on CT scans was 60.5% for thymoma and 87.7% for thymic cyst. Furthermore, the readings were not confirmative, but were generally indicative of suspicion for the given entity. In contrast, the diagnostic accuracy of our model based on the same CT scans that the radiologist read for diagnosis was 82.4% and 88.9% for thymoma and thymic cyst, respectively, in the internal validation, and 88.8% and 100.0% in the external validation (with a cut-off value of 52.9 decided by the maximal Youden index). Further, our model diagnosed both thymomas and thymic cysts well at both ends: all cases with a score >58 points (26.3% of the study population) were diagnosed as thymomas and all cases with a score <30 points (13.2% of the study population) were diagnosed as thymic cysts. Among the cases misdiagnosed by the radiologist, 82.3% were diagnosed correctly by our diagnostic method.
Thymic cysts may be misdiagnosed as tiny thymomas because of pseudo-enhancement due to the close location of the lesion to the aorta and sternum. In addition, unusual protein-rich thymic cysts with solid density and thymomas with low vascularity may be misdiagnosed (12). If a thymic mass is lobulated, it is often a highly invasive thymoma or thymic carcinoma. According to the World Health Organization, high-risk thymomas demonstrate a more irregular shape and contour than do low-risk thymomas (13). In our study, 62.8% of non-invasive thymomas had a lobulated contour, and only 32.5% had a smooth contour. Consistent with the study of Ackman et al. (14), the contour was more smooth or conformal to the shape of the adjacent mediastinum in thymic cysts than in small thymomas. Nonetheless, it is often difficult to distinguish thymomas from high-density small cysts possessing protein-rich content. In this respect, contrast CT scans reflecting the hemodynamic characteristics of lesions can be helpful. Multiple studies have reported the degree of enhancement of thymomas and thymic cysts (1,15).
According to several previous studies (16,17), thymic cysts were not enhanced or only showed marginal enhancement, whereas thymomas presented more uniform or even enhancement. In our study, the median ∆HU of tiny thymomas was 24.0 HU (IQR, 9.0–38.0 HU), which was higher than that of intrathymic cysts (median ∆HU, −3.0 HU; IQR, −18.0 to −5.0 HU). Even though these trends have already been reported in previous research, by combining these findings and constructing a predictive model providing exact probabilities, thymic cysts and thymomas could be distinguished better than was possible using the radiologist’s readings, which relied on intuition and experience, or the findings of the previous studies that dealt with these 2 distinctive characteristics separately.
Because of the relatively small number of patients from a single institution, as well as the fact that enhanced CT was performed in a limited number of patients, further study is needed to validate our predictive model. Considering the low risk of minimally invasive surgery in recent years, our model needs higher specificity to avoid misdiagnosing thymomas as thymic cysts. Further investigations may be helpful to compensate for the inadequacies of our model. However, this is the first study to combine ∆HU and morphology and to construct a predictive model for small thymic abnormalities (less than 3 cm), and our method based only on contrast CT imaging showed a similar diagnostic accuracy to that of MRI, which costs more and places a greater burden on patients.
Conclusions
In conclusion, a lobulated contour and a high degree of enhancement by contrast on CT scans were found to be independent predictive factors of thymoma. Our predictive model for thymoma in asymptomatic patients with small thymic abnormalities using the above 2 factors can help establish a proper treatment plan. Our model needs further validation and additional cases to confirm its effectiveness for thymic abnormalities found in CT screening.
Supplementary
The article’s supplementary files as
Acknowledgments
This was presented at the 32nd EACTS Annual Meeting, October 18-20, 2018 in 17 Milan, Italy.
Funding: This work was supported by grant No. 02-2015-013 from the SNUBH Research Fund.
Ethical Statement: The authors are accountable for all aspects of the work in ensuring that questions related to the accuracy or integrity of any part of the work are appropriately investigated and resolved. This study was approved by the institutional review board of SNUBH (B-1904-532-107), and the requirement to obtain informed consent from the subjects was waived due to the retrospective nature of the study design.
Footnotes
Conflicts of Interest: All authors have completed the ICMJE uniform disclosure form (available at http://dx.doi.org/10.21037/jtd.2020.02.14). The authors have no conflicts of interest to declare.
References
- 1.McErlean A, Huang J, Zabor EC, et al. Distinguishing benign thymic lesions from early-stage thymic malignancies on computed tomography. J Thorac Oncol 2013;8:967-73. 10.1097/JTO.0b013e3182904bc2 [DOI] [PMC free article] [PubMed] [Google Scholar]
- 2.Singla S, Litzky LA, Kaiser LR, et al. Should asymptomatic enlarged thymus glands be resected? J Thorac Cardiovasc Surg 2010;140:977-83. 10.1016/j.jtcvs.2010.08.005 [DOI] [PubMed] [Google Scholar]
- 3.Tomiyama N, Honda O, Tsubamoto M, et al. Anterior mediastinal tumors: diagnostic accuracy of CT and MRI. Eur J Radiol 2009;69:280-8. 10.1016/j.ejrad.2007.10.002 [DOI] [PubMed] [Google Scholar]
- 4.Marom EM, Rosado-de-Christenson ML, Bruzzi JF, et al. Standard report terms for chest computed tomography reports of anterior mediastinal masses suspicious for thymoma. J Thorac Oncol 2011;6:S1717-23. 10.1097/JTO.0b013e31821e8cd6 [DOI] [PubMed] [Google Scholar]
- 5.Henschke CI, Lee IJ, Wu N, et al. CT screening for lung cancer: prevalence and incidence of mediastinal masses. Radiology 2006;239:586-90. 10.1148/radiol.2392050261 [DOI] [PubMed] [Google Scholar]
- 6.Jurado J, Javidfar J, Newmark A, et al. Minimally invasive thymectomy and open thymectomy: outcome analysis of 263 patients. Ann Thorac Surg 2012;94:974-81; discussion 981-2. 10.1016/j.athoracsur.2012.04.097 [DOI] [PubMed] [Google Scholar]
- 7.Kent MS, Wang T, Gangadharan SP, et al. What is the prevalence of a "nontherapeutic" thymectomy? Ann Thorac Surg 2014;97:276-82; discussion 282. 10.1016/j.athoracsur.2013.07.121 [DOI] [PubMed] [Google Scholar]
- 8.Tomiyama N, Müller NL, Ellis SJ, et al. Invasive and noninvasive thymoma: distinctive CT features. J Comput Assist Tomogr 2001;25:388-93. 10.1097/00004728-200105000-00010 [DOI] [PubMed] [Google Scholar]
- 9.Strollo DC, Rosado de Christenson ML, Jett JR. Primary mediastinal tumors. Part 1: tumors of the anterior mediastinum. Chest 1997;112:511-22. 10.1378/chest.112.2.511 [DOI] [PubMed] [Google Scholar]
- 10.Jeung MY, Gasser B, Gangi A, et al. Imaging of cystic masses of the mediastinum. Radiographics 2002;22:S79-93. 10.1148/radiographics.22.suppl_1.g02oc09s79 [DOI] [PubMed] [Google Scholar]
- 11.Burton EM, Mercado-Deane MG, Howell CG, et al. Cervical thymic cysts: CT appearance of two cases including a persistent thymopharyngeal duct cyst. Pediatr Radiol 1995;25:363-5. 10.1007/BF02021704 [DOI] [PubMed] [Google Scholar]
- 12.Wang X, Chen K, Li X, et al. Clinical features, diagnosis and thoracoscopic surgical treatment of thymic cysts. J Thorac Dis 2017;9:5203-11. 10.21037/jtd.2017.10.148 [DOI] [PMC free article] [PubMed] [Google Scholar]
- 13.Ozawa Y, Hara M, Shimohira M, et al. Associations between computed tomography features of thymomas and their pathological classification. Acta Radiol 2016;57:1318-25. 10.1177/0284185115590288 [DOI] [PubMed] [Google Scholar]
- 14.Ackman JB, Verzosa S, Kovach AE, et al. High rate of unnecessary thymectomy and its cause. Can computed tomography distinguish thymoma, lymphoma, thymic hyperplasia, and thymic cysts? Eur J Radiol 2015;84:524-33. 10.1016/j.ejrad.2014.11.042 [DOI] [PubMed] [Google Scholar]
- 15.Araki T, Sholl LM, Gerbaudo VH, et al. Intrathymic cyst: clinical and radiological features in surgically resected cases. Clin Radiol 2014;69:732-8. 10.1016/j.crad.2014.03.002 [DOI] [PMC free article] [PubMed] [Google Scholar]
- 16.Li X, Han X, Sun W, et al. Preoperative misdiagnosis analysis and accurate distinguish intrathymic cyst from small thymoma on computed tomography. J Thorac Dis 2016;8:2086-92. 10.21037/jtd.2016.07.83 [DOI] [PMC free article] [PubMed] [Google Scholar]
- 17.Zhonggao J, YiJiao W, Yongfeng W, et al. Multislice computed tomography performance in differential diagnosis of high-density thymic cyst and thymoma in lesions less than 3 cm. Thorac Cancer 2018;9:1300-4. 10.1111/1759-7714.12840 [DOI] [PMC free article] [PubMed] [Google Scholar]
Associated Data
This section collects any data citations, data availability statements, or supplementary materials included in this article.
Supplementary Materials
The article’s supplementary files as


