

Abstract
Prostate-specific antigen velocity (PSAV) is widely used to detect PC and predict its progression. In this study, we qualitatively synthesized the currently available evidence from published studies regarding the PSAV role in PC. Electronic databases were searched to find relevant articles published until January 2019. Inclusion and exclusion criteria were applied to identify related papers. Eventually, data extraction followed by evidence synthesis was conducted. Full-text screening resulted in 42 included studies. Multiple definitions and intervals were used for PSAV calculation across studies. Results from the included studies were conflicting regarding the role of PSAV in detecting PC and predicting progression in active surveillance cases. However, there is evidence that PSAV may have a predictive role in post-treated men. There is no clear-cut evidence from the published literature to support the use of PSAV in clinical practice.
Key words: Prostate cancer, prostate-specific antigen, prostate-specific antigen velocity
Introduction
Prostate cancer (PC) is one of the most common malignancies and leading causes of cancer death in men worldwide.1,2 In 2010, PC resulted in 256,000 deaths globally.1 The American Cancer Society has estimated that 16% of American men will develop PC during their lifetime, with 3.4% at risk of death eventually.3 Prostate-specific antigen (PSA) is a commonly used test for early detection of PC. Since the introduction of PSA in clinical practice, the mortality rate was reduced by about 30%.4 However, Thompson et al.5 reported that 15% of men with a PSA value less than 4.0 ng/mL, the cutoff value for potential biopsy, were found to have cancer. To increase the accuracy and prediction, PSA kinetics, including PSA velocity (PSAV), have been proposed.
Carter et al.6 introduced PSAV as the change in PSA levels over time, given as nanograms per milliliter per year (ng/mL/y). Their study, which included 16 control patients, 20 patients with benign prostatic hypertrophy (BPH), 14 with local or regional PC, and four with metastatic PC, analyzed stored serum samples for several PSA values over a median range of 14.3 to 17.4 years. Finally, they could differentiate between those having BPH and PC based on the average rate of change in PSA of 0.75 ng/mL/y or more.6
Some studies speculated that PSAV could increase the predictive accuracy of cancer growth and predict prognosis. However, other studies provided contradictory evidence.7 Furthermore, there are variable definitions and calculations for PSAV used across the literature. In a study by O’Brien et al.,8 they found over 20 different definitions of PSAV in the literature with articles including only 2 PSA values drawn over the one-year interval to calculate PSAV, which may have affected the results. Therefore, we conducted this systematic review to build concrete evidence from studies investigating PSAV as a diagnostic and/or prognostic method for PC.
Materials and Methods
Search strategy
This study was conducted in adherence to the recommendations of preferred reporting items for systematic reviews and meta-analyses (PRISMA) statement.9 Four electronic search engines/databases were systematically searched for relevant publications, including PubMed, Scopus, Web of Science, and Cochrane Central Register for controlled clinical trials (CENTRAL) for studies in English-language published in peerreviewed journals till January 2019. Our search terms included different composites of these keywords: prostate cancer, screening, diagnosis, prognosis, surveillance, prostatectomy, prostatespecific antigen velocity, and PSAV. Additionally, we conducted a manual search via reviewing the citations of the publications included in our study, together with reviewing the related references presented in PubMed and related journals.
Selection criteria and screening for inclusion
Search results from the four aforementioned search databases were imported into Endnote X8 (Thompson Reuter, CA, USA) for automatic duplicates deletion. Three reviewers independently screened the references using the predetermined inclusion criteria. We included studies if they assessed PSAV as a diagnostic and/or prognostic method for PC, including cases before and after treatment. No restrictions were done on publication year, country, or age. Studies with unreliable data were excluded. Additionally, we excluded book chapters, conference papers, reviews, theses, posters, abstract-only articles, and editorials. Consultation from the senior reviewer was acquired if necessary. The full-text screening was conducted to identify the most relevant references for data extraction.
Data extraction
We used a data extraction form to extract relevant data from our included studies. Two independent authors then extracted the data into the form. Extracted data included authors’ details, year, sample size and characteristics, type of cohort, calculation of the PSAV, and authors’ conclusion. We further extracted any measures of predictive accuracy for either the univariate or multivariate model, including sensitivity, specificity, the area under the curve (AUC), and negative or positive predictive values.
Evidence synthesis
We qualitatively synthesized evidence from published data of retrospective and prospective studies, in addition to data from randomized trials. Our main focus was on the endpoint, which is the predictive role of PSAV in pre-treated cases, patients on active surveillance, and surgically- or radiotherapy-treated patients.
Results
Selection and characteristics of the included studies
The databases search resulted in 1540 publications. After removing 522 duplicates by the referencing software, 1018 records were eligible for screening. Title and abstract screening excluded 918 records, and we further excluded 58 articles after the full-text screening. We finally included 42 papers for our study (Figure 1). Some studies were based on data from a large cohort and randomized clinical trials. For studies assessing the predictive role of patients undergoing screening or active surveillance and undergoing biopsies, we summarized the main characteristics like the design, number of included cases for each study, number of events, endpoints for each study, and main results in Table 1.10-42 For studies assessing the prognostic role of PSAV mainly after surgery and radiotherapy, Table 243-51 was constructed to summarize the main characteristics.
The diagnostic value of prostate-specific antigen velocity in detecting prostate cancer
The included studies showed conflicting evidence regarding the predictive accuracy of PSAV for diagnosis of PC. Overall, the evidence tends to show PSAV as a predictive parameter for detecting PC but with no additive value to PSA alone (Table 1). In a retrospective study by Ukimura et al.,10 they assessed PSA, PSAV, PSA density, age-referenced PSA, and volume-referenced PSA for predicting the occurrence of cancer. The main endpoint was repeated biopsy results when the initial findings for biopsy were negative for PC. The study found that AUC is greater for PSAV than PSA. However, there was no significant merit for any of the indices, including PSAV over PSA alone in determining patients who should be considered for a repeat biopsy. Moreover, Djavan et al.11 conducted two studies with different PSA levels counting on the biopsy results as their endpoint. The first study evaluated multiple PSA parameters, including PSA density of the whole prostate and of the transition zone, PSAV, percent free PSA to test the ability for prostate cancer detection and hence decrease unnecessary biopsies in men with serum PSA levels of 4.0 to 10.0 ng/mL. They prospectively included 559 patients and showed that AUC was greater for PSA than PSAV. The second study prospectively included 273 men with serum PSA of 2.5 to 4.0 ng/mL referred to showed that AUC was greater for PSA than PSAV.12 Similarly, Lynn et al.13 included 158 and showed that the AUC was greater for PSA than PSAV, with biopsy as the endpoint of the study. In this study, a statistically significant difference was found between the short-term PSAV of patients with benign prostate and those with PC. The AUC for PSAV was 0.612, which is less than PSA alone. Carter et al.14 study based on the Baltimore Longitudinal Study of Aging (BLSA) cohort included 980 men. Of them, 104 with prostate cancer but surviving or died of another cause, and 20 who died of PC. AUC for PSAV was almost the same as PSA (0.75 vs. 0.74) at PSA cutoff value of 4 ng/mL. Men with PSA velocity above 0.35 ng/mL per year had a 4.7 higher risk ration (RR) of PC death than men with PSAV of 0.35 ng/mL per year or less. Thompson et al.15 further reported 5519 cases from the Prostate Cancer Prevention Trial (PCPT) counting on biopsy results as their endpoint. The study mentioned that PSAV did not add much to the AUC of standard predictors alone (0.709 vs. 0.702) with no improvement in the detection of high-grade cancer (0.792 reduced to 0.791). Loeb et al.16 reported data from the BLSA in which they included 6844 participants. PC diagnosis in men undergoing PSA screening was the endpoint. The AUC was slightly greater for a model that included both PSAV and PSA compared with a model that included PSA alone (0.83 vs. 0.81). Berger et al.17 studied 4800 cases with and without PC. PC diagnosis in men undergoing screening was the endpoint. AUC was significantly greater for PSAV than PSA (0.87 vs. 0.65). Sun et al.18 study included 12,087 men undergoing PSA screening. The AUC was greater for PSA than PSA velocity. Ostrted et al.19 included 4383 in the prospective Copenhagen City Heart Study. In 28 years of follow up, 170 men developed PC while 94 men died from CP. With PSAV, the age-adjusted hazard ratio (HR) for PC detection increased from 2.7 to 5.3 and PC-related death from 2.3 to 3.4. Wallener et al.20 in a retrospective study of 219,388 men, showed that PSAV could more be accurate for predicting PC (AUC = 0.963) than PSA alone (AUC = 0.727). Auprich et al.21 aimed to compare PSA, percentage free PSA (%fPSA), PSAV, and urinary prostate cancer gene 3 (PCA3) at first, second, and ≥ third repeat biopsy session. They included 127 with overall PC detection of 34.6%. At second repeat biopsy, including 40 patients, PSAV (P=0.04) was among the predictors for PC. Benecchi22 aimed to compare PSA velocity and PSA slope on 312 participants. At the ROC analysis, the PSA slope showed better results than PSAV (AUC 0.743 vs. 0.663).
Figure 1.
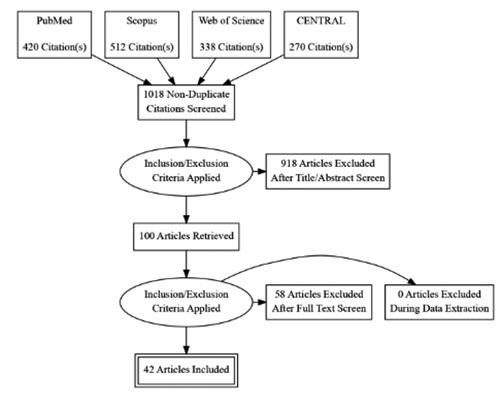
PRISMA flow diagram explaining the cascade of searching several databases, removal of duplicates, screening steps, and reviewing processes.
Table 1.
Characteristics and main results of the included studies on prostate-specific antigen velocity for prediction of diagnosis and progression on active surveillance.
| Study | Design type | Sample size | Study events | Study endpoint | Main results related to PSAV |
|---|---|---|---|---|---|
| Ukimura et al.10 | Retrospective cohort | 193 | 54 | Repeat biopsy findings when the initial one is negative for PC | AUC for PSAV is greater than PSA. Additionally, PC incidence is significantly higher in men with a PSAV of more than 0.75 ng/m/yr. PSAV had a good PPV (42%) with lower sensitivity (57%) compared to either volume-referenced PSA or PSA |
| Djavan et al.11 | Prospective cohort | 559 | 217 | Biopsy findings | AUC is greater for PSA than PSAV |
| Dajvan et al.12 | Prospective cohort | 273 | 66 | Biopsy findings | AUC is greater for PSA than PSAV |
| Lynn et al.13 | Prospective cohort | 197 | 38 | Biopsy findings | AUC is greater for PSA than PSAV |
| Carter et al.14 | Prospective cohort | 980 | 20 | PC death before diagnosis from samples | AUC for PSAV is greater than for PSA (0.75 vs. 0.74) |
| Thompson et al.15 | RCT | 5519 | 1211 | Biopsy findings | PSAV AUC was slightly greater compared to standard predictors alone (0.709 vs 0.702) and did not improve detection of high-grade cancer (0.792 reduced to 0.791) |
| Loeb et al.16 | Prospective cohort | 6,844 | 346 | Diagnosis of PC during screening | PSAV AUC model is greater compared to PSA alone model (0.83 vs. 0.81) |
| Berger et al.17 | Prospective cohort | 4800 | 528 | Diagnosis of PC during screening | AUC is greater for PSAV than PSA (0.87 vs. 0.65) |
| Sun et al.18 | Retrospective cohort | 12087 | 1622 | Diagnosis of PC during screening | AUC for PSA is greater than PSAV. |
| Ostrted et al.19 | Prospective cohort | 4383 | 170 | Detection during follow-up and death | The age-adjusted hazard ratio (HR) for PC detection increased from 2.7 to 5.3 and PC-related death from 2.3 to 3.4 with PSAV |
| Wallener et al.20 | Retrospective cohort | 219,388 | - | Biopsy findings | PSAV predicted the presence of PC (AUC = 0.963) and the presence of aggressive disease (AUC = 0.955) with more than a single measurement of PSA alone (AUC = 0.727) |
| Auprich et al.21 | Retrospective cohort | 127 | 44 | Repeat biopsy finding | At second repeat biopsy, PSAV was identified as statistically significant univariable PCa risk factors, with an AUC of 0.72 |
| Benecchi22 | Prospective cohort | 312 | 67 | Biopsy findings | PSAV was significantly higher in patients with PC. PSA slope was better than than PSA velocity (AUC 0.743 vs. AUC 0.663 for PSAV) |
| Benchi et al.23 | Prospective cohort | 325 | 74 | Biopsy findings | PSAV was significantly higher in patients with PC. lnPSA slope (AUC 0.793) was better results than PSA (AUC, 0.585), PSAV(AUC, 0.734), PSA slope (AUC, 0.752), and PSADT (AUC, 0.516). |
| Berger et al.24 | Retrospective cohort | 2815 | 353 | Biopsy findings | PSA velocity was significantly associated with Gleason scores and pathologic stage. |
| Bittner et al.25 | Prospective cohort | 217 | 97 | Biopsy findings | PSAV did not predict PC diagnosis, Gleason score, percentage of positive cores, or tumor location. |
| Gorday et al.26 | Retrospective cohort | 4622 | 2410 | Biopsy findings | PSAV with PSA AUC = 0.570–0.712 was non statistically significant compared to PSA alone (AUC = 0.572–0.699). |
| Barak et al.27 | Prospective cohort | 273 | 75 | Biopsy findings | PSAV had slightly lower sensitivity but much higher specificity than PSA |
| Fang et al.28 | Prospective cohort | 89 | 21 | Biopsy findings | The relative risk (RR) of CaP was 6.53 when the PSAV was 0.1 ng/ml/y or more compared with a PSAV of less than 0.1 ng/ml/y (P = 0.0029). After10 years, the probability of being PC free was 97.1% and 35.2% when the PSAV was less than and greater than 0.1 ng/ml/y, respectively. |
| Roobol et al.29 | Randomized study | 774 | 149 | Biopsy findings | PSAV was significantly higher in men with PC than in men with a negative biopsy (0.62 vs 0.46 ng/mL/year) but PSAV did not independently predict cancer after adjusting for PSA level. |
| Ciatto et al.30 | Prospective cohort | 87 | 13 | Biopsy findings | AUC was higher for PSAV than PSA (0.74 vs. 0.67). The PPV for a cancer biopsy was 2.7% (1/36), 28.5% (2/7), and 22.7% (10/44) for PSAV values of <0.1, 0.1–0.19, and >0.19 ng/mL/yr |
| Schroeder et al.32 | Randomized study | 588 | 167 | Biopsy findings | PSAV cut-off points was not helpful for PC prediction |
| Ulmert et al.33 | Preventive medicine study | 4907 | 433 | Diagnosis during screening | There is a strong correlation between PSAV and PSA level (r = 0.93) and PSAV did not add much to PSA prediction. |
| Vickers et al.34 | Randomized study | 2742 | 710 | Biopsy findings | PSAV improved the predictive accuracy of total PSA slightly (AUC 0.57 vs 0.53) |
| Vicker et al.35 | Randomized study | 2579 | 363 | Biopsy findings | PSAV is statistically associated with PC but with low predictive accuracy (AUC 0.55) |
| Ito et al.36 | Prospective cohort | 504 | - | Biopsy findings | PSAV before the PSA increase was not significantly different between those with and without PC |
| Whitson et al.37 | Prospective cohort | 241 | 55 | Biopsy findings of progression on AS | PSAV was not statistically significant in predicting progression on AS |
| Ng et al.38 | Prospective cohort | 199 | 53 | Biopsy findings of progression on AS | AUC for predicting adverse histology of patients on AS was 0.70 and 0.63 for PSAV and PSADT, respectively. |
| Ross et al.39 | Prospective cohort | 290 | 102 | Biopsy findings of progression on AS | PSAV was not correlated with subsequent adverse biopsy findings significantly |
| Kotb et al.40 | Prospective cohort | 102 | - | Biopsy findings of progression on AS | PSAV was correlated (0.3) with progression |
| Iremashvili et al.41 | Prospective cohort | 250 | 64 | Biopsy findings of progression on AS | PSAV predicted tumor progression in certain subgroups as men undergoing their fourth biopsy significantly but no significant increase in the predictive accuracy was showed on the overall population compared with PSA alone. |
| Iremashvili et al.42 | Prospective cohort | 137 | 37 | Biopsy findings of progression on AS | Prediagnostic PSAV of more than 2 ng/mL/year and 3 ng/mL/year was associated with the risk of future biopsy progression but this was not significant after adjustment for baseline PSA density |
PSA, prostate-specific antigen; AUC, area under the curve; AS, active surveillance, PPV, positive predictive value, NPV, negative predictive value.
Benchi et al.23 aimed to compare prostate biopsy, PSAV, PSA slope, the natural logarithm of PSA slope (ln PSA slope), and PSA doubling time (PSADT) on 325 male patients. PSAV AUC was significant and equaled 0.734. Berger et al.24 study assessed PSA changes over ten years in patients with and without prostate cancer. PSAV was found to be associated with Gleason scores and pathologic stage. Bittner et al.25 evaluated 217 patients undergoing biopsy. The PSAV was not showed to be a predictor for PC diagnosis, Gleason score, tumor volume, and cancer location. Gorday et al.26 included 4622 men. PSAV with PSA AUC = 0.570-0.712 was nonstatistically significant compared to PSA alone (AUC = 0.572-0.699). Barak et al.27 included 147 patients who were eligible for biopsy, with 72 found to have a benign prostatic disease, while 75 had primary prostate cancer. They showed that PSAV had a slightly lower sensitivity but much higher specificity than PSA. Fang et al.28 evaluated 89 men from the BLSA with PSA levels between 2.0 and 4.0 ng/mL for at least 18 months. They reported that the sensitivity and specificity of PSAV of 0.1 ng/mL/y was 81% and 50%, respectively. The RR of PC was 6.53 when the PSAV was 0.1 ng/mL/y or more compared with a PSAV of less than 0.1 ng/mL/y which was statistically significant. After 10 years, the probability of being PC free was 97.1% and 35.2% when the PSAV was less than and greater than 0.1 ng/mL/y, respectively. In a study conducted among 774 men with PSA below 4.0 ng/mL who had their first biopsies during the European Randomized Study of Screening for Prostate Cancer (ERSPC), 149 were found to have cancer. The study reported that PSAV only did not differentiate between men with and without PC diagnosed by biopsies (0.62 versus 0.46 ng/mL/year). Furthermore, the sensitivity of a PSAV cutoff of 0.3 ng/mL/year was only 39%.29 Ciatto et al.30 evaluated 87 men with initial negative biopsy and repeat biopsies performed for PSA elevation (>4 ng/mL). AUC was higher for PSAV than PSA (0.74 vs. 0.67). PSAV was significantly associated with biopsy results. The positive predictive value was 22.7% for PSAV >0.19 ng/mL/yr. In a study by Eggener et al.31 on 995 men, the negative predictive value of PSA velocity was almost the same as PSA (91% vs 88%). The main endpoint was the biopsy result in men with the first neg ative biopsy. In another study by Schroeder et al.,32 PSAV was applied to the data of 588 men from ERSPC who presented at their first screening with PSA of 4.0 ng/mL. Their results showed no value of PSAV cutoff values for improving the positive predictive value of the PSA cutoff of 4.0 ng/mL. However, the rate of aggressive cancers seemed to increase with increasing PSAV. Ulmert et al.33 questioned if PSAV improved the accuracy of a model using the PSA level to predict long-term risk of PC diagnosis. They included 4907 participants and found that PSAV was highly correlated with PSA level (r = 0.93), which means no value of adding PSAV to predict PC. Vickers et al.34 included 2742 men with PSA <3 ng/mL from ERSPC. PSAV added a little to the predictive accuracy (AUC 0.569 vs 0.531). In addition, Vicker et al.35 also reported that PSAV was of no additive value in men with prior negative biopsies. Ito et al.36 carried out a study on 504 men with baseline PSA of 4.0 ng/mL or less who had a PSA increase greater than 4.0 ng/mL on the following screening. The results showed that PSAV was not significantly different between those with and without PC.
Table 2.
Characteristics and main results of the included studies on prostate-specific antigen velocity for prediction of prognosis in the treated cases of prostate cancer.
| Study | Design | Intervention type | Number of patients | Events | Endpoint | Main results related to PSAV |
|---|---|---|---|---|---|---|
| Freedland et al.43 | Clinical cohort | Radical prostatectomy | 331 | - | Pathologic features or biochemical recurrence | Preoperative PSAV was not predictive of positive surgical margins, capsular penetration, or seminal vesicle invasion and it was not predictor of bi chemical recurrence. |
| D'Amico e et al.44 | Clinical cohort | Radical prostatectomy | 1095 | 27 | Death due to PC | Annual PSAV of more than 2.0 ng/ml was associated with a shorter time to death from PC |
| D'Amico et al.45 | Clinical cohort | Radiotherapy | 358 | 28 | Death due to PC | Annual PSAV of more than 2.0 ng/ml was associated with a shorter time to death from PC |
| Sengupta et al.46 | Clinical cohort | Radical prostatectomy | 2290 | Biochemical progression, clinical progression and death from PC in 583, 156 and 42 patients | Biochemical progression, clinical progression and death from PC | PSAAV was a significant predictor for biochemical progression, clinical progression, and death specific PC |
| Patel et al.47 | Clinical cohort | Radical prostatectomy | 202 | 31 | Relapse | Preoperative PSAV of greater than 2 ng/ml/y predicted surgical stage, positive margins, pathologic grade, and relapse-free survival. |
| Berger et al.48 | Clinical cohort | Radical prostatectomy | 102 | - | Biochemical progression | PSAV were found to be correlated significantly with tumor volume, but not prostate volume |
| Palma et al.49 | Clinical cohort | 202 | - | Biochemical disease-free survival | PSAV greater than 2.0 ng/mL/year is associated with reduced biochemical disease-free survival. | |
| Datan et al.50 | Clinical cohort | Radical prostatectomy | 239 | 60 | Positive bone scan | In univariate and multivariate analysis, preoperative PSAV predicted a positive bone scan with OR of 0.93. |
| Helfand et al.51 | Retrospective cohort | Transurethral resection of the prostate, holmium laser resection of the prostate, or open prostatectomy | 465 | - | Incidental PC | Patients with PC had a significantly high postoperative PSAV compared with patients without PC |
PSA, prostate-specific antigen; PC, prostate cancer.
Prostate-specific antigen velocity predictive role for progression on active surveillance
Several studies have investigated the role of PSAV during surveillance. However, the evidence is not consistent across them. For instance, Whitson et al.37 included 241 men undergoing active surveillance (AS). In 55 of them, biopsy progression took place over a 24-month period. The study found no statistically significant role for PSAV in predicting progression. Ng et al.38 aimed to compare PSAV vs. PSADT in 199 patients with PC on active surveillance. Using univariate analysis, PSAV was associated with adverse histology with AUC of 0.70. In a study by Ross et al.39 for patients on active surveillance, the rate of disease progression was 35% on repeat biopsy, and PSAV was not a significant predictor of progression on univariate analysis. Kotb et al.40 evaluated 102 patients with localized PC on active surveillance. They found that PSAV correlated with tumor progressing on subsequent biopsies (P=0.03). Iremashvili et al.41 Showed that PSAV significantly predicted tumor progression in specific subgroups as men undergoing their fourth biopsy, but no significant increase in the predictive accuracy was shown in the overall population compared with PSA alone. Additionally, another study included 137 patients on active surveillance. They showed that Pre-diagnostic PSAV of more than 2 ng/mL/year and 3 ng/mL/year was associated with the risk of future biopsy progression, but this was not significant after adjustment for baseline PSA density.42
Prostate-specific antigen velocity predictive role after surgical and radiotherapy treatment
PSAV was of a good predictive value in treated cases. Yet, the difference in the predictive model with and without PSAV is still unclear (Table 2). Freedland et al.43 evaluated 331 men who underwent radical retro-pubic prostatectomy for PC. They found that preoperative PSAV was not predictive of positive surgical margins, capsular penetration, or seminal vesicle invasion, and it was not a predictor of biochemical recurrence. D’Amico et al.44 assessed 1095 patients undergoing radical prostatectomy. They found that PSAV above 2.0 ng/mL/y before surgery had a significantly shorter time to recurrence, death from PC. Similarly, D’Amico et al.45 reported a cohort of 358 men who underwent external beam radiation. They estimated that 7-year PSA recurrence was 78% vs. 54% for patients with PSAV more than and less than 2.0 ng/mL/y, respectively. For mortality due to PC, the estimates were 19% vs. 0%. Sengupta et al.46 included 2290 patients who underwent radical retro-pubic prostatectomy. PSAV was a significant predictor of biochemical progression, clinical progression, and death specific PC. In addition, Patel et al.47 further studied 202 men performing radical prostatectomy. They reported that preoperative PSAV of greater than 2 ng/mL/y predicted surgical stage, positive margins, pathologic grade, and relapse-free survival. Berger et al.48 evaluated 102 patients having a radical retro-pubic prostatectomy. The PSAV was significantly correlated with tumor volume, but not prostate volume. The median PSAV in the year before diagnosis in men with and without relapse was 1.98 vs. 1.05 ng/mL/y. Palma et al.49 reported on 473 patients with PC treated with external beam radiation therapy. Men with a PSAV greater than 2.0 ng/mL/year had a shorter biochemical disease-free survival compared with men with PSAV of 2.0 ng/mL/y. However, on multivariate analysis, PSAV was no longer a significant predictor of biochemical disease- free survival in the entire cohort (p=0.09). PSAV was an independent predictor of biochemical recurrence in high-risk patients only. However, it does not predict survival outcomes. Datan et al.50 built a predictive model for a positive scan. In univariate and multivariate analysis, preoperative PSAV predicted a positive bone scan with an odds ratio of 0.93. Helfand et al.51 performed a review of cases undergoing transurethral resection of the prostate, holmium laser resection of the prostate, or open prostatectomy. Patients with PC had a significantly higher postoperative PSAV compared with patients without PC.
Discussion
Since Carter et al.6 introduced PSAV, there have been many studies trying to connect the dots for its diagnostic and prognostic value. In our study, the qualitative synthesis showed big controversial results regarding the PSAV prediction value. However, the available evidence suggests a better value of PSAV in post-treated compared to pre-treated patients.
Across the studies, several ways of calculating PSAV with different durations and intervals were proposed, which may have affected the results. For instance, D’Amico et al.44 calculated PSAV over one year based on only two values. Moreover, Critical reviews discussed the effect of the mode of PC detection on PSAV.52,53 For instance, cancers detected by screening may tend to have lower PSA and PSAV compared to clinically detected cancers, which may lead to bias.53 In addition, some studies showed significant co-linearity of both PSA and PSAV.15 That’s why some authors criticized the real value that PSAV can add with all these complicated calculations and definitions.54 Verification bias was encountered as a big issue that may affect some of our included studies.18
Some of our included studies were based on PCPT data, but D’Amico reported that the PCPT data had no quality assurance for PSA tests, which might affect the accuracy of the results.55 In that context, Carter et al.56 introduced the concept of PSAV risk count assessment as a concept that could aid in the long-term prediction of potentially killing PC. They built it on the hypothesis that men with dangerous advanced disease may have consistent increases in PSA compared with others. Adding to the conflicting results and sever methodological variability, applying the PSAV calculation using the accurate interval and standard methods may be hard in real clinical practice for urologists. Our systematic review has its limitations due to the variability of comparisons and reporting of studies assessing the utility of PSAV.
Conclusions
To summarize, our study did not find clear-cut evidence to support the use of PSAV as a diagnostic predictive tool to indicate the need for biopsy or in AS. Furthermore, the PSAV role is not fully clear in the prognosis of treated cases. Therefore, we highly encourage more future well designed prospective studies employing the standard definition and calculation of PSAV. In addition, studies comparing both PSAV and PSA and PSA alone are warranted.
References
- 1.Lozano R, Naghavi M, Foreman K, et al. Global and regional mortality from 235 causes of death for 20 age groups in 1990 and 2010: a systematic analysis for the Global Burden of Disease Study 2010. Lancet 2012;380:2095-128. [DOI] [PMC free article] [PubMed] [Google Scholar]
- 2.Jemal A, Bray F, Center MM, et al. Global cancer statistics. CA Cancer J Clin 2011;61:69-90. [DOI] [PubMed] [Google Scholar]
- 3.Acs A. Cancer facts and figures 2010. American Cancer Society, National Home Office, Atlanta. 2010:1-44. [Google Scholar]
- 4.Etzioni R, Tsodikov A, Mariotto A, et al. Quantifying the role of PSA screening in the US prostate cancer mortality decline. Cancer Causes Control 2008;19:175-81. [DOI] [PMC free article] [PubMed] [Google Scholar]
- 5.Thompson IM, Pauler DK, Goodman PJ, et al. Prevalence of prostate cancer among men with a prostate-specific antigen level≤ 4.0 ng per milliliter. N Engl J Med 2004;350:2239-46. [DOI] [PubMed] [Google Scholar]
- 6.Carter HB, Pearson JD, Metter EJ, et al. Longitudinal evaluation of prostate-specific antigen levels in men with and without prostate disease. JAMA 1992;267:2215-20. [PMC free article] [PubMed] [Google Scholar]
- 7.Vickers AJ, Brewster SF. PSA velocity and doubling time in diagnosis and prognosis of prostate cancer. Br J Med Surg Urol 2012;5:162-8. [DOI] [PMC free article] [PubMed] [Google Scholar]
- 8.O’Brien MF, Cronin AM, Fearn PA, et al. Pretreatment prostate-specific antigen (PSA) velocity and doubling time are associated with outcome but neither improves prediction of outcome beyond pretreatment PSA alone in patients treated with radical prostatectomy. J Clin Oncol 2009;27:3591. [DOI] [PMC free article] [PubMed] [Google Scholar]
- 9.Moher D, Liberati A, Tetzlaff J, et al. Preferred reporting items for systematic reviews and meta-analyses: the PRISMA statement. PLoS Med 2009;6:e1000097. [DOI] [PMC free article] [PubMed] [Google Scholar]
- 10.Ukimura O, Durrani O, Babaian RJ. Role of PSA and its indices in determining the need for repeat prostate biopsies. Urology 1997;50:66-72. [DOI] [PubMed] [Google Scholar]
- 11.Djavan B, Zlotta A, Byttebier G, et al. Prostate-specific antigen density of the transition zone for early detection of prostate cancer. J Urol 1998;160:411-8. [PubMed] [Google Scholar]
- 12.Djavan B, Zlotta A, Kratzik C, et al. PSA, PSA density, PSA density of transition zone, free/total PSA ratio, and PSA velocity for early detection of prostate cancer in men with serum PSA 2.5 to 4.0 ng/mL. Urology 1999;54:517-22. [DOI] [PubMed] [Google Scholar]
- 13.Lynn N, Collins G, O’Reilly P. The short-term prostate-specific antigen velocity before biopsy can be used to predict prostatic histology. BJU Int 2000;85:847-50. [DOI] [PubMed] [Google Scholar]
- 14.Carter HB, Ferrucci L, Kettermann A, et al. Detection of lifethreatening prostate cancer with prostate-specific antigen velocity during a window of curability. J Natl Cancer Inst 2006;98:1521-7. [DOI] [PMC free article] [PubMed] [Google Scholar]
- 15.Thompson IM, Ankerst DP, Chi C, et al. Assessing prostate cancer risk: results from the Prostate Cancer Prevention Trial. J Natl Cancer Inst 2006;98:529-34. [DOI] [PubMed] [Google Scholar]
- 16.Loeb S, Roehl KA, Catalona WJ, Nadler RB. Prostate-specific antigen velocity threshold for predicting prostate cancer in young men. J Urol 2007;177:899-902. [DOI] [PubMed] [Google Scholar]
- 17.Berger AP, Deibl M, Strasak A, et al. Large-scale study of clinical impact of PSA velocity: long-term PSA kinetics as method of differentiating men with from those without prostate cancer. Urology 2007;69:134-8. [DOI] [PubMed] [Google Scholar]
- 18.Sun L, Moul JW, Hotaling JM, et al. Prostate-specific antigen (PSA) and PSA velocity for prostate cancer detection in men aged< 50 years. BJU Int 2007;99:753-7. [DOI] [PubMed] [Google Scholar]
- 19.Orsted DD, Bojesen SE, Kamstrup PR, Nordestgaard BG. Long-term prostate-specific antigen velocity in improved classification of prostate cancer risk and mortality. Eur Urol 2013;64:384-93. [DOI] [PubMed] [Google Scholar]
- 20.Wallner LP, Frencher SK, Hsu JWY, et al. Changes in serum prostate specific antigen levels and the identification of prostate cancer in a large managed care population. BJU Int 2013;111:1245-52. [DOI] [PubMed] [Google Scholar]
- 21.Auprich M, Augustin H, Budaus L, et al. A comparative performance analysis of total prostate specific antigen, percentage free prostate specific antigen, prostate specific antigen velocity and urinary prostate cancer gene 3 in the first, second and third repeat prostate biopsy. BJU Int 2012;109:1627-35. [DOI] [PubMed] [Google Scholar]
- 22.Benecchi L. PSA velocity and PSA slope. Prostate Cancer Prostat Dis 2006;9:169. [DOI] [PubMed] [Google Scholar]
- 23.Benecchi L, Pieri AM, Pastizzaro CD, Potenzoni M. Optimal measure of PSA kinetics to identify prostate cancer. Urology 2008;71:390-4. [DOI] [PubMed] [Google Scholar]
- 24.Berger AP, Deibl M, Steiner H, et al. Longitudinal PSA changes in men with and without prostate cancer: assessment of prostate cancer risk. Prostate 2005;64:240-5. [DOI] [PubMed] [Google Scholar]
- 25.Bittner N, Merrick GS, Andreini H, et al. Prebiopsy PSA velocity not reliable predictor of prostate cancer diagnosis, Gleason score, tumor location, or cancer volume after TTMB. Urology 2009;74:171-6. [DOI] [PubMed] [Google Scholar]
- 26.Gorday W, Sadrzadeh H, de Koning L, Naugler CT. Prostate-specific antigen velocity is not better than total prostate-specific antigen in predicting prostate biopsy diagnosis. Clin Biochem 2015;48:1230-4. [DOI] [PubMed] [Google Scholar]
- 27.Barak M, Cohen M, Mecz Y, et al. The additional value of free prostate specific antigen to the battery of age-dependent prostate-specific antigen, prostate-specific antigen density and velocity. Clin Chem Lab Med 1997;35:475-82. [DOI] [PubMed] [Google Scholar]
- 28.Fang J, Metter EJ, Landis P, Carter HB. PSA velocity for assessing prostate cancer risk in men with PSA levels between 2.0 and 4.0 ng/mL. Urology 2002;59:889-93. [DOI] [PubMed] [Google Scholar]
- 29.Roobol M, Kranse R, De Koning H, Schroder F. Prostate-specific antigen velocity at low prostate-specific antigen levels as screening tool for prostate cancer: results of second screening round of ERSPC (ROTTERDAM). Urology 2004;63:309-13. [DOI] [PubMed] [Google Scholar]
- 30.Ciatto S, Lombardi C, Rubeca T, Zappa M. Predictors of random sextant biopsy outcome in screened men with PSA> 4 ng/mL and a negative sextant biopsy at previous screening. Experience in a population-based screening program in Florence. Int J Biol Markers 2004;19:89-92. [DOI] [PubMed] [Google Scholar]
- 31.Eggener SE Roehl KA Catalona WJ.. Predictors of subsequent prostate cancer in men with a prostate specific antigen of 2.6 to 4.0 ng/mL and an initially negative biopsy. J Urol 2005;174:500-4. [DOI] [PubMed] [Google Scholar]
- 32.Schroder FH, Roobol MJ, van der Kwast TH, et al. Does PSA velocity predict prostate cancer in pre-screened populations? Eur Urol 2006;49:460-5. [DOI] [PubMed] [Google Scholar]
- 33.Ulmert D, Serio AM, O’Brien MF, et al. Long-term prediction of prostate cancer: prostate-specific antigen (PSA) velocity is predictive but does not improve the predictive accuracy of a single PSA measurement 15 years or more before cancer diag nosis in a large, representative, unscreened population. J Clin Oncol 2008;26:835-41. [DOI] [PubMed] [Google Scholar]
- 34.Vickers AJ, Wolters T, Savage CJ, et al. Prostate-specific antigen velocity for early detection of prostate cancer: result from a large, representative, population-based cohort. Eur Urol 2009;56:753-60. [DOI] [PMC free article] [PubMed] [Google Scholar]
- 35.Vickers AJ, Wolters T, Savage CJ, et al. Prostate-specific antigen velocity does not aid prostate cancer detection in men with prior negative biopsy. J Urol 2010;184:907-12. [DOI] [PMC free article] [PubMed] [Google Scholar]
- 36.Ito K, Yamamoto T, Ohi M, et al. Natural history of PSA increase with and without prostate cancer. Urology 2003;62:64-9. [DOI] [PubMed] [Google Scholar]
- 37.Whitson JM PS, Hilton JF, Cowan JE, et al. The relationship between prostate specific antigen change and biopsy progression in patients on active surveillance for prostate cancer. J Urol 2011;185:1656-60. [DOI] [PubMed] [Google Scholar]
- 38.Ng MK VAN, Thomas K, Woode-Amissah R, et al. Prostate-specific antigen (PSA) kinetics in untreated, localized prostate cancer: PSA velocity vs PSA doubling time. BJU Int 2009;103:872-6. [DOI] [PubMed] [Google Scholar]
- 39.Ross AE LS, Landis P, Partin AW, et al. Prostate-specific antigen kinetics during follow-up are an unreliable trigger for intervention in a prostate cancer surveillance program. J Clin Oncol 2010;28:2810-6. [DOI] [PubMed] [Google Scholar]
- 40.Kotb AF TS, Luz MA, Kassouf W, Aprikian AG. Relationship between initial PSA density with future PSA kinetics and repeat biopsies in men with prostate cancer on active surveillance. Prostate Cancer Prostat Dis 2011;14:53. [DOI] [PMC free article] [PubMed] [Google Scholar]
- 41.Iremashvili VMM, Lokeshwar SD, Rosenberg DL, et al. Comprehensive analysis of post diagnostic prostate specific antigen kinetics as predictor of a prostate cancer progression in active surveillance patients. BJU Int 2013;111:396-403. [DOI] [PubMed] [Google Scholar]
- 42.Iremashvili VBS, Manoharan M, Kava BR, et al. Prediagnostic prostate-specific antigen kinetics and the risk of biopsy progression in active surveillance patients. Int J Urol 2016;23:313-7. [DOI] [PubMed] [Google Scholar]
- 43.Freedland SJ DF, Aronson WJ. Preoperative PSA velocity and doubling time do not predict adverse pathologic features or biochemical recurrence after radical prostatectomy. Urology 2001;57:476-80. [DOI] [PubMed] [Google Scholar]
- 44.D’amico AV CM, Roehl KA, Catalona WJ. Preoperative PSA velocity and the risk of death from prostate cancer after radical prostatectomy. N Engl J Med 2004;351:125-35. [DOI] [PubMed] [Google Scholar]
- 45.D’Amico AV RA, Sussman B, Chen MH. Pretreatment PSA velocity and risk of death from prostate cancer following external beam radiation therapy. JAMA 2005;294:440-7. [DOI] [PubMed] [Google Scholar]
- 46.Sengupta S MR, Slezak JM, Bergstralh EJ, et al. Preoperative prostate specific antigen doubling time and velocity are strong and independent predictors of outcomes following radical prostatectomy. J Urol 2005;174:2191-6. [DOI] [PubMed] [Google Scholar]
- 47.Patel DA PJJ, McNeal JE, Gill H, et al. Preoperative PSA velocity is an independent prognostic factor for relapse after radical prostatectomy. J Clin Oncol 2005;23:6157-2. [DOI] [PubMed] [Google Scholar]
- 48.Berger AP DM, Strasak A, Bektic J, et al. Relapse after radical prostatectomy correlates with preoperative PSA velocity and tumor volume: results from a screening population. Urology 2006;68:1067-71. [DOI] [PubMed] [Google Scholar]
- 49.Palma D TS, Blood P, Liu M, et al. Prostate Cohort Outcomes Initiative. Pretreatment PSA velocity as a predictor of disease outcome following radical radiation therapy. Int J Radiat Oncol Biol Physics 2007;67:1425-9. [DOI] [PubMed] [Google Scholar]
- 50.Dotan ZA BJF, Rabbani F, Eastham JA, et al. Pattern of prostate-specific antigen (PSA) failure dictates the probability of a positive bone scan in patients with an increasing PSA after radical prostatectomy. J Clin Oncol 2005;23:1962. [DOI] [PMC free article] [PubMed] [Google Scholar]
- 51.Helfand BT AC, Fought A, Kim DY, et al. Postoperative PSA and PSA velocity identify presence of prostate cancer after various surgical interventions for benign prostatic hyperplasia. Urology 2009;74:177-83. [DOI] [PubMed] [Google Scholar]
- 52.Draisma G BR, Otto SJ, van der Cruijsen IW, et al. Lead times and overdetection due to prostate-specific antigen screening: estimates from the European Randomized Study of Screening for Prostate Cancer. J Natl Cancer Inst 2003;95:868-78. [DOI] [PubMed] [Google Scholar]
- 53.Etzioni RD AD, Weiss NS, Inoue LY, Thompson IM. Is prostate-specific antigen velocity useful in early detection of prostate cancer? A critical appraisal of the evidence. J Natl Cancer Inst 2007;99:1510-5. [DOI] [PubMed] [Google Scholar]
- 54.Vickers AJ TC, Tangen CM, Lilja H, Thompson IM. An empirical evaluation of guidelines on prostate-specific antigen velocity in prostate cancer detection. J Natl Cancer Inst 2011;103:462-9. [DOI] [PMC free article] [PubMed] [Google Scholar]
- 55.RS T. Measuring the importance of PSA velocity. J Natl Cancer Inst 2011;103:454-61. [DOI] [PubMed] [Google Scholar]
- 56.Carter HB KA, Ferrucci L, Landis P, Metter EJ. 1743: Risk Count Assessment: A New Concept for Detection of Life Threatening Prostate Cancer During a Window of Curability. J Urol 2007;177:579-80. [DOI] [PMC free article] [PubMed] [Google Scholar]