

Abstract
With increasing improvements in the time of flight (TOF) resolution of positron emission tomography (PET) scanners, an accurate model of the TOF measurements is becoming increasingly important. This work considers two parameters of the TOF kernel; the relative positioning of the timing data-bins and the timing resolution along each line of response (LOR). Similar to an existing data-driven method, we assume that any shifts of data-bins along lines of response can be modelled as differences between crystal timing offsets. Inspired by this, timing resolutions of all LORs are modelled as the hypotenuse of timing resolutions of the crystal-pairs in coincidence. Furthermore, in order to mitigate the influence of potential inaccuracies of detector-pair sensitivities on crystal timing resolutions, relative LOR sensitivities are modelled as the product of efficiency factors for the two crystals in coincidence. We validate estimating maps of crystal timing offsets, timing resolutions and efficiencies from the emission data using noisy simulations of a brain phantom. Results are shown for phantom and patient data scanned on clinically available TOF-PET scanners. We find that the estimation of crystal timing resolutions is more sensitive to the data statistics than the estimation of crystal timing offsets. As a result, estimation of crystal timing properties could either be limited to high count emission data, or be obtained utilizing additional regularizations on the estimates. Using a more accurate model of the TOF acquisition, improvements are observed in standard activity reconstructions as well as joint reconstructions of activity and attenuation.
Index Terms—: Time of flight (TOF), positron emission tomography (PET), timing calibration, joint reconstruction
I. INTRODUCTION
The addition of time of flight (TOF) information in positron emission tomography (PET) enables a more robust reconstruction of the tracer distribution uptake [1]. Furthermore, it enables the estimation of the attenuation image from the PET data, if the spatial distribution of the activity is wider than the TOF resolution of the scanner [2]. The use of TOF-PET data requires accurate alignment of the timing information, which is typically obtained by an additional acquisition of a known activity distribution [3], from background LSO radiation [4] or from the clinical data either iteratively [5] or using analytical consistency conditions [6]. This is becoming increasingly important with improving TOF resolutions of clinical TOF-PET scanners.
The TOF resolution of a PET scanner has always been experimentally measured using point/line source measurements [7, 8]. Typically the measurements are histogrammed and analyzed based on crystal-pair arrival times (avoiding any TOF binning/mashing of emission data). To be able to histogram the emission data and to reliably estimate the TOF resolution, photon arrival times as tagged by the detectors are required to be calibrated to a global time point [3, 5, 9]. Since the most likely point of origin of an event along an LOR is determined by the difference in photon-pair arrival times, any drift to the global time is inconsequential. Any relative timing drifts among detectors however, will not only have an effect on the estimated TOF resolution but also on reconstructions of the tracer activity distribution. The qualitative and quantitative improvements in standard activity reconstructions due to improvements in the TOF resolutions of PET scanners have been well investigated by many authors [10]. The influence of a mismatch between the expected and the actual TOF resolution on reconstructions has been studied as well [11, 12]. In these studies, the TOF-kernel width was typically treated as a global system parameter, and the effect of the TOF resolution was evaluated on the reconstruction of the activity assuming that the attenuation was known. However, a comprehensive study analyzing these effects as well as inaccuracies in measured detector photon arrival times on joint reconstructions using TOF-PET emission data [13] is still missing from the literature [14–17].
When the TOF resolution is measured experimentally, the amplitude of the Gaussian distribution being fit to the histogrammed data is of limited value. However, when crystal timing parameters are estimated jointly with an activity reconstruction of the tracer distribution, the absolute detector-pair sensitivities become increasingly important. In the latter case, we have observed that inaccuracies in detector-pair sensitivities can directly influence the Gaussian model fit. Therefore, to eliminate confounding effects due to inaccurate efficiencies, we jointly estimate not only the timing characteristics of the detector pairs, but also their efficiencies. Several self-normalization techniques already exist in the literature [18, 19]. Among most recent works, a relative crystal efficiency estimation is proposed in [20] for TOF-PET emission data from static scans that was later extended in [21] for the more novel continuous bed-motion acquisitions. These relative crystal efficiency estimates are then complemented by a global efficiency factor obtained from dedicated phantom measurements. In [22], a method is proposed which provides an absolute crystal efficiency estimation using single photon measurements as well as coincidence measurements on a TOF-PET scanner.
In this work, we propose a data-driven method to estimate the TOF model parameters (crystal efficiencies, timing offsets and timing resolutions) from the TOF-PET emission measurements. We treat the TOF-resolution as a feature that depends on the detector elements, and we also evaluate the effect of these model parameters on the performance of an algorithm for joint reconstruction of activity and attenuation. Similar to previous works [5], we use a crystal model to model timing shifts along a LOR. We further build on the crystal model and estimate the TOF resolution along a line of response as the hypotenuse of the two crystal timing resolutions, and relative LOR sensitivities as the product of two crystal efficiency factors. We analyze the effects of these crystal-based corrections on standard activity reconstructions as well as joint activity and attenuation reconstructions [23] using patient 18F-FDG brain scans. For this study, we have used high count brain scans, which enabled us to do the calibration and the evaluation of the reconstruction on the same data sets, which is convenient and ensures that the reconstructions are done with optimal calibration values. But since we find that the calibration results are fairly stable over time, the calibrations could instead be obtained from dedicated phantom scans. The paper is organized as follows: in section II an iterative maximum-likelihood algorithm is derived for the estimation of crystal timing offsets, timing resolutions and efficiencies. Section III describes the phantom and patient studies which we use to validate the method. The results of our studies are then shown in section IV and discussed in section V.
II. METHODS
We express the expected TOF-PET emission measurements for data-bin (ijt), where t is the TOF-bin and ij defines the line of response (LOR) connecting crystals i and j, as:
| (1) |
where, ψ are crystal-based properties, λ is the activity distribution, cijk is the sensitivity of LOR ij to voxel k, a and n are the attenuation and the detector-pair sensitivities, s and r are the expected scatter and randoms contributions, and g is the TOF-bin weight obtained after convolving the Gaussian TOF-kernel with the boxcar function of the TOF bin-width, which can be written in terms of the error function as:
| (2) |
where Tt is the center of TOF-bin t, is the signed distance of voxel k along LOR ij to the TOF-bin center, b is half the TOF bin-width, and Ω is the standard deviation of the Gaussian TOF-kernel along LOR ij.
Depending on which crystal property is considered, either gijkt or nij are a function of ψi and ψj in (1). The crystal properties considered here are the timing offset, the timing resolution and the detection efficiency. Introducing
| (3) |
the log-likelihood for emission tomography with an increment to the crystal-based properties δψ, can be expressed as:
| (4) |
| (5) |
| (6) |
where, j ↔ i defines crystals j that are in coincidence with crystal i. We assume that the required corrections δψ are small since we start from the vendor calibration. Therefore, we can assume that we are operating close to the maximum (or at least a local maximum) of the likelihood, where the likelihood can be assumed to be convex, which justifies (5). The last equation holds because LOR ij is identical to LOR ji.
Because L(ψ) = Q(ψ, 0) and L(ψ + δψ) ≥ Q(ψ, δψ), Q is a surrogate function of L, and maximizing Q as a function of δψ is guaranteed to increase L, unless L is already at a local maximum. Therefore, we assume that L can be maximized by iterative application of
| (7) |
| (8) |
where (m) is the iteration number. Because we don’t know if L is globally convex, it cannot be excluded that the obtained solution would correspond to a local maximum of L.
To maximize (6), we approximate it with a second order Taylor series expansion:
| (9) |
where,
and ᴪij is the property of the LOR associated with crystal properties ψi and ψj. Setting the first derivative of (9) with respect to δψ to zero and solving for the crystal-based increment, the update for the increment is:
| (10) |
A. Crystal Timing Offsets
We assume that a time offset ᴛi, relative to a global reference time, is associated to each crystal i, and that each individual LOR shift can be computed as the difference between the two corresponding crystal timing offsets1 as proposed in [3, 5, 9]:
| (11) |
where dij determines the direction assigned to the LOR: dij = 1 if the LOR direction is from i to j and equal to 1 otherwise. Inserting into (10), a time offset increment for crystal i is obtained by:
| (12) |
where gives the fansum (the summation over all LORs involving a particular crystal) of crystal i and . Details on the derivation can be found in appendix A.
Expression (12) corresponds to the first step (7) of the ML algorithm, the second step (8) for the crystal timing offsets is . With these new timing offsets, the expectation as well as its derivative are recomputed, using the updated timing offsets ᴛ(m+1). More information on the iterative algorithm is given in II-D.
B. Crystal Timing Resolutions
Assigning an effective crystal timing resolution ωi to each crystal i, we compute the TOF resolution along the LOR connecting crystal pairs by the hypotenuse of their crystal timing resolutions as:
| (13) |
Inserting in (10), we find the incremental timing resolution change for crystal i as:
| (14) |
where . See appendix A for details.
C. Crystal Efficiencies
We assume that the sensitivity nij is proportional to the detector pair efficiency2 Eij, and that a correction to the sensitivities is only needed because Eij may change over time, i.e. the other factors contributing to nij, such as geometry, remain constant. We model the efficiency of the detector pair as the product of the crystal efficiencies:
| (15) |
To estimate the crystal efficiencies with (7) – (8), we insert (15) in (10) and obtain:
| (16) |
where denotes the derivative of (1) with respect to nij.
D. Algorithm
An alternated optimization approach is proposed to estimate crystal properties (timing offset, timing resolution and efficiency) jointly with the reconstruction of the activity distribution. One set of variables is updated with all other variables of interest being fixed to their most recent estimates. In each iteration the algorithm updates:
the tracer distribution using the MLEM algorithm,
efficiency correction factors for all crystals using (16),
crystal timing resolutions using (14),
and the crystal timing shifts using (12).
In the case of listmode data, the crystal efficiencies, timing resolutions and timing offsets were updated using expressions (27), (26) and (25), given in appendix B, respectively. The algorithm can be accelerated using subsets in the usual way, i.e. from sinograms using in a single iteration only a subset of the projection angles or from listmode data using only a part of the measured events for reconstruction.
In order to avoid the scale problem when jointly estimating the activity distribution and detector-pair efficiencies, the estimated crystal efficiency factors were scaled after each update to have a median of 1. The median was chosen instead of the mean to limit the effect of outliers. Furthermore, the sum of crystal timing offsets was forced to zero, as we are only interested in differences between the crystal timing offsets. We should note that crystal timing properties (offsets and resolutions) can be estimated by comparing the measurements to TOF-projections of a non-TOF reconstruction of the tracer distribution. However, we used the TOF implementation of the MLEM algorithm mainly because of its desired robustness to inaccuracies of the attenuation and sensitivities [1].
III. EXPERIMENT DESIGN
In addition to a 3D simulation of the PET-SORTEO phantom [24], emission data were acquired from Hoffman brain phantom scans using the GE SIGNA TOF-PET/MR and the Siemens Biograph mCT TOF-PET/CT scanners. The reported TOF resolutions (prior to data rebinning) of the two scanners are 385.3 ps [8] and 527.5 ps [7] FWHM, respectively. Furthermore, the TOF-PET data are organized in 27 bins of 169 ps and 13 bins of 312 ps width, on the two scanners, respectively. For all datasets, crystal map estimates of timing offsets, timing resolutions3 and efficiency corrections were estimated jointly with a TOF-based reconstruction of the tracer activity distribution. In addition to phantom measurements, patient brain scans are collected from the two scanners as well as the GE Discovery MI TOF-PET/CT scanner with a reported TOF resolutions of 374.2 ps [25]. Following the estimation of the crystal maps, in addition to a reconstruction with all corrections applied, three activity images were reconstructed, each time ignoring one of the crystal-based corrections. This was not only done for regular MLEM activity reconstruction, but also for joint activity and attenuation reconstructions from the emission data using the MLAA algorithm [23] for the patient brain scans. Furthermore, MLAA was initialized with a uniform activity distribution and the CT-based attenuation image. In order to eliminate any confounding issues with the scale in joint estimation, the MLAA activity reconstruction was scaled to have the same total activity as the MLEM activity reconstruction in each update of the activity image.
A. Brain Simulation
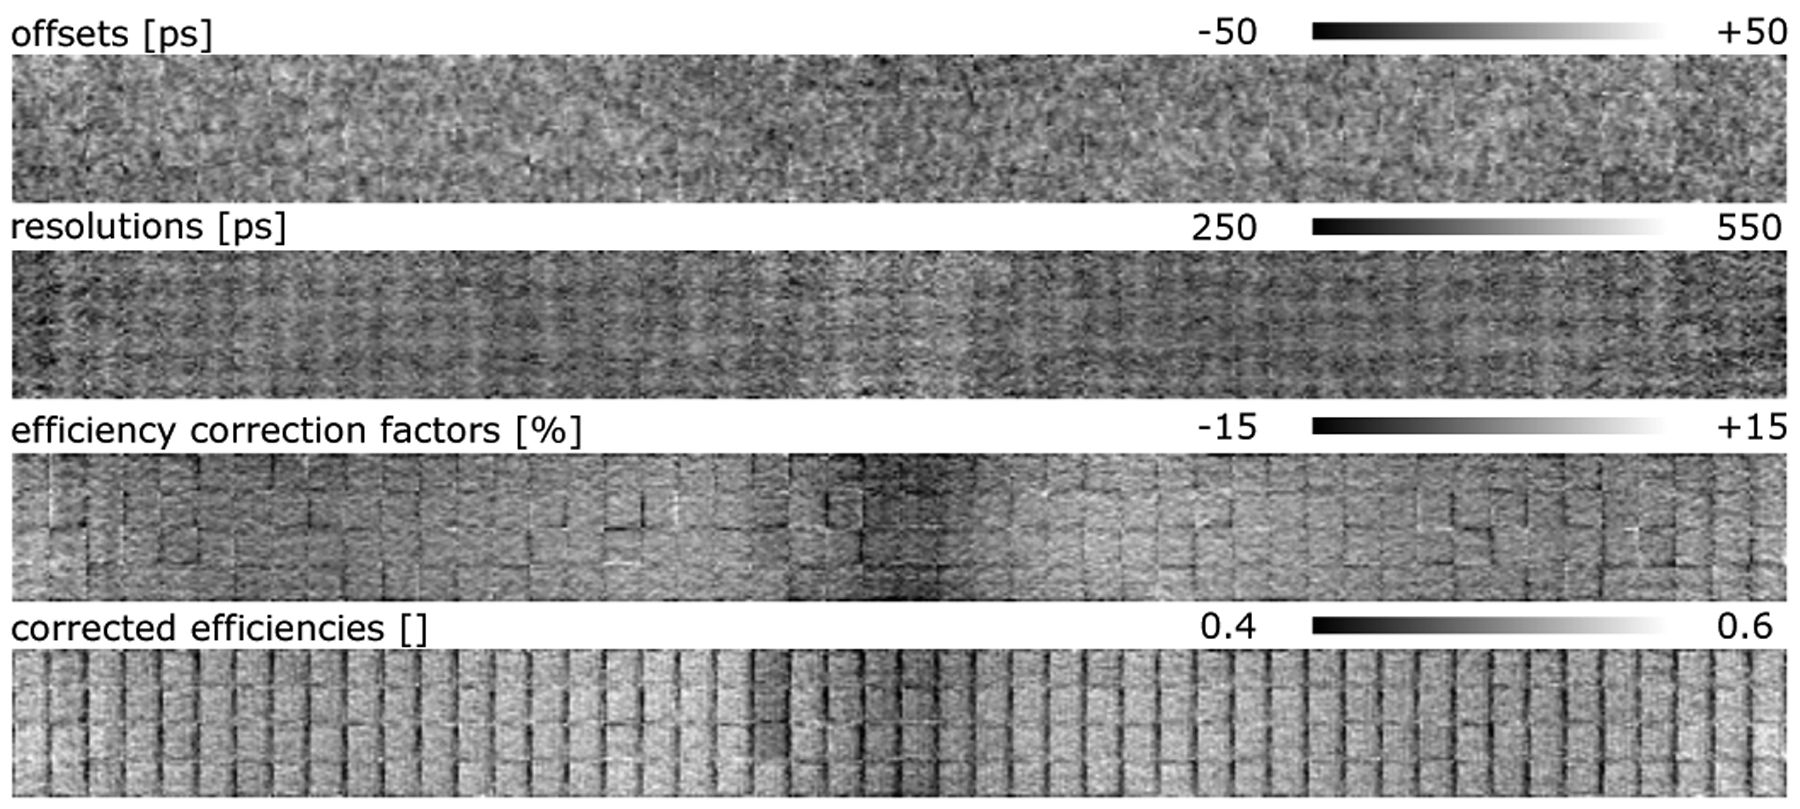
Using the SIGNA scanner geometry, emission data were simulated using the PET-SORTEO brain phantom at 5 noise levels. The simulation was done using an in-house distance driven ray tracing projector. The emission data were collected with crystal timing offsets and timing resolutions corresponding to crystal blocks sampled from a uniform distribution with simulated efficiencies of up to ±50% change, timing offsets of up to ±50 ps and up to ±10% of the crystal timing equivalent of the reported SIGNA TOF resolution, respectively. The simulated crystal efficiencies, timing offsets and timing resolutions are shown in figure 1a. The scanner has 45 rings with 448 crystals per ring. For the simulation, it was assumed that the crystals are grouped in modules of 16 × 5 sharing the same timing characteristics. The additive contribution of scatter was modelled by a Gaussian smoothing of the noiseless emission sinograms in the radial, angular, axial and TOF directions with a 12 cm, 0.43 rad, 12 cm and 9.4 cm FWHM, respectively. The simulated scatter estimate was scaled to obtain a scatter-to-primary ratio of 40%, and then added to the emission sinogram prior to adding Poisson noise to the measurements. For scatter correction, the exact noise-free scatter profile was used. We report on the joint estimation of crystal efficiencies, timing offsets and timing resolutions for 24 noise realizations obtained after 5 iterations with 14 subsets of the algorithm.
Fig. 1:

Results of the noise study on the simulated brain data.
B. GE SIGNA and Discovery MI Acquisitions
The Hoffman brain phantom and a patient were injected with 48 MBq and 144 MBq of 18F-FDG, respectively, and scanned for a duration of 20 minutes on the GE SIGNA PET/MR. The patient brain scan was acquired 1 hour post-injection. Low dose (11 mAs) CT images were obtained using a 16 slice Siemens HIREZ PET/CT scanner, aligned rigidly and used for attenuation correction. Additionally, a 15 minute acquisition of a patient brain scan injected with 155 MBq of 18F-FDG and scanned an hour post-injection on the GE Discovery MI PET/CT was also used for the crystal-based estimation. The GE PET Reconstruction Toolbox (v1.28) was used to pre-process the raw emission data, and the scatter contribution was estimated using the CT-based attenuation images. Crystal efficiencies, timing resolutions and timing offsets were computed jointly with the activity image applying 5 iterations and 14 subsets. The crystal maps were initialized with an efficiency map of all ones, resolution map of all ps and an offset map of all zeros. We should also mention that the vendor provided sensitivities were used during reconstructions, hence our estimated efficiencies are corrections of the sensitivities values produced by the system software. MLEM and MLAA activity reconstructions were then obtained using 3 iterations of 32 subsets, with the attenuation image being updated twice for every activity update in MLAA, with and without crystal corrections.
C. Siemens Biograph mCT Acquisitions
The Hoffman brain phantom was filled with 71 MBq of 18F-FDG, and scanned for a duration of 30 minutes with and without the typical axial mashing of the scanner, respectively. Crystal estimates were computed from listmode events with no mashing as well as from the emission sinogram with a span of 11 (which means that groups of up to 6 LORs are combined in a single measurement value [26]). Brain data were also acquired from a patient injected with 296 MBq of the 18F-FDG tracer and scanned for 5 minutes, 90 minutes post injection. The Siemens e7tools (VG60) were used to compute the expected randoms and scatter contribution of the emission data. Crystal properties (efficiency, timing resolution and timing offset) were then computed jointly with the tracer activity image after 5 iterations and 12 subsets4. An efficiency map of all ones, resolution map of all ps and an offset map of all zeros were used to initialize the algorithm. As before, the vendor provided sensitivities were incorporated, hence the algorithm estimates corrections to the expected detector-pair sensitivities. Subsequently, MLEM and MLAA activity reconstructions were obtained with and without crystal corrections after 3 iterations of 24 subsets, with a 3:1 attenuation to activity update ratio for MLAA.
IV. RESULTS
A. Brain Simulation
The noisiest 3D simulation had a total trues count of 112 M counts, which resulted in a mean crystal count of 5.6 K, respectively. A two fold increase of the mean crystal count (11.2 K (225 M), 22.2 K (447 M), 44.2 K (892 M) and 88.4 K (1.78 G) crystal (total) counts) was considered for the subsequent noise simulations. Figure 1 shows the results of our noise simulation study. Figure 1a shows the estimated crystal efficiencies, timing offsets and timing resolutions as well as a map of the standard deviation of these crystal properties for the 88.4 K mean crystal count emission data. The crystal standard deviations seem free of the simulated crystal timing offsets/resolutions patterns, and appear relatively uniform. A possible explanation for this observation might be that although the TOF sinogram counts can vary significantly for different data bins, the relative variation on the emission fansum is much less for different crystals.
Figure 1b plots the mean bias of the estimated crystal maps for all noise levels. As expected, a decrease of the standard deviation is observed for the estimated crystal maps with an increasing average crystal count. Interestingly, this improvement is more obvious for crystal timing resolutions compared to crystal timing offsets.
B. Phantom Studies
1). SIGNA Data:
The total coincident events count of the Hoffman phantom scan was 543.7 M counts, resulting in 53.9 K counts per crystal. Figure 2 shows maps of the estimated crystal timing offsets, timing resolutions and efficiency factors for the Hoffman brain phantom scanned on the SIGNA TOF-PET/MR. The crystal timing offsets estimate reveals an intriguing structure (darker and lighter regions in the crystal map) which, if not taken into account, can negatively influence the activity reconstruction. Using this timing offsets map a sinogram of TOF shifts was computed using (11), and the absolute mean (standard deviation) timing shift along all LORs was 15.7 ps (±12.0 ps). We find that, although these shifts seem small compared to the TOF resolution and the TOF-binning of the data, it is enough to cause observable differences in the emission reconstructions. The timing resolution map also shows some structure in the distribution of estimated timing resolutions, for which we currently have no explanation. The mean estimated crystal and LOR timing resolutions were 282.0 ps (±34.7 ps) and 400.4 ps (±34.0 ps), respectively. The estimated crystal efficiency factors±look uniform, except for crystals located beneath the patient bed (lighter region near the center of the efficiency correction map).
Fig. 2:

Crystal timing offsets, timing resolutions and efficiency correction factors estimated from the brain phantom scanned on the SIGNA TOF-PET/MR scanner. Crystal efficiencies are also shown after correcting the vendor provided efficiency map with the estimated efficiency correction factors.
2). Biograph mCT Data:
For this scan, each crystal had an average of 22.6 K counts per crystal for a total of 387.5 M counts of the emission data. Figure 3 shows the crystal maps of the crystal timing offsets, crystal timing resolutions and efficiency factors of the Hoffman brain phantom scanned on the Biograph mCT TOF-PET/CT. Figure 3a shows the results for emission data organized in a clinical setting with angular and axial (span 11) mashing of the measurements. Although the crystal map of the timing offsets seems less structured than that of the SIGNA, it still seems to be influenced by a low frequency component in the transaxial (horizontal) direction. For this study, the mean absolute timing shift along LORs was 12.5 ps (±9.8 ps). The crystal map of the timing resolutions also reveals some varying estimate of crystal TOF-resolutions. The mean of the crystal timing resolutions and their corresponding TOF resolutions along all LORs were 379.3 ps (±32.4 ps) and 536.8 ps (±22.2 ps), respectively. The map of the crystal efficiency factors seems uniform, except for two darker vertical streaks. In the initial CT-umap acquired for this scan, parts of the bed were missing. After a secondary scan of the bed, the bed was registered and added to the CT-umap manually. The darker streaks could suggest a small misalignment of the bed, which affects the sensitivities most at the two edges of the bed (high change of attenuation).
Fig. 3:

Crystal maps of timing offsets, timing resolutions and efficiency correction factors of the brain phantom scanned on the Biograph mCT TOF-PET/CT with (a) and without (b) angular/axial mashing of the emission data. Results without mashing of the data were estimated using the listmode expressions of the crystal maps (25), (26) and (27).
Figure 3b shows the results of the crystal maps estimated from listmode data of the same scan with no mashing of LORs. Although a different noise structure can be observed in the crystal timing offsets estimate, it reflects the same low frequency component in the transaxial direction. The mean absolute TOF shift along LORs was estimated to be 30.0 ps (±22.7 ps). Crystal timing maps with and without mashing are visually similar, however, as would be expected, a slightly better resolution was obtained for the crystal timing resolutions without mashing. In this case, the mean crystal timing and LOR resolutions were 376.1 ps (±33.1 ps) and 528.7 ps (± 35.2 ps), respectively. The crystal map of the efficiency correction factors reveals some axial information that was probably averaged away in the scan with axial mashing. When these corrections are applied to the system crystal efficiencies, the response of the crystal blocks becomes similar in axial and transaxial directions, with higher sensitivity in the center and reduced efficiency near the edges of the block.
C. Patient Studies
1). SIGNA Data:
The patient emission data had a total of 393.1 M counts, which is an average of 39.0 K counts per crystal. Figure 4 shows the crystal maps estimated from the patient brain scan. Compared to the crystal maps of the Hoffman phantom scan, a different structure is observed for the estimated crystal timing offsets. After careful chronological analysis of the emission measurements [27], we realized that multiple time calibration scans had been performed between the acquisition dates (9 months apart) of these two scans. The mean absolute TOF shifts along LORs was 21.4 ps (±15.7 ps), which is, although slightly higher than before, still in a similar range. The crystal timing resolutions estimated however reveal a striking pattern with a poor timing resolution for a small set of crystals (the five white spots in fig 4). This was due to the time tagging of events falling back onto a secondary/auxiliary timing mechanism with a slightly higher uncertainty. This higher timing uncertainty effectively degrades the timing resolutions for these crystals and the LORs which these crystals are in coincidence with (this problem has since been fixed, hence not present in the Hoffman phantom results). Ignoring the resolution of these crystals, the mean crystal timing resolutions was 289.4 ps (±38.7 ps), and the mean TOF-resolution along all LORs was 411.1 ps (±37.6 ps).
Fig. 4:

Estimated crystal maps of the timing offsets, timing resolutions and efficiency correction factors estimated from the patient scanned on the GE SIGNA. Crystal efficiencies are also shown after correction with the estimated factors.
Figure 5a shows a standard MLEM reconstruction with all the corrections applied together with difference images when each of the crystal map corrections are ignored. Ignoring each of the crystal map corrections affects the reconstructions differently and to varying extents. Comparison between activity reconstructions corrected for all crystal maps and all but timing offsets shows that this is the dominating (±7%) cause of artefacts. Interestingly, we observe the effect of the darker and brighter regions in the timing offsets crystal maps as a gradient in the direction of LORs connecting these crystals pairs.
Fig. 5:

Attenuation image (first column) and activity (second column) reconstruction with all the crystal map correction maps shown in figure 4 applied for the GE SIGNA patient data. Difference images (columns 3–5) are after each of the crystal map corrections (efficiency correction factors, timing offsets and timing resolutions, respectively) are ignored. MLEM/MLAA activity reconstructions with all crystal-based corrections applied was used as reference when generating the difference images. This figure was originally published in [27] ©SNMMI.
Figure 5b shows the MLAA attenuation and activity reconstruction when all crystal map corrections are applied together with difference images when one is ignored. The difference of MLAA attenuation reconstructions ignoring each of the crystal corrections are shown in appendix C. The effect and extent of each crystal map correction seems to be different for MLAA compared to MLEM. Since MLAA relies heavily on the accuracy of the TOF data/model, problems due to timing offsets and timing resolutions are magnified in the tracer activity reconstructions. Furthermore, since inaccuracies in crystal efficiencies can be absorbed in the estimated MLAA attenuation image, the activity images with and without correction for the crystal efficiency correction maps are less affected by possible inconsistencies in detector-pair sensitivities.
Table I reports on how the proposed corrections affect the similarity between the MLAA and MLEM activity reconstructions. As reference, the root mean square error (RMSE) of the two reconstructions when all corrections were applied was computed. Following this, normalized (to the reference) RMSEs were computed when one or all corrections were omitted. As also suggested by figure 5, the crystal timing offsets correction seems to have the dominating effect on the comparison of MLAA and MLEM reconstructions in this study.
TABLE I:
Root mean square errors (RMSEs) between the MLAA and MLEM activity reconstructions, caused by applying all/none or ignoring one of the crystal-based corrections. In all cases, RMSEs were computed excluding 1cm of the outer axial planes and normalized with the reference RMSE computed when all corrections were applied.
| all | no efficiencies | no offsets | no resolutions | none | |
|---|---|---|---|---|---|
| SIGNA | 1.000 | 1.281 | 2.344 | 1.015 | 2.534 |
| Discovery MI | 1.000 | 0.968 | 1.463 | 1.567 | 1.931 |
| Biograph Mct | 1.000 | 1.051 | 1.108 | 1.059 | 1.164 |
2). Discovery MI Data:
Figures 6 and 7 show the crystal maps estimated from the patient brain scan, and the following MLEM/MLAA activity reconstruction with and without corrections for each of the crystal maps. For this dataset, the mean absolute TOF shifts along LORs was 10.6 ps (±8.1 ps), which is lower than the values reported for the SIGNA acquired datasets. Comparison of figures 7 and 5 (as also seen in table I) shows that the most dominating cause of differences (compared to the reference reconstruction with all crystal-based corrections applied) is now the timing resolution correction as opposed to the timing offsets. Interestingly, higher mean crystal timing and TOF resolutions of 296.2 ps (±36.6 ps) and 420.5 ps (±36.4 ps) were measured for this dataset respectively, which also had a higher total emission count (acquired over a shorter scan period) of 433.0 M and a mean crystal count of 44.2 K.
Fig. 6:

Estimated crystal maps of the timing offsets, timing resolutions and efficiency correction factors estimated from the patient scanned on the GE Discovery MI. Crystal efficiencies are also shown after correction with the estimated factors.
Fig. 7:

Attenuation image (first column) and activity (second column) reconstruction with all the crystal map correction maps shown in figure 6 applied for the GE Discovery MI patient data. Difference images (columns 3–5) are after each of the crystal map corrections (efficiency correction factors, timing offsets and timing resolutions, respectively) are ignored. MLEM/MLAA activity reconstructions with all crystal-based corrections applied was used as reference when generating the difference images. Note that the difference images are shown in a narrower color table range compared to the results shown in figure 5.
3). Biograph mCT Data:
The fansum of the emission data had a total and average of 170.4 M and 9.9 K counts, respectively. Figure 8 shows the crystal maps estimated from the patient scanned on the Siemens mCT scanner. Visual inspection of the timing offsets crystal map does not reveal striking patterns/structures, and the timing resolutions crystal map shows varying timing accuracy of the different crystals. However, the efficiency correction factors show a decreased sensitivity in the central region of the crystal map. With a more detailed analysis of the data, we observed that parts of the CT-based attenuation of the head-holder were missing, hence this decrease in the crystal efficiencies. The mean absolute TOF shift along LORs was computed to be 10.9 ps (±8.7 ps) for this data set. The mean crystal timing and crystal-pair resolutions were 374.8 ps (±42.0 ps) and 530.5 ps (±25.6 ps), respectively.
Fig. 8:
Estimated crystal maps (timing offsets, timing resolutions and crystal correction factors) estimated from the patient scanned on the Siemens Biograph mCT scanner. Crystal efficiencies are also shown after correction with the estimated factors.
Figure 9a shows a standard MLEM reconstruction of the brain data acquired on the Biograph mCT with all the crystal map corrections applied. The difference images are after each of the crystal map corrections are ignored. As before, corrections for the different crystal maps affect the tracer distribution uptake to varying extents. Comparing differences due to the various crystal map corrections in activity reconstructions of MLEM and MLAA (shown in figure 9b), demonstrates again the sensitivity of MLAA reconstructions to the TOF model parameters. Table I shows that for this study the crystal timing offsets correction had the dominating effect on the similarity of MLAA and MLEM reconstructions. The MLAA attenuation reconstructions are shown in appendix C.
Fig. 9:

Attenuation image (first column) and activity (second column) reconstruction with all the crystal map corrections shown in figure 8 applied for the Siemens Biograph mCT patient data. Difference images (columns 3–5) are after each of the crystal map corrections (efficiency correction factors, timing offsets and timing resolutions, respectively) are ignored. MLEM/MLAA reconstructions were compared to the corresponding activity reconstruction with all crystal-based corrections applied.
V. DISCUSSION
With an improving time of flight resolution of clinically available TOF-PET scanners, related TOF scanner calibration becomes increasingly important. In this work, we propose a method to compute crystal based corrections by maximizing the log-likelihood for emission tomography as opposed to our earlier works minimizing the quadratic differences between the TOF emission data and our expectation of the measurements [14, 15], which resulted in a slight improvement more specifically for the crystal timing resolutions. Inspired by [5], we modelled TOF shifts along LORs as differences between crystal timing offsets, and likewise the TOF resolution along a LOR was modelled as the hypotenuse of the crystal timing resolutions in coincidence. Similar to [20, 22] additional efficiency correction factors were considered for each crystal. These crystal maps were then jointly estimated with the activity distribution in an alternated manner. We observed that with only a couple of iterations of the algorithms, the crystal map estimates reached a stable plateau. In the 3D simulation study, we found that the accuracy of the crystal timing resolutions highly (more so than crystal timing offsets) depends on the average count per crystal. In our experience, we find the crystal timing offsets to be more robust to residual inaccuracies in relative crystal efficiencies more so than the estimated crystal timing resolutions.
The crystal timing offset maps computed from the discovery MI emission data were more uniform and less structured compared to the crystal timing offset maps estimated from the SIGNA emission data. A reason for this observation could be the way these two scanners are calibrated. For the TOF-shift calibration, the Discovery MI PET/CT scanner determines the position of the calibration phantom with a reconstruction, whereas the MP 24 software release of the SIGNA PET/MR scanner relies on mechanical calibration to make the phantom position reproducible and therefore known. We believe that the observed TOF-shift corrections are compatible with a small position error of the calibration phantom. This problem has recently been solved by making the vendor calibration software insensitive to changes of the exact position of the phantom in the MP 26 software release of the SIGNA PET/MR scanner.
The results of the crystal/LOR timing resolutions as well as the crystal timing offsets are summarized in table II. Because of the observed discrepancy between the mean estimated and reported TOF resolutions, data were collected from a line-source measurement on the SIGNA PET/MR scanner. In agreement with [8], we obtained a TOF resolution of 390 ps, which is narrower than the resolutions we obtain from scans of larger phantoms and patients. We believe that more elaborate studies are warranted to characterize TOF resolution dependencies. When the crystal maps were estimated without the typical angular/axial mashing on the Biograph mCT scanner, the noise structure on the crystal offset maps changed, however, the low frequency component was still present. As expected, a slight improvement of the mean crystal timing and LOR resolutions was also observed. But most importantly, efficiency patterns/information in the axial direction which were otherwise averaged/lost were recovered. It should be noted that the reported standard deviations of the scanner TOF resolutions [7, 8, 25] address changes to the mean TOF resolution computed over multiple acquisitions. However, in our study we have taken the inter-crystal variabilities (due to e.g. scanner design) into account, and we report the crystal-based standard deviations computed from the mean crystal timing resolution. Figure 10 shows the crystal timing resolutions of the phantom measurements averaged over all blocks/modules for the SIGNA PET/MR and Biograph mCT scanners, respectively.
TABLE II:
Summary of the estimated crystal/LOR timing resolutions [ps] and absolute TOF shifts [ps] estimated in this study. The reported standard deviations of the LOR timing resolutions [7, 8, 25] (indicated by an asterisk) address changes to the mean timing resolution computed over multiple acquisitions. The other standard deviations report the variation over the crystals.
| mCT | SIGNA | Discovery MI | |||||||
|---|---|---|---|---|---|---|---|---|---|
| crystal res. | LOR res. | offsets | crystal res. | LOR res. | offsets | crystal res. | LOR res. | offsets | |
| Reported | 527.5 (4.9*) | 385.3 (0.0*) | 374.2 (2.6*) | ||||||
| phantom scans | 376.1 (33.1) | 528.7 (35.2) | 30.0 (22.7) | 282.0 (34.7) | 400.4 (34.0) | 15.7 (12.0) | |||
| (data mashing) | 379.3 (32.4) | 536.8 (22.2) | 12.5 (9.8) | ||||||
| patient scans | 374.8 (42.0) | 530.5 (25.6) | 10.9 (8.7) | 289.4 (38.7) | 411.1 (37.6) | 21.4 (15.7) | 296.2 (36.6) | 420.5 (36.4) | 10.6 (8.1) |
Fig. 10:

Crystal timing resolutions averaged over all blocks/modules for the SIGNA PET/MR (left) and Biograph mCT (right) scanners estimated from the Hoffman brain phantom measurements. The red curves are schematic representations of the SiPMs/PMTs sitting on the scintillating crystals.
We find that correction for crystal timing offsets, timing resolutions and efficiency factors have a varying level of effect on standard MLEM activity reconstructions. However, as previously observed, we find that in presence of modelling errors and/or data inconsistencies, MLAA and MLEM converge to different solutions. MLAA is found to be more sensitive to timing but less to efficiency calibration errors. We believe that this is because MLEM and MLAA have different degrees of freedom (while MLEM reconstructs only the activity, MLAA reconstructs an activity and attenuation pair) to explain the emission measurements. Although this complicates the validation of MLAA using MLEM reconstructions as reference [17], it also provides an opportunity to identify modelling or data correction inaccuracies. Our study of crystal timing properties was highly motivated by these observations.
As shown in table I, with all corrections applied, MLAA activity reconstructions became more comparable to the gold-standard MLEM reconstruction. A similar behaviour was also reported in [17] where, as indirect evidence of the improvements, the homogeneity of a phantom uniformly filled with the 18F-FDG tracer improves with all crystal-based corrections applied. Figure 11 shows difference images between MLAA and MLEM activity reconstructions when all the corrections were applied for all patient brain data scanned on the three scanners. Although a varying level of accuracy is observed for the MLAA tracer reconstructions compared to MLEM with CT-based attenuation correction for the different scanners, they are all within 4% accuracy of the gold-standard reconstructions. We should have in mind that there are several fundamental differences between these scanners and also the way the emission data are stored/organized which could contribute to this observation. First, the SIGNA and the discovery MI scanners have a better TOF resolution compared to the Biograph mCT scanner, so a slightly better reconstruction would be expected for the reconstruction of a similar extent (size of a typical head) of tracer distribution. Second, the Biograph mCT scanner typically stores the emission sinogram with angular and axial mashing of the emission data. This mashing can have an effect on the TOF kernel shape and the effective TOF resolution, but more importantly violates the assumption that these lines of response are affected similarly by the attenuation medium. The study of the effect of different mashing schemes on the activity reconstructions of MLAA is however outside the scope of this manuscript and is left for future studies.
Fig. 11:

Differences between MLAA and MLEM activity reconstructions as well as MLAA attenuation reconstructions and the CT-based umaps with all crystal map corrections applied for the patient data scanned on the GE Discovery MI (left), GE SIGNA (center) and the Siemens Biograph mCT (right) scanners.
We have proposed a method to estimate the crystal timing properties and crystal efficiencies from TOF-PET patient data. This approach avoids any data inconsistencies due to the dependence of these parameters on time or on the object, i.e. the tracer distribution, inside the scanner. Applying our method, we found that the crystal timing offsets appear to be stable between calibrations [27], but there is an object dependency on the mean estimated crystal timing resolution. Accounting for changes to the mean TOF resolutions in a multi bed-position whole-body 18F-FDG patient scan (90s acquisitions per bed-position), a better agreement was reported between joint and standard tracer activity reconstructions [15]. The proposed method requires sufficiently high data statistics for good accuracy of the crystal estimates. Although this is currently not provided by all clinical PET acquisition protocols, we have demonstrated that crystal based corrections can be reliably computed from long clinical brain scans. In addition, since the crystal timing properties vary only slowly over time [27], they can very well be determined from a collection of shorter acquisitions, which enabled us to apply the method successfully to a whole body acquisition scans with 90 s per bed position [15]. Furthermore, for the estimation of crystal timing resolutions, the observed structure in the crystal timing maps (figure 10) could be additionally used to regularize and to facilitate the estimation from emission data with low count statistics. Finally, the absolute sensitivity and the TOF resolution of the scanners continue to improve, which should reduce the PET scan times needed for the method to become effective and therefore increase its applicability. Since at this time, our method is not expected to be effective for all possible TOF-PET studies, there is still a need for dedicated calibration scans. Our current results indicate that at least some of the parameters depend on the object being scanned, hence our method could be used to validate calibration phantom designs by comparing the calibration results to those obtained from clinical studies. In addition to the proposed approach being utilized as a refinement technique in cases where crystal-based corrections are suboptimal, it can also be used to reduce the number of different calibration scans, since it enables estimation of the timing resolutions, timing offsets and efficiencies of all detector pairs from a single scan.
VI. CONCLUSION
A method is proposed to compute TOF shifts, TOF resolutions and crystal-pair sensitivities from TOF-PET emission data. For practical reasons, these parameters were estimated using a crystal model. For each line of response, the TOF shifts, TOF resolutions and sensitivity factors were computed as the difference in crystal timing offsets, hypotenuse of crystal timing resolutions and the product of crystal efficiency factors in coincidence, respectively. These additional corrections allowed us to better model the TOF-PET emission data during reconstruction, and improve the tracer distribution of standard MLEM reconstructions as well as joint reconstructions of activity and attenuation in MLAA. We observed that ignoring each of these correction factors adversely affects reconstructions to different extents, but most importantly, a more accurate timing calibration seemed crucial for TOF-based joint reconstruction methods. Our current estimation method requires relatively high data statistics and may not be effective on low count scans. Current results indicate that except for the mean TOF resolution, the crystal timing properties are stable over time, implying that calibration estimates obtained with well designed phantoms can be used.
ACKNOWLEDGEMENT
This work was supported by the Research Foundation Flanders (FWO) postdoctoral project 12T7118N and in part by the FWO project G.0275.14N. Georg Schramm has been supported by NIH under the NIH P41 EB017183 grant. The authors would like to thank Floris Jansen, Sangtae Ahn, Timothy Deller and Kristen Wangerin from GE Healthcare, and Michael Casey, Vladimir Panin and Judson Jones from Siemens for their help and support. We would also like to thank Johannes Heemskerk from VUB and Stefaan Vandenberghe from UGent for their help with the Hoffman phantom scan, and Michel Defrise for the very insightful discussions. A spacial thanks also goes to David Freese who at NSS/MIC 2017 suggested using a crystal-based model for estimating the TOF resolution.
APPENDIX A
The explicit definitions used in updates (12), (14) and (16) are as follows:
| (17) |
| (18) |
| (19) |
| (20) |
with . Expression (20) is obtained by assuming .
In the case of crystal timing offsets and resolutions, is the projection of the activity image λ with the derivative of the TOF-weights (2) w.r.t. the timing offsets and resolutions, respectively:
| (21) |
where,
In the case of crystal efficiencies and since they are absorbed in the detector-pair sensitivities n, which could also include e.g. geometric sensitivities, deadtime correction, etc, .
Finally, the derivatives of detector-pair corrections (11), (13) and (15) to crystal timing offsets, resolutions and efficiencies at crystal i are:
| (22) |
| (23) |
| (24) |
APPENDIX B
Expressions for the crystal timing offsets (12), timing resolutions (14) and efficiencies (16) need to be adapted for estimation using listmode emission data. In this case the crystal timing offsets, timing resolution and efficiency expressions are modified as:
| (25) |
| (26) |
| (27) |
where m is the listmode event index and the subscript ijtm denotes the crystals i and j and TOF-bin t which are associated with listmode event m. Note that is evaluated twice, once at the measured event (ijtm) and once for all possible data bins (ijt).
APPENDIX C
Figure 12 is shown to give an idea of the MLAA attenuation reconstructions for the patient brain scan data and the effect of the different crystal map corrections on the final reconstructions. Figure 12a shows the MLAA attenuation reconstructions when all crystal map corrections are applied together with difference images when one is ignored for the SIGNA patient brain data. Likewise, figures 12b and 12c show the results for the patient brain data scanned on the Discovery MI and the Biograph mCT, respectively. In figures 12a and 12c, inaccuracies in the timing offsets seem to have the dominating effect on the final attenuation reconstruction where as for figure 12b the differences are most pronounced when the additional correction for the crystal timing resolutions is ignored.
Fig. 12:

MLAA attenuation reconstructions when all crystal map corrections are applied (left) together with difference images when one (efficiency correction factors, timing offsets and timing resolutions, respectively) is ignored for the patient brain data.
Footnotes
Throughout the text, “offsets” will refer to the difference in the crystal arrival time to a global time point. A “shift” always refers to a LOR which is computed as the difference of crystal-pair offsets.
Throughout the text we will use efficiency as a crystal attribute, and sensitivity as an attribute for a LOR.
All estimated/reported timing resolutions are without the additional TOF-bin sampling since our implementation of the TOF projector applies the additional TOF bin-width convolution intrinsically.
With listmode data, subsets were applied on all possible lines of response instead of the measured events. The listmode expressions for crystal timing offsets, timing resolutions and efficiencies are given in appendix B.
REFERENCES
- [1].Conti Maurizio. “Why Is TOF PET Reconstruction a More Robust Method in the Presence of Inconsistent Data?” Phys. Med. Biol 56.1 (Jan. 2011), pp. 155–68. [DOI] [PubMed] [Google Scholar]
- [2].Defrise Michel, Rezaei Ahmadreza, and Nuyts Johan. “Time-of-Flight PET Data Determine the Attenuation Sinogram up to a Constant.” Phys. Med. Biol 57.4 (Feb. 2012), pp. 885–99. [DOI] [PubMed] [Google Scholar]
- [3].Perkins AE, Werner M, Kuhn A, Surti S, Muehllehner G, and Karp JS. “Time of Flight Coincidence Timing Calibration Techniques Using Radioactive Sources”. IEEE Nuclear Science Symposium Conference Record, 2005 Vol. 5 Oct. 2005, pp. 2488–2491. [Google Scholar]
- [4].Rothfuss H, Moor A, Young J, Panin V, and Hayden C. “Time Alignment of Time of Flight Positron Emission Tomography Using the Background Activity of LSO”. 2013 IEEE Nuclear Science Symposium and Medical Imaging Conference Oct. 2013, pp. 1–3. [Google Scholar]
- [5].Werner ME and Karp JS. “TOF PET Offset Calibration from Clinical Data”. en. Physics in Medicine and Biology 58.12 (2013), p. 4031. [DOI] [PMC free article] [PubMed] [Google Scholar]
- [6].Defrise Michel, Rezaei Ahmadreza, and Nuyts Johan. “Time-of-Flight PET Time Calibration Using Data Consistency”. en. Physics in Medicine & Biology 63.10 (May 2018), p. 105006. [DOI] [PubMed] [Google Scholar]
- [7].Jakoby BW, Bercier Y, Conti Maurizio, Casey Michael E., Bendriem Bernard, and Townsend DW. “Physical and Clinical Performance of the mCT Time-of-Flight PET/CT Scanner.” Phys. Med. Biol 56.8 (Apr. 2011), pp. 2375–89. [DOI] [PubMed] [Google Scholar]
- [8].Levin CS, Maramraju SH, Khalighi MM, Deller TW, Delso G, and Jansen F. “Design Features and Mutual Compatibility Studies of the Time-of-Flight PET Capable GE SIGNA PET/MR System”. IEEE Transactions on Medical Imaging 35.8 (Aug. 2016), pp. 1907–1914. [DOI] [PubMed] [Google Scholar]
- [9].Thompson CJ, Camborde M, and Casey ME. “A Central Positron Source to Perform the Timing Alignment of Detectors in a PET Scanner”. IEEE Transactions on Nuclear Science 52.5 (Oct. 2005), pp. 1300–1304. [Google Scholar]
- [10].Vandenberghe S, Mikhaylova E, D’Hoe E, Mollet P, and Karp JS. “Recent Developments in Time-of-Flight PET” en. EJNMMI Physics 3.1 (Dec. 2016), p. 3. [DOI] [PMC free article] [PubMed] [Google Scholar]
- [11].Daube-Witherspoon ME, Surti S, Matej S, Werner M, Jayanthi S, and Karp JS. “Influence of Time-of-Flight Kernel Accuracy in TOF-PET Reconstruction”. 2006 IEEE Nuclear Science Symposium Conference Record Vol. 3 Oct. 2006, pp. 1723–1727. [Google Scholar]
- [12].Vunckx K, Zhou L, Matej S, Defrise M, and Nuyts J. “Fisher Information-Based Evaluation of Image Quality for Time-of-Flight PET”. IEEE Transactions on Medical Imaging 29.2 (Feb. 2010), pp. 311–321. [DOI] [PMC free article] [PubMed] [Google Scholar]
- [13].Berker Yannick and Li Yusheng. “Attenuation Correction in Emission Tomography Using the Emission Data - A Review”. Med. Phys 807 (2016). [DOI] [PMC free article] [PubMed] [Google Scholar]
- [14].Rezaei A, Schramm G, Van Laere K, and Nuyts J. “Data Driven Time Alignment for TOF-PET”. 2017 IEEE Nuclear Science Symposium and Medical Imaging Conference (NSS/MIC) Oct. 2017, pp. 1–3. [Google Scholar]
- [15].Rezaei Ahmadreza, Schramm Georg, Van Laere Koen, and Nuyts Johan. “Estimation of Crystal Timings in TOF-PET”. 2018 IEEE Nuclear Science Symposium and Medical Imaging Conference (NSS/MIC) Nov. 2018. [Google Scholar]
- [16].Zhu W, Feng T, Dong Y, Bao J, and Li H. “A Systematic Study on Factors Influencing the Accuracy of MLAA”. 2017 IEEE Nuclear Science Symposium and Medical Imaging Conference (NSS/MIC) Oct. 2017, pp. 1–3. [Google Scholar]
- [17].Nuyts J, Rezaei A, and Defrise M. “The Validation Problem of Joint Emission/Transmission Reconstruction from TOF-PET Projections”. IEEE Transactions on Radiation and Plasma Medical Sciences 2.4 (July 2018), pp. 273–278. [Google Scholar]
- [18].Badawi RD and Marsden PK. “Self-Normalization of Emission Data in 3D PET”. IEEE Transactions on Nuclear Science 46.3 (June 1999), pp. 709–712. [Google Scholar]
- [19].Baghaei H, Zhang Yuxuan, Yan Han, and Wong Wai-Hoi. “Evaluation of a Self-Normalization Method for Two PET Cameras Using Prompt, Delay or Total Emission Data”. 2014 IEEE Nuclear Science Symposium and Medical Imaging Conference (NSS/MIC) Nov. 2014, pp. 1–5. [Google Scholar]
- [20].Panin Vladimir Y.. “Simultaneous Activity and Crystal Efficiencies Reconstruction : TOF Patient-Based Detector Quality Control”. 2014 IEEE Nuclear Science Symposium and Medical Imaging Conference 2014. [Google Scholar]
- [21].Panin VY. “Simultaneous Activity and Crystal Efficiencies Reconstruction for Continuous Motion Bed Acquisition”. 2016 IEEE Nuclear Science Symposium and Medical Imaging Conference Oct. 2016, pp. 1–5. [Google Scholar]
- [22].Salomon A, Goldschmidt B, Botnar R, Kiessling F, and Schulz V. “A Self-Normalization Reconstruction Technique for PET Scans Using the Positron Emission Data”. IEEE Transactions on Medical Imaging 31.12 (Dec. 2012), pp. 2234–2240. [DOI] [PubMed] [Google Scholar]
- [23].Rezaei Ahmadreza, Defrise Michel, Bal Girish, Michel Christian, Conti Maurizio, Watson Charles, and Nuyts Johan. “Simultaneous Reconstruction of Activity and Attenuation in Time-of-Flight PET.” IEEE Trans. Med. Imaging 31.12 (Dec. 2012), pp. 2224–33. [DOI] [PubMed] [Google Scholar]
- [24].Reilhac A, Batan G, Michel C, Grova C, Tohka J, Collins DL, Costes N, and Evans AC. “PET-SORTEO: Validation and Development of Database of Simulated PET Volumes”. IEEE Transactions on Nuclear Science 52.5 (Oct. 2005), pp. 1321–1328. [Google Scholar]
- [25].Hsu David F. C., Ilan Ezgi, Peterson William T., Uribe Jorge, Lubberink Mark, and Levin Craig S.. “Studies of a Next-Generation Silicon-Photomultiplier-Based Time-of-Flight PET/CT System”. en. Journal of Nuclear Medicine 58.9 (Jan. 2017), pp. 1511–1518. [DOI] [PubMed] [Google Scholar]
- [26].Bruckbauer T, Wienhard K, Hansen SB, Eriksson L, Blomquist G, Dahlbom M, and Casey M. “Evaluation of the ECAT EXCAT HR with ACSII for Clinical Routine 3D Measurements”. 1995 IEEE Nuclear Science Symposium and Medical Imaging Conference Record Vol. 3 Oct. 1995, 1378–1382 vol.3. [Google Scholar]
- [27].Rezaei Ahmadreza, Schramm Georg, Stefanie MA Willekens Gaspar Delso, Van Laere Koen, and Nuyts Johan. “A Quantitative Evaluation of Joint Activity and Attenuation Reconstruction in TOF-PET/MR Brain Imaging”. en. Journal of Nuclear Medicine (Apr. 2019), jnumed.118.220871. [DOI] [PMC free article] [PubMed] [Google Scholar]