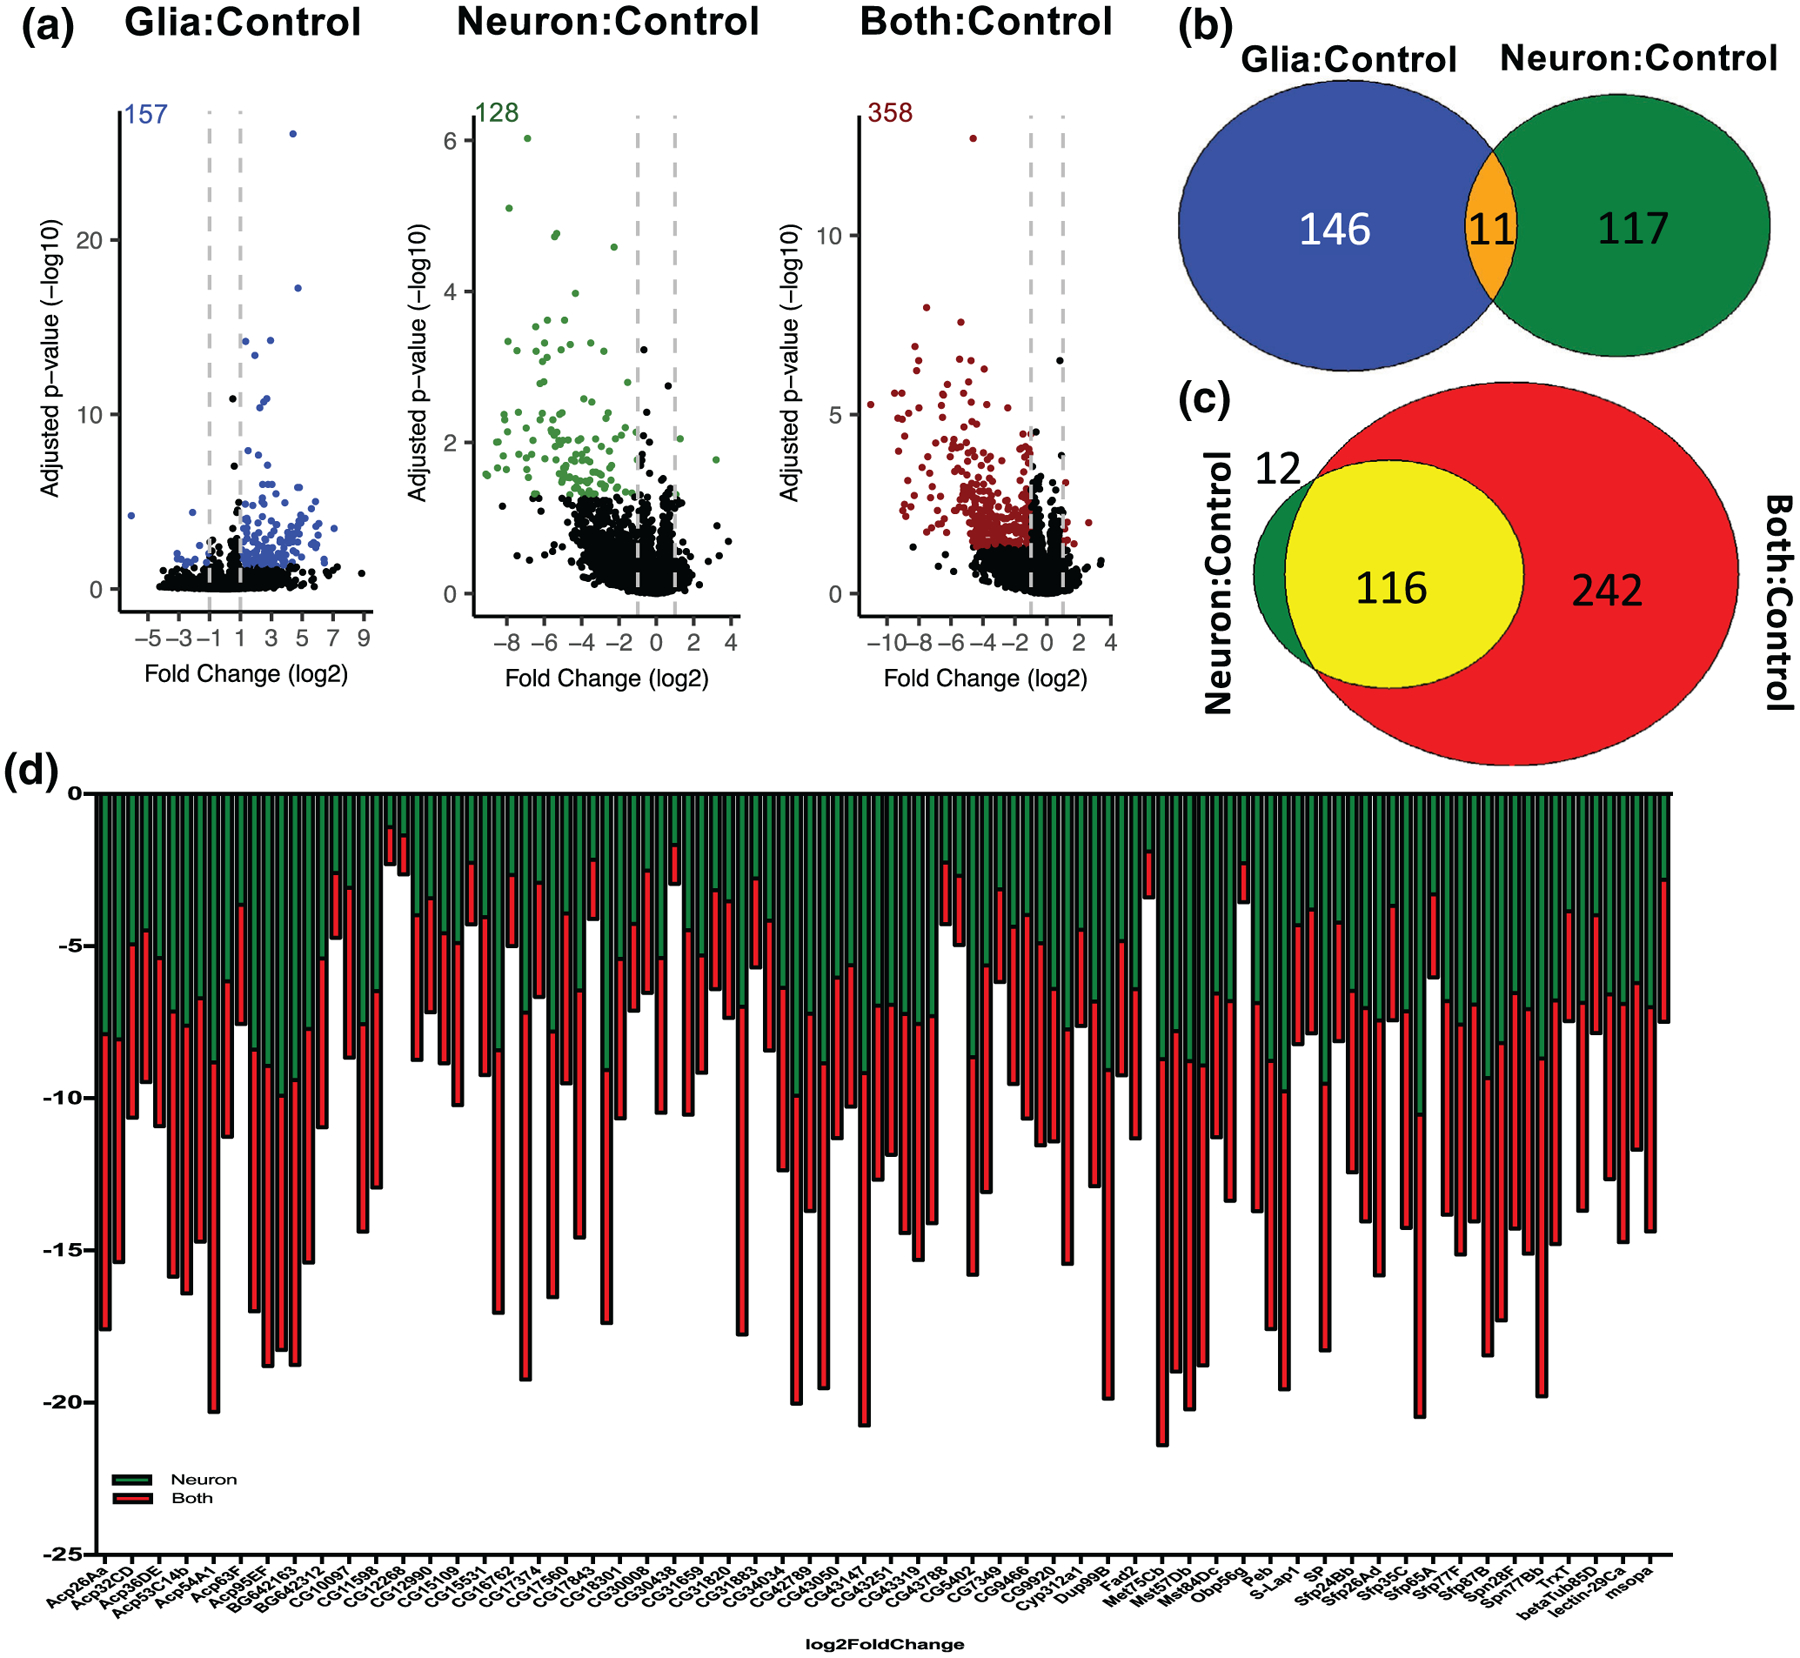
FIGURE 5.

Transcriptional changes induced by α-synuclein depend on its cellular context. Bulk RNA-Seq from whole brains was performed on 10-day old flies. (a) Volcano plots demonstrating transcript expression changes. Colored dots (and numbers) represent statistically significant (padjust < .05 after correction for multiple comparisons) differentially expressed transcripts with ≥|1| log2fold change. (b) Venn diagram demonstrating little overlap between differentially expressed genes induced by glial and neuronal α-synuclein. (c) Venn diagram demonstrating significant similarity in differentially expressed genes with both glial and neuronal α-synuclein compared to neuronal α-synuclein alone. (d) When both glial and neuronal α-synuclein are present a common set of transcripts are further downregulated as compared to neuronal α-synuclein alone
