

Abstract
3-Mercaptopyruvate sulfur transferase (MPST) catalyzes the desulfuration of 3-mercaptopyruvate (3-MP) and transfers sulfane sulfur from an enzyme-bound persulfide intermediate to thiophilic acceptors such as thioredoxin and cysteine. Hydrogen sulfide (H2S), a signaling molecule implicated in many physiological processes, can be released from the persulfide product of the MPST reaction. Two splice variants of MPST, differing by 20 amino acids at the N terminus, give rise to the cytosolic MPST1 and mitochondrial MPST2 isoforms. Here, we characterized the poorly-studied MPST1 variant and demonstrated that substitutions in its Ser–His–Asp triad, proposed to serve a general acid–base role, minimally affect catalytic activity. We estimated the 3-MP concentration in murine liver, kidney, and brain tissues, finding that it ranges from 0.4 μmol·kg−1 in brain to 1.4 μmol·kg−1 in kidney. We also show that N-acetylcysteine, a widely-used antioxidant, is a poor substrate for MPST and is unlikely to function as a thiophilic acceptor. Thioredoxin exhibits substrate inhibition, increasing the KM for 3-MP ∼15-fold compared with other sulfur acceptors. Kinetic simulations at physiologically-relevant substrate concentrations predicted that the proportion of sulfur transfer to thioredoxin increases ∼3.5-fold as its concentration decreases from 10 to 1 μm, whereas the total MPST reaction rate increases ∼7-fold. The simulations also predicted that cysteine is a quantitatively-significant sulfane sulfur acceptor, revealing MPST's potential to generate low-molecular-weight persulfides. We conclude that the MPST1 and MPST2 isoforms are kinetically indistinguishable and that thioredoxin modulates the MPST-catalyzed reaction in a physiologically-relevant concentration range.
Keywords: hydrogen sulfide, thioredoxin, allosteric regulation, enzyme kinetics, oxidation-reduction (redox)
Introduction
A toxin for higher organisms and a nutrient for some Bacteria and Archaea, hydrogen sulfide (H2S)3 is a product of mammalian sulfur metabolism (1–3). The steady-state levels of H2S are estimated to range from 10 to 30 nm in mammalian cells and tissues (4–6). Two enzymes, cystathionine β-synthase and γ-cystathionase, catalyze H2S elimination from the sulfur-containing amino acids, cysteine and homocysteine (1, 7). In contrast, 3-mercaptopyruvate sulfur transferase (MPST) catalyzes the desulfuration of 3-mercaptopyruvate (3-MP) forming pyruvate and a persulfide product from which H2S can be eliminated (7–10). Detailed kinetic analyses of cystathionine β-synthase (8) and γ-cystathionase (9) have provided estimates of their relative contributions to H2S-generation in mammalian tissues (11). In contrast, a similar assessment of MPST has been precluded by the following: (i) the absence of a complete kinetic dataset on mammalian MPSTs, which are commonly assayed at high pH (maximal activity is at pH 10.5) and with nonphysiological substrates (12, 13), and (ii) a lack of information on the intracellular 3-MP concentration. We report a detailed kinetic analysis of the mitochondrial form of recombinant human MPST at physiological pH (10), but a similar analysis of the cytoplasmic variant, discussed below, has been lacking.
MPST (also designated as MST and TUM1 for thiouridine modification protein 1) is implicated not only in cysteine catabolism but also in the thiolation of cytosolic tRNA (12). Two splice variants of human MPST, which differ by a 20-amino acid N-terminal extension immediately upstream of a mitochondrial targeting sequence, have been described (Fig. 1A) (12). The longer variant, hereafter designated as MPST1, is localized exclusively in the cytoplasm, whereas the shorter MPST2 variant has been detected in the cytoplasm and in mitochondria. Cleavage of the N-terminal mitochondrial targeting sequence results in MPST2 being ∼45 residues shorter than MPST1. The two MPST isoforms reportedly exhibit very similar kinetic parameters in the presence of the nonphysiological acceptors, cyanide and DTT, at the pH optimum of 10.5 (12).
Figure 1.

Organization and reaction catalyzed by MPST. A, organization of the MPST1 and MPST2 protein, which differs by a 20-amino acid sequence immediately upstream of the mitochondrial targeting sequence (MTS). B, reaction catalyzed by MPST in which the sulfur from 3-MP is successively transferred via MPST to Trx before being released as H2S. Trx is then recycled via Trx reductase (TrxR) and NADPH. 3-MP is the product of a transamination reaction catalyzed by GOT. C, 10% SDS-polyacrylamide gel analysis of purified recombinant human MPST1 and MPST2. An equal amount of protein (1 μg) was loaded per lane and visualized by staining with Coomassie Blue. The calculated molecular masses of recombinant human MPST1 and MPST2 with a thrombin-cleavable His6 tag are 37,182 and 33,549 Da, respectively. The sizes of the molecular mass standards are indicated.
MPST belongs to the rhodanese superfamily whose members contain one to four rhodanese-like domains (14). Human MPST has two rhodanese-like domains, and Cys268/Cys248 in the C-terminal domain of MPST1/MPST2 serves as the persulfide carrier (10). 3-MP is derived via transamination of cysteine and α-ketoglutarate catalyzed by glutamine oxoglutarate transaminase (GOT, Fig. 1B) involved in the malate-aspartate shuttle, which also has cysteine oxoglutarate transaminase activity.
The reaction catalyzed by MPST comprises two successive sulfur transfer steps (Fig. 1B). In the first half-reaction, the sulfur atom is transferred from 3-MP to MPST, resulting in a cysteine persulfide intermediate in the active site. The crystal structure of MPST2 revealed that the outer sulfur in the Cys248–SS− intermediate is encircled by the signature active-site hexapeptide loop (Cys248–Gly–Ser250–Gly–Val–Thr) and stabilized via electrostatic interactions with four backbone amides (Fig. 2A) (10). Cysteine residues on analogous active–site loops are found in other sulfur transferases, e.g. rhodanese (15), TSTD1 (16), and PRF (17). Sequence differences in the cysteine–bearing active–site loop are important determinants of substrate specificity as demonstrated by mutagenesis studies (18). Ser250 within the MPST2 loop is part of a triad comprising His74 and Asp63 (Fig. 2A), speculated to be important for general acid–base catalysis as discussed below (19). In the second half-reaction, the sulfane sulfur is transferred to a thiophilic acceptor resulting in regeneration of the resting enzyme and a new persulfide product from which H2S can be liberated.
Figure 2.

MPST active site architecture and postulated reaction mechanism. A, structures of apo-MPST (left, PDB code 3OLH) and with pyruvate (Pyr) and a cysteine persulfide (right, PDB code 4JGT). Cys248–SSH is stabilized by the active-site hexapeptide loop (Cys248); the Ser250–His74–Asp63 catalytic triad is shown. B, postulated reaction mechanism for S0 transfer in which the catalytic triad plays a key role, versus SH transfer in which the catalytic triad is not essential.
The “catalytic triad” present in the MPST-active site is absent in the homologous rhodanese sulfurtransferase. Ser250 in the triad is postulated to polarize the carbonyl group of 3-MP to enhance its electrophilicity (19). However, a different role was ascribed to Ser250 based on a QM/MM study, i.e. that the triad plays a key acid–base role in the catalytic mechanism. Based on the estimated free energy changes for two chemically-distinct pathways for sulfur transfer from 3-MP to Cys248 (20), it was concluded that the energetically-preferred pathway involves deprotonation of the 3-MP thiol by the catalytic triad followed by S0 transfer from the 3-MP thiolate to Cys248 (Fig. 2B, top). In the alternative SH-transfer pathway (Fig. 2B, bottom), the free energy changes for a concerted sulfur and proton transfer step were computed to be unfavorable with a single high-energy barrier. In this second SH transfer mechanism, Ser250 was predicted to play a minor role. Human MPST2 was crystallized with a mixed disulfide species between Cys248 and 3-MP, i.e. Cys248–S–S–3-MP (10), corresponding to the postulated transition state in the sulfur transfer mechanism (Fig. 2B, upper), making this pathway unlikely. The Cys248–S–S–3-MP mixed disulfide species was instead proposed to form in crystallo via a side reaction between the Cys248–SS− intermediate and a second equivalent of 3-MP.
The steady-state kinetic analysis of H2S synthesis by MPST1 in the presence of physiological acceptors has not been described. For MPST2, the specificity constant for the acceptors (kcat/KM(Acc)) decreased 5 × 10⁴-fold in the order thioredoxin ≫ dihydrolipoic acid (DHLA) > cysteine > homocysteine > glutathione (GSH) (10). In some protozoans, MPST is fused to thioredoxin (21, 22), suggesting that it might be the physiologically-relevant sulfane sulfur acceptor in higher organisms as well.
N-Acetylcysteine (NAC), widely used as a cysteine precursor, was recently reported as an alternative acceptor of MPST, exhibiting a 1.3-fold higher catalytic efficiency than cysteine (23). Furthermore, the antioxidant activity of NAC was attributed to MPST-dependent synthesis of H2S followed by its oxidation to sulfane sulfur species via the mitochondrial sulfide oxidation pathway (24), inducing an oxidative shift in mitochondria but not in the cytoplasm. The wide use of NAC as an antioxidant emphasizes the importance of evaluating the kinetic efficiency and thereby the feasibility of NAC serving as a thiophilic acceptor in the MPST reaction. Alternatively, NAC could support MPST activity by serving as a source of cysteine, which functions both as a persulfide acceptor and a 3-MP precursor.
In this study, we have compared the kinetic properties of the MPST1 and MPST2 variants with cysteine, NAC, and thioredoxin and assessed the contributions of the catalytic triad residues to the reaction mechanism. Kinetic simulations combined with experimental data revealed the potential for regulating MPST activity by thioredoxin via modulation of its KM value for 3-MP. We also determined the concentration of 3-MP in murine liver, kidney, and brain and used the kinetic data to simulate the relative importance of physiologically-relevant acceptors to the MPST-dependent sulfur transfer reaction.
Results
Kinetic comparison of MPST1 and MPST2 isoforms with cysteine and NAC
MPST1 was obtained in a similar yield and purity (Fig. 1C) as described previously for recombinant human MPST2 (10). The kinetic data for MPST1 is shown in Fig. 3, and the kinetic parameters for the two isoforms are compared in Table 1. The kinetic plots showed a sigmoidal dependence as reported previously for MPST2 with cysteine and 3-MP (10). Overall, the kinetic constants for H2S synthesis by the MPST isoforms were identical within experimental error in the presence of l-cysteine and NAC. Because non-Michaelis-Menten behavior was observed with cysteine and NAC (Fig. 3, A, B, D, and E), the data were fitted to the Hill equation yielding values for the Hill coefficient (Table 1). The kcat/KM(NAC) value is substantially lower than the kcat/Km(Cys) value, due to the ∼4-fold higher KM and 2-fold lower kcat values with NAC compared with cysteine. Our data indicate that NAC is unlikely to be a significant co-substrate for the MPST reaction in cells. In contrast, a prior study (23) reported a 1.3-fold higher catalytic efficiency with NAC versus cysteine. Because the MPST activity was reported in arbitrary fluorescence units in this study (23), a direct comparison with our data are not possible.
Figure 3.

Kinetics of H2S generation by MPST1 in the presence of varying thiophilic acceptors. The reaction mixtures contained variable concentrations of cysteine (0–12 mm) (A), NAC (0–40 mm) (B), or thioredoxin (0–10 μm)/thioredoxin reductase (3.5 μm) and NADPH (200 μm) (C) in 200 mm HEPES buffer, pH 7.4, 3-MP (0.3 mm in A and B and 3 mm in C), and BSA (100 μg/ml). For the kinetics of H2S generation by MPST1 in the presence of varying concentrations of 3-MP, the reaction mixtures contained: 20 mm cysteine (D), 50 mm NAC (E), or thioredoxin (20 μm)/thioredoxin reductase (3.5 μm) and NADPH (200 μm) (F) in 200 mm HEPES buffer, pH 7.4, BSA (100 μg/ml), and variable concentrations of 3-MP. The reaction mixtures were incubated at 37 °C for 5 min, started by the addition of human recombinant MPST1 and monitored as described under “Experimental procedures.” The KM and Vmax values were obtained by fitting the data to the Hill equation. The data are representative of a minimum of two independent data sets.
Table 1.
Comparison of kinetic parameters for MPST1 and MPST2
MPST activity was measured in 200 mm HEPES buffer, pH 7.4, at 37 °C.
| Acceptor | Parameter | MPST1 | MPST2 |
|---|---|---|---|
| l-Cysteine | KM (Cys) | 3.8 ± 0.4 mm | 4.5 ± 0.8 mm |
| na (Cys) | 1.4 ± 0.1 | 1.6 ± 0.1 | |
| KM(3-MP) | 24.0 ± 0.8 μm | 22 ± 5 μm | |
| n (3-MP) | 1.6 ± 0.2 | 1.4 ± 0.2 | |
| kcat | 0.44 s−1 | 0.5 s−1 | |
| kcat/KM(Cys) | 0.11 mm−1 s−1 | 0.11 mm−1 s−1 | |
| NAC | KM(NAC) | 17 ± 2 mm | 16 ± 2 mm |
| n (NAC) | 2.2 ± 0.5 | 2.7 ± 0.8 | |
| KM(3-MP) | 20.0 ± 2 μm | 15 ± 2 μm | |
| n (3-MP) | 1.3 ± 0.1 | 1.1 ± 0.1 | |
| kcat | 0.22 s−1 | 0.27 s−1 | |
| kcat/KM(NAC) | 0.013 mm−1 s−1 | 0.017 mm−1 s−1 | |
| Thioredoxin | KM(Trx) | 3.0 ± 0.15 μm | 3.1 ± 0.7 μm |
| n (Trx) | 1.6 ± 0.1 | 1.4 ± 0.3 | |
| KM(3-MP) | 358 ± 100 μm | 360 ± 40 μm | |
| n (3-MP) | 2.0 ± 0.6 | 2.1 ± 0.4 | |
| kcat | 0.40 s−1 | 0.44 s−1 | |
| kcat/KM(Trx) | 133 mm−1 s−1 | 142 mm−1 s−1 |
Regulation of MPST activity by thioredoxin
The kcat/KM(Trx) values for sulfur transfer from 3-MP to thioredoxin are identical for MPST1 and MPST2 within experimental error (Table 1) and >10-fold higher than with cysteine. The dependence of the reaction rate on the concentration of thioredoxin and 3-MP also showed sigmoidal behavior (Fig. 3, C and F). However, compared with cysteine and NAC, the KM for 3-MP is ∼15-fold higher in the presence of thioredoxin (Table 1). To understand the effect of thioredoxin on the KM for 3-MP, the dependence of the MPST reaction on thioredoxin concentration was examined at three 3-MP concentrations (Fig. 4A). At ≤300 μm 3-MP, the MPST reaction rate is inhibited above ∼8 μm thioredoxin. The extent of inhibition decreased with increasing 3-MP concentrations. From these data, a Ki value of 3.6 μm for thioredoxin was estimated as described under “Experimental procedures.”
Figure 4.

Substrate inhibition of the MPST reaction by thioredoxin. A, inhibition of MPST2 activity (0.3 μm in 200 mm HEPES buffer, pH 7.4) at increasing concentrations of thioredoxin (1–20 μm) in the presence of thioredoxin reductase (3.5 μm) and 200 μm NADPH. The activity of MPST2 was assessed at three concentrations of 3-MP (50, 100, and 300 μm) as indicated. The data are representative of three independent experiments. B, simulations of the MPST reaction rate at the indicated 3-MP concentrations (in μm) show a reasonable correspondence with the experimental data in A and reveal that substrate inhibition by thioredoxin can be alleviated only at unphysiologically high concentrations of 3-MP.
To further understand the potential physiological relevance of the inhibition of MPST by thioredoxin, kinetic simulations were employed. Using Equation 1 in Table 2, a reasonable correspondence was obtained between the experimental and simulated data (Fig. 4, A versus B) within a physiologically-relevant concentration range of thioredoxin, reported to vary between 1 and 20 μm (25, 26). The simulations predict that inhibition by thioredoxin is alleviated at high 3-MP concentrations (Fig. 4B). In agreement with this prediction, the activity of MPST2 is not inhibited in the presence of 3 mm 3-MP (Fig. 3C).
Table 2.
Equations and values used for kinetic simulations of the MPST reaction rate in murine liver

a KM(3MP)o denotes the Michaelis Menten constant for 3-MP in the absence of substrate inhibition by thioredoxin (Trx); Ki is the inhibition constant for Trx, and n1 is the Hill coefficient for Trx.
b VTot, VDHLA, VCys, VGSH, VHcy, and VTrx denote the total MPST reaction rate and rates of reactions catalyzed in the presence of DHLA, l-cysteine, GSH, homocysteine (Hcy), and Trx, respectively.
c VAcc denotes the rate of the MPST reaction with a given acceptor (i.e. Trx, Cys, DHLA, GSH, or Hcy). Vmax(Acc) and KM(Acc) denote the maximal rate of the MPST reaction and the Michaelis-Menten constant reaction for a given acceptor (Acc).
d n2 and n3 denote Hill coefficients for 3-MP and the respective acceptor. For cysteine and Trx, the n value denotes the average of the values for MPST1 and MPST2 reported in Table 2. For GSH and Hcy, the n values were calculated from the data in Ref. 10.
e The KM for 3-MP is the average of the value obtained in the presence of physiological acceptors except for Trx.
f The Ki value for thioredoxin was estimated using Equation 1 as described under “Experimental Procedures”.
Contribution of the catalytic triad residues to MPST activity
Because the MPST isoforms are kinetically indistinguishable, the catalytic contribution of the triad residues was assessed using MPST2. The protein yields for purified D63A, H74A, and S250A MPST2 (12, 21, and 20 mg/liter culture, respectively) were similar to the WT protein (22 mg/liter), suggesting comparable stability. The activity of the mutants was assessed using cysteine or reduced thioredoxin as the sulfur acceptor (Table 3). In the presence of cysteine, the specific activities of the D63A and H74A mutants were comparable with WT MPST2, whereas the S250A mutant was 2.6-fold lower. In the presence of thioredoxin, two mutants exhibited modestly lower specific activity (2.3-fold (D63A) and 1.9-fold (H74A)), whereas the S250A mutant was indistinguishable from WT MPST2. For comparison, mutation of either the serine or histidine residue in the catalytic triad in serine proteases decreases activity by at least 104-fold (27). Our results therefore argue against an essential role for the triad residues in the MPST reaction mechanism as suggested previously (20). Instead, Ser250 is likely to function primarily as a determinant of substrate specificity as concluded from mutagenesis studies on rat MPST (18).
Table 3.
Comparison of kinetic parameters for wildtype and catalytic triad mutants of MPST2
| Acceptor | MPST2-specific activitya |
|||
|---|---|---|---|---|
| Wildtype | D63A | H74A | S250A | |
| μmol min−1 mg−1 | ||||
| l-Cysteine | 1.8 ± 0.1 | 1.4 ± 0.1 | 1.6 ± 0.1 | 0.7 ± 0.1 |
| Thioredoxin | 2.3 ± 0.1 | 1.0 ± 0.1 | 1.2 ± 0.2 | 2.3 ± 0.1 |
a MPST activity was measured at pH 7.4 and at 37 °C in 200 mm HEPES buffer.
MPST activity in murine tissue
The activity of MPST and the prevalence of its isoforms were assessed in murine liver, kidney, and brain. Because the thiophilic acceptors, cysteine, homocysteine, and GSH, can stimulate H2S production (8, 9) or consumption (28, 29) by other enzymes present in tissue homogenates, DHLA was used as the thiophilic acceptor to assess MPST activity. A 10-fold range in tissue MPST activity was seen using either the lead sulfide or the gas chromatography (GC)-based sulfur chemiluminescence detection assay. The highest MPST activity was observed in liver, whereas kidney and brain were ∼2- and 10-fold lower, respectively (Table 4). When the MPST activity was normalized to soluble protein concentration, the same liver > kidney > brain activity order was seen. We note that enzyme activity normalized to tissue wet weight roughly corresponds to the enzyme concentration in the tissue and can be used to compare enzyme activities between tissues. Normalization to tissue protein concentration on the other hand can be misleading. For example, if the concentration of an enzyme were three times lower in brain than in liver, then normalization to tissue protein would yield similar specific activities for both tissues because the protein concentration in brain is ∼3-fold lower than in liver.
Table 4.
Comparison of MPST activity and 3-MP concentration in murine tissue
MPST activity data represent the mean ± S.D., n = 5, and were obtained using DHLA as the acceptor in the lead sulfide (PbS) or the GC-based method coupled to a sulfur chemiluminescence detection of hydrogen sulfide as described under “Experimental procedures.” 3-MP concentrations represent the mean ± S.D. of five independent experiments.
| Parameter | Assay | Liver | Kidney | Brain |
|---|---|---|---|---|
| MPST activity (mmol h−1·kg tissue−1) | PbS | 265 ± 31 | 114 ± 20 | 27 ± 2 |
| MPST activity (mmol h−1·kg tissue−1) | GC | 205 ± 12 | 107 ± 19 | 20 ± 5 |
| MPST-specific activity (mmol h−1·g protein−1) | PbS | 1.1 ± 0.2 | 0.69 ± 0.13 | 0.31 ± 0.02 |
| Soluble protein concentration (g·kg tissue−1) | 238 ± 11.0 | 166 ± 4 | 86 ± 4 | |
| 3-MP concentration (μmol·kg tissue−1) | 0.8 ± 0.3 | 1.4 ± 0.5 | 0.4 ± 0.4 |
MPST1 and MPST2 protein expression
The relative levels of MPST1 and MPST2 were assessed in different cell types. Three bands were detected in human red blood cell lysates from three donors (Fig. 5A). This is similar to the pattern reported previously in erythrocytes from a single individual (30). In addition to MPST1 and MPST2, a third shorter and highly-abundant band was seen in these cells. We tentatively assign this band as MPST3, which is described in the UniProtKB database as a truncated variant extending from the mitochondrial leader sequence to residue 198. Lacking the C-terminal rhodanese-like domain, which contributes to the active site, MPST3 is predicted to be inactive. In contrast, MPST purified from rat erythrocytes reportedly migrates as a single band (31).
Figure 5.
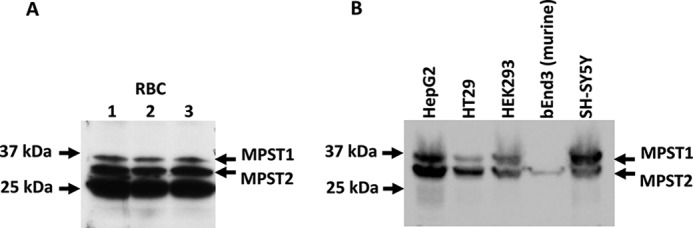
Expression of MPST isoforms in human and murine cells. A, Western blot analysis of MPST in human red blood cells (RBC). Cell lysates (200 μg of hemoglobin/lane) from three donors (lanes 1–3) were separated by SDS-PAGE and detected using MPST antibody as described under “Experimental procedures.” The migration of MPST1 and MPST2 is indicated on the right. B, Western blot analysis of MPST in extracts (100 μg of protein per lane) from human hepatoma (HepG2), colon adenocarcinoma (HT29), human embryonic kidney (HEK293), and neuroblastoma (SH-SY5Y) cells and from mouse endothelial cells (bEnd3).
Western blot analysis was also used to detect MPST isoforms in four human and one murine cell line (Fig. 5B). Both MPST1 and MPST2 were seen in the human cell lines, but only MPST2 was observed in the murine cell line. The presence of a single MPST band in rat erythrocytes (31) and in the murine cell line (Fig. 5B) suggests that rodents might express a single MPST isoform. The small difference in band migration between the native human and murine MPST2 samples was due to the difference in their molecular mass (murine = 30,091 Da and human = 30,217 Da, both lacking the leader sequence). The molecular mass of native human MPST1 is 35,250 Da. The highest MPST levels were observed in SH-SY5Y and HEPG2 cells, whereas the lowest levels were seen in the murine bEnd3 cells. The MPST1/MPST2 ratio varied in human cell lines (Fig. 5B). Although MPST1 predominated in the SH-SY5Y neuroblastoma cell line, MPST2 was the major isoform in HT29 colon adenocarcinoma cells and HepG2 hepatocellular carcinoma cells. HEK293 human embryonic kidney cells showed approximately equal amounts of the isoforms.
Concentration of 3-MP in murine tissues
To our knowledge, the intracellular concentration of 3-MP has not been reported. To address this gap, we used monobromobimane to derivatize tissue thiols and separated them by HPLC. The following retention times were seen for the standards: 3-MP (8 min), cysteine/homocysteine (4 min), and GSH (12 min). In tissue samples, a small albeit clear peak with a retention time corresponding to the monobimane adduct of 3-MP was observed and increased in intensity when spiked with standard 3-MP (data not shown). The fraction containing 3-MP was collected, and its identity was verified by LC/MS analysis, which revealed an m/z of 311.1 for the parent ion and 223.1 and 192.2 for the major fragments, as seen with an authentic 3-MP sample. The concentration of 3-MP in tissue samples was quantified using a calibration curve generated with known quantities of 3-MP. From this analysis, the following estimates for 3-MP concentration in murine tissue were obtained: 0.8 ± 0.3 μmol·kg tissue−1 in liver, 1.4 ± 0.5 μmol·kg tissue−1 in kidney, and 0.4 ± 0.4 μmol·kg tissue−1 in brain (Table 4). For comparison, the concentration of 3-MP in rabbit plasma was reported to be 0.05–0.1 μm (32).
Estimation of murine liver MPST reaction rate
The MPST reaction rate was simulated using the kinetic parameters for recombinant human MPST2 and the physiological concentrations of 3-MP and the thiophilic acceptors cysteine, homocysteine, and GSH (Tables 2 and 5). The simulations (using Equations 1–4 in Table 2) predicted that the total MPST reaction rate exhibits a bimodal dependence on the concentration of thioredoxin (Fig. 6A). The reaction rate is maximal (626 μmol h−1 kg tissue−1) at 0.1 μm thioredoxin and declines to 34 μmol h−1 kg tissue−1 at 10 μm thioredoxin. Because thioredoxin increases the KM for 3-MP, the first substrate, the MPST reaction rate of the other thiophilic acceptors also declines as the concentration of thioredoxin increases.
Table 5.
Human MPST parameters used for kinetic simulations
The MPST2 data used in the simulations were originally published in Ref. 10. KM(Acc) denotes the Michaelis constant for the acceptor at saturating 3-MP concentrations, and KM(3-MP) denotes the Michaelis constant for 3-MP at saturating concentrations of the corresponding acceptor (DHLA, 25 mm; cysteine, 20 mm; homocysteine, 20 mm; GSH, 30 mm; and Trx, 20 μm).
| Acceptor | KM(Acc) | KM(3-MP) | Vmax(DHLA)/Vmax(Acc) |
|---|---|---|---|
| mm | μm | ||
| Dihydrolipoic acid | 4.4 ± 0.3 | 25 ± 6 | 1 |
| l-Cysteine | 4.1 ± 0.6 | 22 ± 2 | 1.55 |
| l-Homocysteine | 12.5 ± 1.6 | 30 ± 0.2 | 1.94 |
| Glutathione | 28 ± 2 | 20 ± 0.4 | 5.1 |
| Thioredoxin | 0.0025 ± 0.0004 | 350 ± 62 | 1.35 |
Figure 6.

Simulation of the murine liver MPST reaction rate at physiological substrate concentrations. A, dependence of total MPST reaction rate and the component reactions with different acceptors on the concentration of thioredoxin at physiologically-relevant concentrations of 3-MP and other thiophilic acceptors (as specified in Table 2). B and C, dependence of the total MPST reaction rate and of the component reactions with different acceptors on the concentration of 3-MP at 10 μm (B) or 1 μm (C) thioredoxin. D, dependence of total MPST reaction rate and the component reactions with different acceptors, including DHLA (6 μm), on the concentration of 3-MP at 1 μm thioredoxin. Because of the hyperbolic dependence of the MPST reaction on DHLA concentration, its contribution to the total rate is predicted to be significant. However, as discussed in the text, the intracellular pool of free DHLA available for the MPST reaction is believed to be very low.
The simulations predict that cysteine and thioredoxin are the major thiophilic acceptors at physiologically-relevant substrate concentrations. At 0.8 μm 3-MP, approximating the concentration in murine liver (Table 4), and 1 μm thioredoxin, cysteine and thioredoxin account for 51 and 37% of the total reaction rate, respectively, with GSH contributing 12% (Fig. 6C). Increasing the concentration of thioredoxin to 10 μm decreases the total MPST reaction rate 12-fold and increases the contribution of cysteine to 80%. Under these conditions, thioredoxin accounts for 19% of the overall rate, while GSH and homocysteine make negligible contributions (Fig. 6B). The rate of the thioredoxin-dependent MPST reactions increases as the concentration of 3-MP increases, whereas the reaction rates with the other acceptors are less sensitive above 0.5 μm 3-MP (Fig. 6, B and C).
Unlike the other thiophilic acceptors, the dependence of the MPST rate on the concentration of DHLA exhibits Michaelis-Menten behavior as reported previously for MPST2 (10) and also observed with MPST1 (Fig. S1). Although the molecular basis for this difference in kinetic behavior is not known, DHLA, if available, would constitute a significant sulfane sulfur acceptor at 1 or 10 μm thioredoxin (Fig. 6D). However, DHLA, whose intracellular concentration is estimated to be 4–6 μm, is predominantly protein-bound (33), and it is unlikely to be available as a substrate for the MPST reaction.
In summary, the simulations predict that under physiological conditions, the total MPST reaction rate in murine liver is inversely proportional to the concentration of thioredoxin within a wide range of physiologically-relevant concentrations and that cysteine persulfide is a significant reaction product.
Discussion
MPST is expressed in many cell types and tissues (34), and its physiological significance in sulfur metabolism is revealed by the autosomal-recessive disorder, mercaptolactate-cysteine disulfiduria, which results from mutations in MPST (35, 36). This study leads to several major conclusions. (i) The MPST1 and MPST2 isoforms are kinetically indistinguishable, and their relative levels vary in human cell lines. (ii) NAC is unlikely to serve as an acceptor in the MPST-catalyzed reaction in contrast to what was previously a proposal (23). (iii) MPST can be a source of the low-molecular-weight cysteine persulfide. (iv) Thioredoxin can modulate MPST activity due to pronounced substrate inhibition in a physiologically-relevant concentration range.
Although monomeric, MPST1 (Fig. 3) and MPST2 (10) both exhibit non-Michaelis-Menten kinetics. Although less common, kinetic cooperativity has been seen with other monomeric enzymes, including other sulfur transferases (16, 17). Operationally, the Hill coefficient for monomeric enzymes is a relative measure of the cooperative effect rather than the number of ligand-binding sites as with oligomeric enzymes (37). Slow substrate-induced conformational change often underlies monomeric cooperativity, such that substrate binding to the enzyme does not reach equilibrium on the timescale of catalytic turnover (37). Although the molecular mechanism underlying monomeric cooperativity in MPST is not known, it is interesting that the only substrate with which it exhibits Michaelis-Menten behavior is a relatively hydrophobic one, i.e. DHLA (10).
The MPST reaction is proposed to occur via a ping-pong mechanism in which 3-MP binds first and forms an enzyme-bound persulfide intermediate (38). This mechanism is consistent with the crystal structures of murine and human MPST, which reveal that the active site is too small to simultaneously accommodate 3-MP and a thiophilic acceptor (10, 38). Following release of pyruvate, the second substrate binds, and sulfur transfer and release of the persulfide product complete the reaction cycle (Fig. 1B) (10). To explain the observed substrate inhibition of MPST by thioredoxin, we propose a modified ping-pong mechanism in which thioredoxin can also bind to the free enzyme, decreasing its availability for 3-MP (Fig. 7). This model helps explain the ∼15-fold increase in the KM value for 3-MP in the presence of thioredoxin (Table 5) (10). Substrate inhibition is not observed with the other (low molecular weight) acceptors, and the KM value for 3-MP is similar in their presence. Our study thus reveals that thioredoxin functions both as a persulfide acceptor in the MPST reaction and as a potential regulator, lowering the reaction rate as its concentration rises within a physiologically-relevant concentration range.
Figure 7.
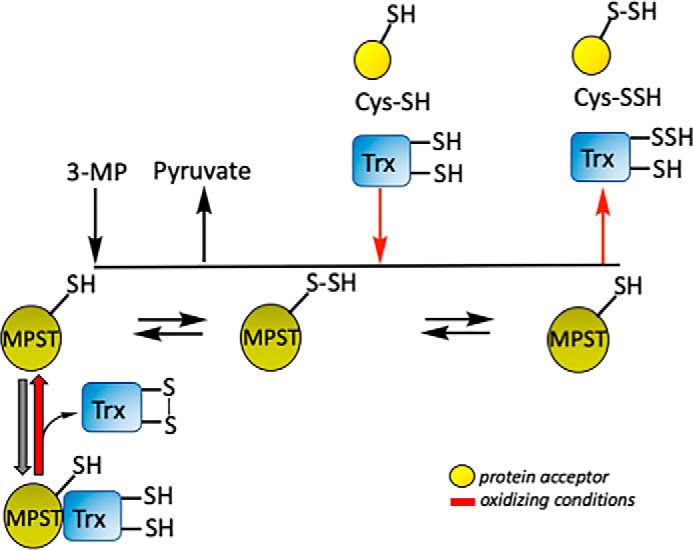
Postulated model for thioredoxin-mediated regulation of MPST. Binding of reduced thioredoxin to MPST decreases its KM for 3-MP, effectively inhibiting it under physiological conditions. Under oxidizing conditions (red arrows), when the concentration of the disulfide form of thioredoxin increases, MPST is free to interact with its substrate 3-MP, and the total reaction rate increases. The sulfane sulfur from the MPST-bound persulfide intermediate can be transferred to available low molecular acceptors, like cysteine, to other proteins or to thioredoxin (whose concentration is, however, low, thus enhancing cellular persulfidation potential.
Cysteine is estimated to account for 50–80% of the hepatic MPST reaction rate depending on the thioredoxin concentration. Furthermore, an increase in intracellular cysteine is expected to stimulate catabolic pathways, including the GOT-dependent transamination reaction enhancing 3-MP synthesis (Fig. 1B). Thus, the actual effect of cysteine elevation on H2S production could be more significant than predicted by the simulations if 3-MP levels rise.
Unexpectedly, our kinetic data predict that MPST activity will increase if the concentration of thioredoxin decreases. Although we were unable to assess the effect of oxidized thioredoxin on the MPST reaction rate, we speculate that the MPST reaction could be enhanced under oxidative stress conditions, which decrease thioredoxin availability. Examples of redox-sensitive regulation by thioredoxin that is independent of its oxidoreductase activity are known. For example, the interaction of T7 DNA polymerase with thioredoxin in the dithiol but not in the disulfide state increases its processivity (39). Similarly, the interaction of reduced thioredoxin with apoptosis-signaling kinase 1 inhibits apoptosis signaling (40).
Based on our model of substrate inhibition, we speculate that regulation of MPST by thioredoxin might be important for promoting target persulfidation under oxidizing conditions where it is postulated to serve a protective function (41–44). Thus, conditions that decrease the concentration of reduced thioredoxin might promote sulfur transfer from MPST to other low-molecular-weight acceptors or to proteins while also enhancing the overall reaction rate (Fig. 7). This model suggests the hypothesis that sulfur transfer from 3-MP to acceptors increases under oxidizing conditions and warrants testing. The active-site cysteine in MPST renders it potentially susceptible to inactivation by oxidants. However, the relatively high Ki (120 ± 10.5 μm) for H2O2-dependent inhibition of rat MPST (45) indicates that the active-site cysteine is well-protected. This is consistent with crystallization of the persulfide intermediate in mouse and human MPST (10, 38). Rat MPST is also susceptible to inhibition via an intersubunit disulfide bond formation between two surface-exposed cysteines (Cys154 and Cys263) (46). These cysteines are, however, not conserved in human MPST.
The pattern of MPST activity is similar to that reported previously for CBS and CSE, being highest in liver then followed by kidney and brain (11). Simulations using the experimentally-determined kinetic parameters in liver predicted a rate of MPST-dependent H2S (or persulfide) production of 0.03–0.41 mmol h−1 kg tissue−1 at physiologically-relevant substrate concentrations and 10–1 μm thioredoxin. At the upper limit, the rate is comparable with the experimentally-determined rate of H2S production (0.48 mmol h−1 kg tissue−1) predominantly by CSE in murine liver homogenate at 100 μm cysteine (6).
Experimental procedures
Materials
3-MP (sodium salt) was purchased from Research Organics (Cleveland, OH); DHLA was from Santa Cruz Biotechnology (Dallas, TX); monobromobimane (FluoroPure grade) was from Molecular Probes (Grand Island, NY); and l-cysteine, NAC, and NADPH were from Millipore-Sigma. Lead nitrate was from Acros Organics (Pittsburgh, PA). HepG2, HT29, HEK293, bEnd3, and SH-SY5Y lines were purchased from ATCC (Camden, NJ). Red blood cell lysates were prepared as described previously (30) using blood from three healthy volunteers provided by Dr. David Fox (University of Michigan).
MPST purification
Recombinant human MPST2, thioredoxin, and thioredoxin reductase were purified as described previously (10). The cDNA-encoding recombinant human MPST1 was cloned from pBF15 (12) into pET28b (Millipore-Sigma) using NdeI and EcoRI restriction sites. The pET28b_MPST1 expression construct incorporated a thrombin-cleavable His6 tag. BL21(DE3) Escherichia coli was transformed with pET28b_MPST1 and pTrc99A-EL (expressing the molecular chaperones GroES/GroEL, as described previously (10)). Overnight 10-ml cultures grown at 37 °C in Luria Bertani (LB) medium with 50 μg/ml kanamycin and 100 μg/ml ampicillin were used to inoculate six 1-liter cultures in the same medium. Growth was continued at 28 °C until the OD600 nm was ∼0.45, at which point the temperature was lowered to 15 °C. Induction of protein expression and purification of MPST1 was performed essentially as described previously for MPST2 (10). The protein was judged to be >90% pure by SDS-PAGE analysis. If desired, MPST1 was further purified using a DEAE-Sepharose column as described previously (10). All purified proteins were concentrated and stored at −80 °C.
Thioredoxin and thioredoxin reductase purification
Expression constructs for human thioredoxin (cytoplasmic) and thioredoxin reductase were the generous gifts from Dr. Vadim Gladyshev (Harvard Medical School). The cDNAs were expressed in E. coli and purified as described previously (47, 48).
Recombinant human thioredoxin was expressed in BL21(DE3), as described previously (47). Briefly, BL21(DE3) E. coli cells transformed with pET-20b-hTrx constructs were grown in LB medium at 37 °C until the OD600 nm was ≈0.8. IPTG (0.1 mm) was added to induce protein expression, and cells were grown for 5 h at 37 °C, then harvested by centrifugation, and stored at −80 °C until further use. To purify the protein, the cells were suspended in 50 mm HEPES, pH 7.4, containing 500 mm NaCl, 20 mm imidazole, EDTA-free protease inhibitor mixture (Roche Applied Science), 2 mm tris(2-carboxyethyl)phosphine (TCEP), lysozyme (50 mg), MgCl2 (5 mm), DNase (1 mg). Furthermore, the cell lysate was sonicated and centrifuged at 18,000 rpm. The supernatant was loaded onto a nickel-NTA–agarose column, washed with 200 ml of 50 mm HEPES, pH 7.4, containing 500 mm NaCl and 40 mm imidazole, and eluted with a linear gradient of 40–300 mm imidazole in the same buffer. Fractions containing thioredoxin were pooled, concentrated, and further purified on a Superdex 200 column eluted with PBS. Fractions containing thioredoxin were pooled, concentrated, and stored at −80 °C.
Recombinant WT thioredoxin reductase in which the selenocysteine is substituted by cysteine was expressed in BL21(DE3), as described previously (48). Briefly, BL21(DE3) E. coli cells transformed with pET-28b-hTR were grown in LB medium at 28 °C, and protein expression was induced with 0.5 mm IPTG when OD600 nm ≈0.6. Cells were grown overnight at 28 °C, harvested by centrifugation, and stored at −80 °C. To purify the protein, cells were suspended in 50 mm sodium phosphate, pH 7.4, containing 500 mm NaCl, 20 mm imidazole, EDTA-free protease inhibitor mixture (Roche Applied Science), lysozyme (50 mg), MgCl2 (5 mm), and DNase (1 mg). Cells were sonicated; the lysate was centrifuged at 18,000 rpm; and the supernatant was loaded onto a nickel-NTA–agarose column, washed with 50 mm sodium phosphate buffer, pH 7.4, containing 500 mm NaCl and 40 mm imidazole. The protein was eluted with a linear gradient of 40–400 mm imidazole. Fractions containing thioredoxin reductase were pooled, concentrated, and further purified on a Superdex 200 column, which was eluted with PBS. Fractions containing thioredoxin reductase were pooled, concentrated, and stored at −80 °C.
Animals and tissue collection
Male BALB/c mice, 8 weeks old, were purchased from Charles Rivers Laboratories (Wilmington, MA). Animals were sacrificed in a CO2 atmosphere, and liver, kidney, and brain were collected immediately, frozen in liquid nitrogen, and stored at −80 °C until further use. All procedures for animal handling were performed in accordance with the protocols approved by the University's Committee on Use and Care of Animals.
Tissue sample preparation
Each frozen organ was pulverized in liquid nitrogen using a porcelain mortar and pestle, and the frozen tissue powder was collected in pre-weighed sample tubes containing either (i) 400 μl of 200 mm HEPES buffer, pH 7.4 for MPST activity assay, or (ii) 500 μl of metaphosphoric acid solution (16.7 mg/ml) for 3-MP analysis. The tubes were then re-weighed to obtain an estimate of the weight of the tissue in each sample. The final tissue dilution (w/v) was ∼1:4 for MPST activity assays and 1:5–1:9 for 3-MP analysis. Protein concentration was determined using the Bradford method using BSA as a standard.
MPST activity assays
Tissue homogenates were divided into two parts. The first part was used as is to measure MPST activity in crude homogenates. The second part was centrifuged at 15,000 × g, 4 °C, for 10 min, and the supernatant was used to measure soluble MPST activity. The following methods were used to determine MPST activity in murine tissue homogenates.
(i) Tissue MPST activity using a colorimetric assay
The lead sulfide method was used to measure MPST activity in soluble tissue lysates (10). Briefly, the reaction mixture (1.0 ml final volume) containing 200 mm HEPES buffer, pH 7.4, BSA (100 μg/ml), 20 mm DHLA, 0.4 mm lead nitrate, and tissue homogenate (20 μg (liver or kidney) or 50 μg (brain)) was preincubated at 37 °C for 5 min, and the reaction was initiated by addition of 0.5 mm 3-MP. Formation of lead sulfide was monitored by the increase in absorbance at 390 nm, and a molar extinction coefficient of 5500 m−1 cm−1 was used to determine its concentration (9). Control reactions lacking substrate or tissue homogenate were performed in parallel, and the value was subtracted to obtain the final rate of the MPST reaction in the tissue samples.
(ii) Tissue MPST activity using GC coupled to sulfur chemiluminescence detection
H2S accumulation was measured directly using a GC equipped with a 355 sulfur chemiluminescence detector (Agilent, CA) as described previously (6, 11). Briefly, 0.5 ml of the reaction mixture described above, but lacking lead nitrate, was incubated at 37 °C in polypropylene syringes flushed with nitrogen in a total volume of 20 ml and with gentle agitation on a platform shaker. The rate of H2S production was determined by measuring the concentration of H2S in the gas phase in the syringe after 10 and 20 min of incubation.
(iii) Kinetic analysis of purified recombinant human MPST1
H2S synthesis by MPST was assayed using the colorimetric assay described above. Briefly, the reaction mixture (1.0-ml final volume) containing 200 mm HEPES buffer, pH 7.4, BSA (100 μg/ml), variable concentrations of 3-MP and either cysteine (0–12 mm), NAC (0–40 mm), DHLA (0–10 mm), or thioredoxin (0–10 μm)/thioredoxin reductase (3.5 μm) and NADPH (200 μm) was incubated at 37 °C for 5 min. The reaction was started by addition of 0.3 μm human recombinant MPST1 and was monitored as described above. The kinetic data were subjected to either the Michaelis-Menten or the Hill equation analysis.
Kinetic analysis of MPST reaction rate on thioredoxin concentration
The dependence of the MPST reaction rate on the concentration of thioredoxin was assessed at different 3-MP concentrations using the coupled thioredoxin reductase/NADPH assay to recycle oxidized thioredoxin as described previously (10). Briefly, a 1-ml reaction mixture containing 200 mm HEPES buffer, pH 7.4, 200 μm NADPH, 3.5 μm thioredoxin reductase, 1–20 μm thioredoxin, 100 μg/ml BSA, and variable concentrations of 3-MP (0–3 mm) was preincubated for 5 min at 37 °C. The reaction was started by addition of 0.3 μm human recombinant MPST1, and the rate of NADPH oxidation was monitored at 340 nm using the extinction coefficient, 6,200 m−1 cm−1.
Purification of MPST antibodies
Polyclonal antibodies against human MPST2 were raised in chicken by Aves Labs, Inc. (Tigard, OR). For this, purified recombinant human MPST2 was separated on a 10% polyacrylamide gel under denaturing conditions, and the 33-kDa protein band was excised and used as the antigen. Total IgY from eggs was purified using an MPST2 affinity column prepared using the Actigel-ALD kit (Sterogene, Carlsbad, CA) according to the manufacturer's protocol. The purified antibodies were validated by Western blot analysis (described below) using purified MPST as an antigen.
Western blot analysis
Lysates from human (HepG2, HEK293, and SH-SY5Y) and murine (bEnd3) cell lines were prepared as described previously (49). Red blood cell lysates were prepared as described previously (30), and the concentration of hemoglobin in each sample was assessed by the absorption at 415 nm using an extinction coefficient of 128 mm−1 cm−1 (50). The protein amount loaded per lane for Western blot analysis is indicated in the figure legends.
Proteins were separated on a 10% polyacrylamide gel under denaturing conditions and transferred to a PVDF membrane. Blots were probed using polyclonal anti-human MPST2 chicken antibodies described above (1:1000 dilution). Secondary anti-chicken antibodies conjugated to horseradish peroxidase (Aves Labs, Inc.) were used at a 1:500,000 dilution, and signals were visualized using the chemiluminescent peroxidase substrate kit SuperSignal West Dura (Thermo Fisher Scientific, Pittsburgh, PA). The MPST antibody detects both MPST1 and MPST2.
Quantitation of tissue 3-MP
For 3-MP analysis, tissue homogenate obtained as described above was centrifuged for 5 min at 15,000 × g at 4 °C. The supernatant was treated with monobromobimane to block free thiols as described previously (51). Briefly, 100 μl of supernatant was mixed with 20 μl of 1 m Tris base solution and 3 μl of 60 mm monobromobimane in acetonitrile, and the mixture was incubated in the dark at room temperature for 10 min. Then, 30 μl of metaphosphoric acid solution (16.7 mg/ml) was added, and the mixture (10–50 μl) was injected into a μ-Bondapak–NH2 column (10 μm, 4 × 300 mm (Waters, Milford, MA)). The sample was eluted using solutions A and B at a flow rate of 1 ml/min using the following gradients: 0–5 min, 10% B; 5–15 min, linear from 10 to 20% B; 15–20 min, linear from 20 to 100% B; 20–25 min, 100% B, 25–35 min, 10% B. Solution A was 20% water and 80% methanol. Solution B was 66% solution A and 34% ammonium acetate solution prepared by mixing 154 g of ammonium acetate, 300 ml of acetic acid, and 100 ml of water. The eluant was monitored by fluorescence excitation at 390 nm (emission at 490 nm). A calibration curve was generated using known concentrations of 3-MP derivatized with monobromobimane, which was stable for at least 2 h at 25 °C. For LC-MS analysis fractions containing 3-MP were collected, concentrated in a SpeedVac instrument, and stored at −80 °C until analysis.
Mass spectroscopic analysis
The derivatized 3-MP samples were thawed and kept at 4 °C during the LC-MS experiments. A BioBasic C-18 column (Thermo Fisher Scientific, Waltham, MA) was used to separate the derivatized compounds. The mobile phase was 0.1% formic acid in water (A) or acetonitrile (B). A 5-μl aliquot of each sample was injected into the column using an LC1200 HPLC from Agilent at a flow rate 0.2 ml/min. The eluate was attached to a 4000 QTrap (Sciex, Framingham, MA) operating in the MS, MS/MS, or MRM mode. The parameters for the electrospray ion-source were as follows: curtain gas = 25 p.s.i.; ionization spray = 5000 V; temperature = 650 °C; source gas 1 = 70 p.s.i.; source gas 2 = 40 p.s.i. The parameters after compound optimization were as follows: declustering potential = 80 V; entrance potential = 10 V; exit potential = 15 V; collision energy = 30 V. The transitions for the monobimane adduct of 3-MP were obtained by fragmentation of an authentic standard (311.1/223.1 and 311.1/192.2), and the second transition was used for quantification.
Kinetic simulations
Mathematical simulations were used to estimate H2S production by murine liver MPST2 at physiologically-relevant substrate concentrations using Microsoft Excel software. The following metabolite concentrations were used as representative of their respective physiological values in murine liver: 3-MP (0.8 μm, this study) and DHLA (6 μm (33)); cysteine (100 μm (52, 53)); homocysteine (4 μm (54, 55)); GSH (7 mm (52, 53)); and thioredoxin (10 μm (25)). The remaining parameter values used for the simulations are described in Table 2.
The total rate of the MPST2 reaction (Equation 2 in Table 2) is the sum of the component reactions with various thiophilic acceptors (cysteine, homocysteine, GSH, and thioredoxin ± DHLA). A ping-pong mechanism was used to describe the MPST reaction (Equation 2 in Table 2). The reaction rate with each acceptor included the influence of the other acceptors as competitive inhibitors. Because the Ki values were not known, the inhibition constant for each acceptor was set as a first approximation as equal to its KM value. For example, Equation 4 in Table 2 describes the rate of the MPST reaction with cysteine, and it includes the inhibitory effects of thioredoxin, GSH, and homocysteine on the reaction rate. The KM values for the substrates (Table 2) were reported previously for MPST2 (10). The Hill coefficient for each substrate is included in the reaction.
The KM values for 3-MP in the presence of cysteine, GSH, and homocysteine are very similar (20–30 μm). In contrast the KM for 3-MP is 15-fold higher in the presence of 20 μm thioredoxin (Table 1). As described by Equation 1 in Table 2, the KM value for 3-MP increases in proportion to the concentration of thioredoxin. A value of 25 μm was used for KM(3MP)o in Equation 1, which represents the average value for the KM for 3-MP with the other acceptors, i.e. in the absence of substrate inhibition. This equation incorporates the Hill coefficient for thioredoxin (n = 1.5). Taking into account that at 20 μm thioredoxin, KM(3MP) = 350 μm (10), a value of 3.6 μm for the Ki for thioredoxin was obtained using Equation 1.
MPST activity in murine liver with DHLA as an acceptor (Vmax(DHLA)) was determined in this study to be 265 mmol h−1 kg tissue−1 (Table 4). Murine liver MPST reaction rates with the other acceptors were estimated from the Vmax(DHLA)/Vmax(Acc) ratio, using values obtained with purified MPST2 in vitro (Table 5). The remaining parameter values used for the simulations are described in Table 2.
Author contributions
P. K. Y., V. V., and R. B. conceptualization; P. K. Y., V. V., S. C., and J. S. data curation; P. K. Y., V. V., S. C., J. S., and R. B. formal analysis; P. K. Y., V. V., S. C., J. S., and R. B. writing-review and editing; P. K. Y., V. V., and S. C. investigation; P. K. Y., V. V., and S. C. methodology; R. B. funding acquisition; R. B. writing-original draft; R. B. project administration.
Supplementary Material
Acknowledgments
We are grateful to Dr. Brian Vaccaro for setting up the expression and purification of MPST1, Jason Skelnar for analysis of the MPST2 mutants, and Dr. Vadim Gladyshev (Harvard Medical School) for the gifts of human thioredoxin and thioredoxin reductase expression plasmids.
This work was supported in part by National Institutes of Health Grant HL58984 and American Heart Association Grant 14POST18760003 (to P. K. Y.). The authors declare that they have no conflicts of interest with the contents of this article. The content is solely the responsibility of the authors and does not necessarily represent the official views of the National Institutes of Health.
This article contains Fig. S1.
- H2S
- hydrogen sulfide
- MPST
- mercaptopyruvate sulfur transferase
- 3-MP
- 3-mercaptopyruvate
- GSH
- glutathione
- NAC
- N-acetylcysteine
- DHLA
- dihydrolipoic acid
- Trx
- thioredoxin
- GOT
- glutamine oxoglutarate transaminase
- PDB
- Protein Data Bank.
References
- 1. Kabil O., and Banerjee R. (2010) The redox biochemistry of hydrogen sulfide. J. Biol. Chem. 285, 21903–21907 10.1074/jbc.R110.128363 [DOI] [PMC free article] [PubMed] [Google Scholar]
- 2. Filipovic M. R., Zivanovic J., Alvarez B., and Banerjee R. (2018) Chemical biology of H2S signaling through persulfidation. Chem. Rev. 118, 1253–1337 10.1021/acs.chemrev.7b00205 [DOI] [PMC free article] [PubMed] [Google Scholar]
- 3. Kabil O., Vitvitsky V., and Banerjee R. (2014) Sulfur as a signaling nutrient through hydrogen sulfide. Annu. Rev. Nutr. 34, 171–205 10.1146/annurev-nutr-071813-105654 [DOI] [PMC free article] [PubMed] [Google Scholar]
- 4. Furne J., Saeed A., and Levitt M. D. (2008) Whole tissue hydrogen sulfide concentrations are orders of magnitude lower than presently accepted values. Am. J. Physiol. Regul. Integr. Comp. Physiol. 295, R1479–R1485 10.1152/ajpregu.90566.2008 [DOI] [PubMed] [Google Scholar]
- 5. Levitt M. D., Abdel-Rehim M. S., and Furne J. (2011) Free and acid-labile hydrogen sulfide concentrations in mouse tissues: anomalously high free hydrogen sulfide in aortic tissue. Antioxid. Redox Signal. 15, 373–378 10.1089/ars.2010.3525 [DOI] [PubMed] [Google Scholar]
- 6. Vitvitsky V., Kabil O., and Banerjee R. (2012) High turnover rates for hydrogen sulfide allow for rapid regulation of its tissue concentrations. Antioxid. Redox Signal. 17, 22–31 10.1089/ars.2011.4310 [DOI] [PMC free article] [PubMed] [Google Scholar]
- 7. Singh S., and Banerjee R. (2011) PLP-dependent H2S biogenesis. Biochim. Biophys. Acta 1814, 1518–1527 10.1016/j.bbapap.2011.02.004 [DOI] [PMC free article] [PubMed] [Google Scholar]
- 8. Singh S., Padovani D., Leslie R. A., Chiku T., and Banerjee R. (2009) Relative contributions of cystathionine β-synthase and γ-cystathionase to H2S biogenesis via alternative trans-sulfuration reactions. J. Biol. Chem. 284, 22457–22466 10.1074/jbc.M109.010868 [DOI] [PMC free article] [PubMed] [Google Scholar]
- 9. Chiku T., Padovani D., Zhu W., Singh S., Vitvitsky V., and Banerjee R. (2009) H2S biogenesis by human cystathionine γ-lyase leads to the novel sulfur metabolites lanthionine and homolanthionine and is responsive to the grade of hyperhomocysteinemia. J. Biol. Chem. 284, 11601–11612 10.1074/jbc.M808026200 [DOI] [PMC free article] [PubMed] [Google Scholar]
- 10. Yadav P. K., Yamada K., Chiku T., Koutmos M., and Banerjee R. (2013) Structure and kinetic analysis of H2S production by human mercaptopyruvate sulfurtransferase. J. Biol. Chem. 288, 20002–20013 10.1074/jbc.M113.466177 [DOI] [PMC free article] [PubMed] [Google Scholar]
- 11. Kabil O., Vitvitsky V., Xie P., and Banerjee R. (2011) The quantitative significance of the transsulfuration enzymes for H2S production in murine tissues. Antioxid. Redox Signal. 15, 363–372 10.1089/ars.2010.3781 [DOI] [PMC free article] [PubMed] [Google Scholar]
- 12. Fräsdorf B., Radon C., and Leimkühler S. (2014) Characterization and interaction studies of two isoforms of the dual localized 3-mercaptopyruvate sulfurtransferase TUM1 from humans. J. Biol. Chem. 289, 34543–34556 10.1074/jbc.M114.605733 [DOI] [PMC free article] [PubMed] [Google Scholar]
- 13. Jarabak R., and Westley J. (1978) Steady-state kinetics of 3-mercaptopyruvate sulfurtransferase from bovine kidney. Arch. Biochem. Biophys. 185, 458–465 10.1016/0003-9861(78)90189-3 [DOI] [PubMed] [Google Scholar]
- 14. Bordo D., and Bork P. (2002) The rhodanese/Cdc25 phosphatase superfamily. Sequence–structure–function relations. EMBO Rep. 3, 741–746 10.1093/embo-reports/kvf150 [DOI] [PMC free article] [PubMed] [Google Scholar]
- 15. Ploegman J. H., Drent G., Kalk K. H., Hol W. G., Heinrikson R. L., Keim P., Weng L., and Russell J. (1978) The covalent and tertiary structure of bovine liver rhodanese. Nature 273, 124–129 10.1038/273124a0 [DOI] [PubMed] [Google Scholar]
- 16. Libiad M., Motl N., Akey D. L., Sakamoto N., Fearon E. R., Smith J. L., and Banerjee R. (2018) Thiosulfate sulfurtransferase-like domain-containing 1 protein interacts with thioredoxin. J. Biol. Chem. 293, 2675–2686 10.1074/jbc.RA117.000826 [DOI] [PMC free article] [PubMed] [Google Scholar]
- 17. Motl N., Skiba M. A., Kabil O., Smith J. L., and Banerjee R. (2017) Structural and biochemical analyses indicate that a bacterial persulfide dioxygenase-rhodanese fusion protein functions in sulfur assimilation. J. Biol. Chem. 292, 14026–14038 10.1074/jbc.M117.790170 [DOI] [PMC free article] [PubMed] [Google Scholar]
- 18. Nagahara N., and Nishino T. (1996) Role of amino acid residues in the active site of rat liver mercaptopyruvate sulfurtransferase. J. Biol. Chem. 271, 27395–27401 10.1074/jbc.271.44.27395 [DOI] [PubMed] [Google Scholar]
- 19. Alphey M. S., Williams R. A., Mottram J. C., Coombs G. H., and Hunter W. N. (2003) The crystal structure of Leishmania major 3-mercaptopyruvate sulfurtransferase. A three-domain architecture with a serine protease-like triad at the active site. J. Biol. Chem. 278, 48219–48227 10.1074/jbc.M307187200 [DOI] [PubMed] [Google Scholar]
- 20. Huang G. T., and Yu J. S. (2016) Enzyme catalysis that paves the way for S-sulfhydration via sulfur atom transfer. J. Phys. Chem. B 120, 4608–4615 10.1021/acs.jpcb.6b03387 [DOI] [PubMed] [Google Scholar]
- 21. Williams R. A., Kelly S. M., Mottram J. C., and Coombs G. H. (2003) 3-Mercaptopyruvate sulfurtransferase of Leishmania contains an unusual C-terminal extension and is involved in thioredoxin and antioxidant metabolism. J. Biol. Chem. 278, 1480–1486 10.1074/jbc.M209395200 [DOI] [PubMed] [Google Scholar]
- 22. Westrop G. D., Georg I., and Coombs G. H. (2009) The mercaptopyruvate sulfurtransferase of Trichomonas vaginalis links cysteine catabolism to the production of thioredoxin persulfide. J. Biol. Chem. 284, 33485–33494 10.1074/jbc.M109.054320 [DOI] [PMC free article] [PubMed] [Google Scholar]
- 23. Zuhra K., Tomé C. S., Masi L., Giardina G., Paulini G., Malagrinò F., Forte E., Vicente J. B., and Giuffrè A. (2019) N-Acetylcysteine serves as substrate of 3-mercaptopyruvate sulfurtransferase and stimulates sulfide metabolism in colon cancer cells. Cells 8, E828 10.3390/cells8080828 [DOI] [PMC free article] [PubMed] [Google Scholar]
- 24. Ezeriņa D., Takano Y., Hanaoka K., Urano Y., and Dick T. P. (2018) N-Acetyl cysteine functions as a fast-acting antioxidant by triggering intracellular H2S and sulfane sulfur production. Cell Chem. Biol. 25, 447–459.e4 10.1016/j.chembiol.2018.01.011 [DOI] [PMC free article] [PubMed] [Google Scholar]
- 25. Demarquoy J., Fairand A., Vaillant R., and Gautier C. (1991) Development and hormonal control of thioredoxin and the thioredoxin-reductase system in the rat liver during the perinatal period. Experientia 47, 497–500 10.1007/BF01959954 [DOI] [PubMed] [Google Scholar]
- 26. Fridovich I., Poole L. B., Holmgren A., Lou M. F., Gladyshev V. N., David S. S., Osborne R. L., Dawson J. H., Copley S. D., Kadokura H., Beckwith J., Gilbert H. F., and Ragsdale S. W. (2007) Redox Biochemistry (Banerjee R., ed.) pp. 49–134, John Wiley & Sons, Inc., New York [Google Scholar]
- 27. Hedstrom L. (2002) Serine protease mechanism and specificity. Chem. Rev. 102, 4501–4524 10.1021/cr000033x [DOI] [PubMed] [Google Scholar]
- 28. Libiad M., Yadav P. K., Vitvitsky V., Martinov M., and Banerjee R. (2014) Organization of the human mitochondrial H2S oxidation pathway. J. Biol. Chem. 289, 30901–30910 10.1074/jbc.M114.602664 [DOI] [PMC free article] [PubMed] [Google Scholar]
- 29. Libiad M., Sriraman A., and Banerjee R. (2015) Polymorphic variants of human rhodanese exhibit differences in thermal stability and sulfur transfer kinetics. J. Biol. Chem. 290, 23579–23588 10.1074/jbc.M115.675694 [DOI] [PMC free article] [PubMed] [Google Scholar]
- 30. Vitvitsky V., Yadav P. K., Kurthen A., and Banerjee R. (2015) Sulfide oxidation by a noncanonical pathway in red blood cells generates thiosulfate and polysulfides. J. Biol. Chem. 290, 8310–8320 10.1074/jbc.M115.639831 [DOI] [PMC free article] [PubMed] [Google Scholar]
- 31. Włodek L., and Ostrowski W. S. (1982) 3-Mercaptopyruvate sulphurtransferase from rat erythrocytes. Acta Biochim. Pol. 29, 121–133 [PubMed] [Google Scholar]
- 32. Stutelberg M. W., Vinnakota C. V., Mitchell B. L., Monteil A. R., Patterson S. E., and Logue B. A. (2014) Determination of 3-mercaptopyruvate in rabbit plasma by high performance liquid chromatography tandem mass spectrometry. J. Chromatogr. B Analyt. Technol. Biomed. Life Sci. 949, 94–98 10.1016/j.jchromb.2014.01.006 [DOI] [PMC free article] [PubMed] [Google Scholar]
- 33. Kataoka H., Hirabayashi N., and Makita M. (1993) Analysis of lipoic acid in biological samples by gas chromatography with flame photometric detection. J. Chromatogr. 615, 197–202 10.1016/0378-4347(93)80333-Y [DOI] [PubMed] [Google Scholar]
- 34. Nagahara N., Ito T., Kitamura H., and Nishino T. (1998) Tissue and subcellular distribution of mercaptopyruvate sulfurtransferase in the rat: confocal laser fluorescence and immunoelectron microscopic studies combined with biochemical analysis. Histochem. Cell Biol. 110, 243–250 10.1007/s004180050286 [DOI] [PubMed] [Google Scholar]
- 35. Crawhall J. C., Parker R., Sneddon W., and Young E. P. (1969) β-Mercaptolactate–cysteine disulfide in the urine of a mentally retarded patient. Am. J. Dis. Child. 117, 71–82 10.1001/archpedi.1969.02100030073008 [DOI] [PubMed] [Google Scholar]
- 36. Crawhall J. C., Parker R., Sneddon W., Young E. P., Ampola M. G., Efron M. L., and Bixby E. M. (1968) β-Mercaptolactate-cysteine disulfide: analog of cystine in the urine of a mentally retarded patient. Science 160, 419–420 10.1126/science.160.3826.419 [DOI] [PubMed] [Google Scholar]
- 37. Porter C. M., and Miller B. G. (2012) Cooperativity in monomeric enzymes with single ligand-binding sites. Bioorg. Chem. 43, 44–50 10.1016/j.bioorg.2011.11.001 [DOI] [PMC free article] [PubMed] [Google Scholar]
- 38. Hanaoka K., Sasakura K., Suwanai Y., Toma-Fukai S., Shimamoto K., Takano Y., Shibuya N., Terai T., Komatsu T., Ueno T., Ogasawara Y., Tsuchiya Y., Watanabe Y., Kimura H., Wang C., et al. (2017) Discovery and mechanistic characterization of selective inhibitors of H2S-producing enzyme: 3-mercaptopyruvate sulfurtransferase (3MST) targeting active-site cysteine persulfide. Sci. Rep. 7, 40227 10.1038/srep40227 [DOI] [PMC free article] [PubMed] [Google Scholar]
- 39. Huber H. E., Tabor S., and Richardson C. C. (1987) Escherichia coli thioredoxin stabilizes complexes of bacteriophage T7 DNA polymerase and primed templates. J. Biol. Chem. 262, 16224–16232 [PubMed] [Google Scholar]
- 40. Saitoh M., Nishitoh H., Fujii M., Takeda K., Tobiume K., Sawada Y., Kawabata M., Miyazono K., and Ichijo H. (1998) Mammalian thioredoxin is a direct inhibitor of apoptosis signal-regulating kinase (ASK) 1. EMBO J. 17, 2596–2606 10.1093/emboj/17.9.2596 [DOI] [PMC free article] [PubMed] [Google Scholar]
- 41. Kimura Y., and Kimura H. (2004) Hydrogen sulfide protects neurons from oxidative stress. FASEB J. 18, 1165–1167 10.1096/fj.04-1815fje [DOI] [PubMed] [Google Scholar]
- 42. Kimura Y., Goto Y., and Kimura H. (2010) Hydrogen sulfide increases glutathione production and suppresses oxidative stress in mitochondria. Antioxid. Redox Signal. 12, 1–13 10.1089/ars.2008.2282 [DOI] [PubMed] [Google Scholar]
- 43. Jeney V., Komódi E., Nagy E., Zarjou A., Vercellotti G. M., Eaton J. W., Balla G., and Balla J. (2009) Supression of hemin-mediated oxidation of low-density lipoprotein and subsequent endothelial reactions by hydrogen sulfide (H2S). Free Radic. Biol. Med. 46, 616–623 10.1016/j.freeradbiomed.2008.11.018 [DOI] [PMC free article] [PubMed] [Google Scholar]
- 44. Zivanovic J., Kouroussis E., Kohl J. B., Adhikari B., Bursac B., Schott-Roux S., Petrovic D., Miljkovic J. L., Thomas-Lopez D., Jung Y., Miler M., Mitchell S., Milosevic V., Gomes J. E., Benhar M., et al. (2020) Selective persulfide detection reveals evolutionarily conserved antiaging effects of S-sulfhydration. Cell Metab. 31, 207 10.1016/j.cmet.2019.12.001 [DOI] [PMC free article] [PubMed] [Google Scholar]
- 45. Nagahara N., and Katayama A. (2005) Post-translational regulation of mercaptopyruvate sulfurtransferase via a low redox potential cysteine-sulfenate in the maintenance of redox homeostasis. J. Biol. Chem. 280, 34569–34576 10.1074/jbc.M505643200 [DOI] [PubMed] [Google Scholar]
- 46. Nagahara N., Yoshii T., Abe Y., and Matsumura T. (2007) Thioredoxin-dependent enzymatic activation of mercaptopyruvate sulfurtransferase. An intersubunit disulfide bond serves as a redox switch for activation. J. Biol. Chem. 282, 1561–1569 10.1074/jbc.M605931200 [DOI] [PubMed] [Google Scholar]
- 47. Su D., Berndt C., Fomenko D. E., Holmgren A., and Gladyshev V. N. (2007) A conserved cis-proline precludes metal binding by the active site thiolates in members of the thioredoxin family of proteins. Biochemistry 46, 6903–6910 10.1021/bi700152b [DOI] [PubMed] [Google Scholar]
- 48. Turanov A. A., Hatfield D. L., and Gladyshev V. N. (2010) Characterization of protein targets of mammalian thioredoxin reductases. Methods Enzymol. 474, 245–254 10.1016/S0076-6879(10)74014-3 [DOI] [PMC free article] [PubMed] [Google Scholar]
- 49. Yadav P. K., Vitvitsky V., Kim H., White A., Cho U. S., and Banerjee R. (2019) S-3-Carboxypropyl-l-cysteine specifically inhibits cystathionine γ-lyase–dependent hydrogen sulfide synthesis. J. Biol. Chem. 294, 11011–11022 10.1074/jbc.RA119.009047 [DOI] [PMC free article] [PubMed] [Google Scholar]
- 50. Antonini E., and Brunori M. (1971) Hemoglobin and Myoglobin in Their Reactions with Ligands, North Holland Publishing Co., Amsterdam, The Netherlands [Google Scholar]
- 51. Fahey R. C., Newton G. L., Dorian R., and Kosower E. M. (1981) Analysis of biological thiols: quantitative determination of thiols at the picomole level based upon derivatization with monobromobimanes and separation by cation-exchange chromatography. Anal. Biochem. 111, 357–365 10.1016/0003-2697(81)90573-X [DOI] [PubMed] [Google Scholar]
- 52. Vitvitsky V., Dayal S., Stabler S., Zhou Y., Wang H., Lentz S. R., and Banerjee R. (2004) Perturbations in homocysteine-linked redox homeostasis in a murine model for hyperhomocysteinemia. Am. J. Physiol. Regul. Integr. Comp. Physiol. 287, R39–R46 10.1152/ajpregu.00036.2004 [DOI] [PubMed] [Google Scholar]
- 53. Vitvitsky V., Martinov M., Ataullakhanov F., Miller R. A., and Banerjee R. (2013) Sulfur-based redox alterations in long-lived Snell dwarf mice. Mech. Ageing Dev. 134, 321–330 10.1016/j.mad.2013.05.004 [DOI] [PMC free article] [PubMed] [Google Scholar]
- 54. Kwon D. Y., Jung Y. S., Kim S. J., Kim Y. S., Choi D. W., and Kim Y. C. (2013) Alterations in sulfur amino acid metabolism in mice treated with silymarin: a novel mechanism of its action involved in enhancement of the antioxidant defense in liver. Planta Med. 79, 997–1002 10.1055/s-0032-1328704 [DOI] [PubMed] [Google Scholar]
- 55. Roman H. B., Hirschberger L. L., Krijt J., Valli A., Kožich V., and Stipanuk M. H. (2013) The cysteine dioxgenase knockout mouse: altered cysteine metabolism in nonhepatic tissues leads to excess H2S/HS− production and evidence of pancreatic and lung toxicity. Antioxid. Redox Signal. 19, 1321–1336 10.1089/ars.2012.5010 [DOI] [PMC free article] [PubMed] [Google Scholar]
Associated Data
This section collects any data citations, data availability statements, or supplementary materials included in this article.