Abstract
Rationale: Rhinoviruses (RVs) are major triggers of common cold and acute asthma exacerbations. RV species A, B, and C may have distinct clinical impact; however, little is known regarding RV species–specific antibody responses in health and asthma.
Objectives: To describe and compare total and RV species–specific antibody levels in healthy children and children with asthma, away from an acute event.
Methods: Serum samples from 163 preschool children with mild to moderate asthma and 72 healthy control subjects from the multinational Predicta cohort were analyzed using the recently developed PreDicta RV antibody chip.
Measurements and Main Results: RV antibody levels varied, with RV-C and RV-A being higher than RV-B in both groups. Compared with control subjects, asthma was characterized by significantly higher levels of antibodies to RV-A and RV-C, but not RV-B. RV antibody levels positively correlated with the number of common colds over the previous year in healthy children, and wheeze episodes in children with asthma. Antibody levels also positively correlated with asthma severity but not with current asthma control.
Conclusions: The variable humoral response to RV species in both groups suggests a differential infectivity pattern between RV species. In healthy preschoolers, RV antibodies accumulate with colds. In asthma, RV-A and RV-C antibodies are much higher and further increase with disease severity and wheeze episodes. Higher antibody levels in asthma may be caused by a compromised innate immune response, leading to increased exposure of the adaptive immune response to the virus. Importantly, there is no apparent protection with increasing levels of antibodies.
Keywords: rhinovirus, asthma, antibody, PreDicta chip
At a Glance Commentary
Scientific Knowledge on the Subject
Knowledge on the rhinovirus (RV) species–specific antibody response is limited mostly because of the great phylogenetic diversity of the virus. Although it has been suggested that the immune response to RV-C species is less efficacious than RV-A and RV-B, T-cell responses to RV-A and RV-C can be of similar magnitude. Moreover, there is only a small number of studies that describe antibody accumulation in response to RV in patients with asthma where a defective immune response has been reported.
What This Study Adds to the Field
A novel RV antibody chip was used that allows the measurement of 130 different RV proteins and peptides. Our data suggest that preschool children with asthma have accumulated high antibody levels since a younger age (<3 yr) but with no apparent protection and they probably expand their RV repertoire only after more severe infections, associated with wheeze. The heightened antibody levels in asthma suggest a compromised innate immune response, leading to increased exposure of the adaptive immune response to the virus.
Asthma is a major contemporary epidemic (1). A considerable proportion of the asthma burden is attributed to acute exacerbations, which almost invariably (2) follow an upper respiratory tract infection (URI), most often caused by rhinoviruses (RVs) (3, 4). In addition to exacerbations, RVs promote asthma in multiple ways (5–7). Persons with asthma are more susceptible to symptomatic RV infection and a suboptimal antiviral response is associated with increased viral replication and cytotoxicity (8).
There are 81 RV-A, 33 RV-B, and 33 RV-C full genome sequences available in addition to 358 yet unclassified partial sequences (NCBI Taxonomy Browser). RV-C genotypes are more diverse than RV-A or RV-B (9) and recombination is frequent (10), especially for RV-A and RV-C species (11). RV species are widespread and continuously cocirculating throughout the world (12). RV-A and RV-C species are associated with severe infections and hospitalization in young children, especially those with asthma (13, 14).
After an RV infection, serum neutralizing antibody titers increase for about a year and high preexisting neutralizing antibody titers have been associated with resistance to reinfection (15). RV species–specific and cross-reactive signal can be defined (16), although antibody responses against RV-A and RV-C species are highly cross-reactive. There is low correlation between the RV genotype detected during a symptomatic or recovering period and RV antibody titers (17–19), possibly because of the high sequence homology observed between RV species. Thus, understanding the full extent of RV epitope diversity is required to develop a vaccine with wide species coverage (20).
During an exacerbation, children with asthma have higher total anti-RV antibody titers than children without asthma (17) and RV VP1–specific IgG1 levels tend to be higher in adults with asthma than healthy control subjects, before an experimental infection (21). Although it has been suggested that the immune response to RV-C species is less efficacious than RV-A and RV-B (17, 21), T-cell responses to RV-A and RV-C are of similar magnitude (22).
With advancing technology and an increasing number of sequences available, we are now able to identify species-specific antibodies with increased resolution. In this study, we take advantage of our recently developed PreDicta RV chip to describe RV species–specific antibody responses in preschool-age children with or without asthma.
Methods
Study Population
The PreDicta pediatric cohort is a 2-year prospective multicenter study, part of the EU FP7 program PreDicta, and has been described elsewhere (23). We have analyzed available serum samples from 163 children, 4–6 years of age, with a diagnosis of mild to moderate severity asthma confirmed by a doctor of the participating study center using prespecified criteria. Seventy-two healthy children of matched age, with no history of asthma/wheeze, served as cross-sectional control subjects (see Table E1 in the online supplement). The study was approved by all participants’ institutional ethics committees, and written informed consent was obtained from all parents.
Chip-based Measurement of RV-Specific Antibody Levels in Human Serum Samples
Serum RV-specific antibody levels were measured using the newly developed PreDicta RV chip (19). Briefly, the PreDicta microarray contains 130 synthesized linear RV peptides and proteins including 20 recombinant RV capsid proteins, VP1-VP4, and 15 recombinant VP1 fragments from five representative RV strains (RV89, RV14, RV16, RV2, and RVC). In addition, it also contains five recombinant nonstructural proteins from RV89. Details on the chip-based measurement of RV-specific antibody levels in human serum samples are provided in the online supplement.
Noise Reduction and Determination of Peptide Specificity
Before comparing measurements between groups, the data were processed to exclude noninformative signal and determine the specificity of peptide signal toward RV-A, -B, and -C (see Figures E1–E4). The final dataset included antibody signals from RV-A (n = 14), RV-B (n = 9), and RV-C (n = 2) species–specific peptides (see Figure E4 and Table E2). A detailed description of the analysis can be found in the online supplement.
Significance Tests
A detailed description of the analysis can be found in the online supplement.
Results
Differential Antibody Levels against RV-A, -B, and -C
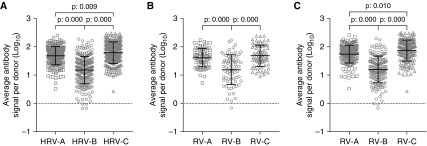
In the overall population, RV-A (95% confidence interval [CI], 1.646–1.728)– and RV-C (95% CI, 1.748–1.845)–specific signal levels were significantly higher than RV-B (95% CI, 1.123–1.248) (Figure 1A). This was the case in both healthy control children (RV-A 95% CI, 1.518–1.669; RV-C 95% CI, 1.577–1.753; RV-B 95% CI, 1.054–1.298) (Figure 1B) and patients with asthma (RV-A 95% CI, 1.679–1.776; RV-C 95% CI, 1.797–1.911; RV-B 95% CI, 1.116–1.262) (Figure 1C). Moreover, in the asthma group and in the overall population, RV-C–specific antibody signal was higher than that to RV-A (Figures 1A and 1C).
Figure 1.
Rhinovirus (RV) species–specific antibody signal levels in preschool children with and without asthma. (A) In all participants of the study, the highest RV (HRV) signal is observed against RV-C peptides followed by RV-A and RV-B antibody levels. (B) In healthy donors, RV-A and RV-C signals were higher than RV-B. (C) In patients with asthma, the HRV antibody signal is observed against RV-C peptides followed by RV-A and RV-B. Differences are significant at the 0.05 level using ANOVA and post hoc Tukey test.
Children with asthma have higher RV-A and RV-C, but not RV-B, antibody levels than healthy control subjects
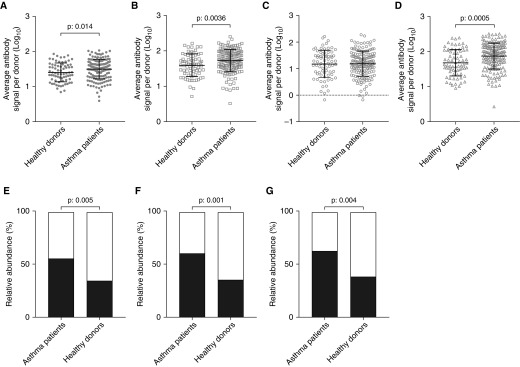
The average RV antibody signal was significantly higher in patients with asthma (95% CI, 1.457–1.543) than healthy participants (95% CI, 1.342–1.468) (Figure 2A). When analyzed individually, the average RV-A (Figure 2B) and RV-C (Figure 2D) species–specific signals were significantly higher in asthma (RV-A 95% CI, 1.679–1.776; RV-C 95% CI, 1.797–1.911) than control subjects (RV-A 95% CI, 1.518–1.669; RV-C 95% CI, 1.577–1.753), whereas no differences were observed for RV-B (Figure 2C). Significant differences between the asthma and control groups were also found for the peptides identifying both RV-A and RV-C (RV-A/C; P = 0.0089) and those identifying all RV species (RV-A/B/C; P = 0.0014) but not those identifying RV-A and RV-B (RV-A/B; P = 0.4137).
Figure 2.
Differential accumulation of rhinovirus (RV) species antibody signal levels between patients with asthma and healthy donors. (A) Children with asthma have higher RV antibody signal compared with healthy donors. Patients with asthma have higher species-specific antibody signal against RV-A (B) and RV-C (D) but not against RV-B (C). Most patients with asthma could be assigned as “high responders” against RV-A (55.2% vs. 34.3%) (E), RV-C (60.7% vs. 35.9%) (F), and RV-A/C (56.4% vs. 32.8%) peptides (G) compared with healthy donors. Low responders: white portion of bar plot. High responders: black portion of bar plot. Differences were significant at the 0.05 level, unpaired Student’s t test with Welch correction.
Participants were grouped (K = 2, unsupervised K-means clustering) based on the measured RV species–specific and mixed antibody signal into high and low responders. Significantly more patients with asthma were classified as high responders when compared with healthy donors, but only for the RV-A–specific (Figure 2E), RV-C–specific (Figure 2F), and RV-A/C peptides (Figure 2G). Regression analysis suggested that patients with asthma were significantly more likely to be high responders to RV-A (95% CI, 0.233–0.775) and RV-C (95% CI, 0.199–0.661) species–specific and RV-A/C (95% CI, 0.169–0.716) mixed-signal peptide measurements. No differences were observed in groups of high and low responders to RV-B–specific, RV-A/B, and RV-A/B/C mixed peptides.
RV antibody levels reflect the number of URIs in the last 12 months in healthy children but not in patients with asthma
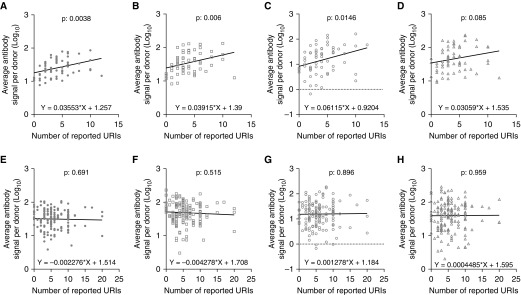
Linear regression was used to investigate the relationship between RV antibody signal and number of reported URIs for a time window of 12 months before inclusion in the study (Figure 3). URI data were available for 64 of 72 healthy donors and 160 of 163 patients with asthma. RV antibody signal increased linearly with the number of reported URIs in healthy donors (Figure 3A), but not in patients with asthma (Figure 3E). This was observed in all RV species (Figures 3B–3D and 3F–3H). Patients with asthma who reported no or few URIs during the last 12 months had RV antibody signals at the same level as healthy patients with multiple URIs (see Figure E5). Moreover, patients with asthma reporting no URIs (mean, 1.650; SD, 0.18) during the past year exhibited significantly higher P = 0.0001) RV antibody signal than healthy donors with no history of URIs (mean, 1.036; SD, 0.04).
Figure 3.
Correlation of rhinovirus (RV) antibody signal levels and reported upper respiratory tract infection (URI). RV antibody levels were linearly and positively correlated with the number of URIs in healthy donors (A) but not in patients with asthma (E). In healthy donors, RV-A (B)–, RV-B (C)–, and RV-C (D)–specific signal increased linearly with increasing number of URIs. In patients with asthma, none of the RV-A (F)–, RV-B (G)–, or RV-C (H)–specific signal was correlated with the number of URIs. Differences were significant at the 0.05 level (linear regression).
Association between RV Antibody Levels and Lower Respiratory Infections
Donors were grouped based on the number of lower respiratory infections (LRIs; LRI = 0 and LRI > 1). In healthy participants, only RV-B–specific antibody levels were significantly lower (unpaired Student’s t test with Welch correction, P = 0.0269) in children with more than one LRI in the previous year (mean, 0.7449; SEM ± 0.155; n = 6) compared with children with no reported LRIs (mean, 1.216; SEM ± 0.07052; n = 58). RV-A–specific antibody levels were elevated in children with no LRIs (mean, 1.616; SEM ± 0.03916; n = 58) compared with children with more than one LRI (1.433 ± 0.1418; n = 6) but did not reach statistical significance. No differences were observed in patients with asthma.
Association between RV Antibody Levels and Susceptibility to the Spread of URIs to the Lower Respiratory Tract
We have performed nonparametric correlation of the number of URIs (mean, 5.762; SEM ± 0.304) and LRIs (mean, 1.306; SEM ± 0.193) in the asthma group (n = 160) using Spearman test. The variables were negatively correlated (r = −0.280; P = 0.000). We explored the effect of RV antibody levels on the URIs versus LRIs correlation. RV-A antibody levels as a cofactor did not affect the negative correlation (r = −0.321; P = 0.000). The same applied for RV-B antibody levels (r = −0.325; P = 0.000) and RV-C (r = −0.326; P = 0.000). Age did not affect the negative correlation (r = −0.315; P = 0.000). In the healthy group (n = 64) the correlation between URIs (mean, 4.109; SEM ± 0.335) and LRIs (mean, 0.109; SEM ± 0.045) was not significant (r = −0.158; P = 0.212).
In children with asthma, RV-A and RV-C, but not RV-B, antibody levels positively correlate with the number of asthma-related episodes
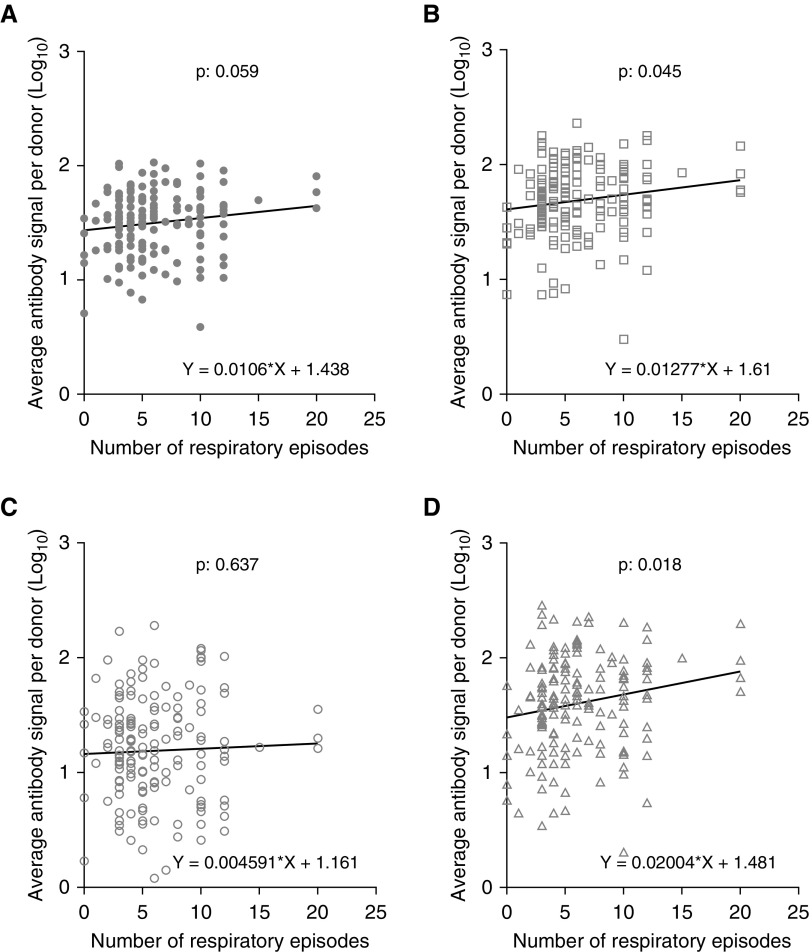
The relation of RV antibody levels and the reported events of lower respiratory symptomatology for the past 12 months were investigated (Figure 4). Data regarding the number of respiratory episodes were available for 160 out of 163 patients with asthma. The RV-A (Figure 4B)– and RV-C (Figure 4D)–specific signal were positively correlated with the number of wheeze episodes. The correlations were not affected by the number of reported URIs.
Figure 4.
Evaluation of rhinovirus (RV) antibody signal levels and reported asthma-related episodes in patients with asthma. RV-A (B)– and RV-C (D)–specific antibody levels were linearly and positively correlated with the number of previous wheeze episodes. No correlation was observed for the total RV (A)- and RV-B (C)–specific antibody levels. Correlations were significant at the 0.05 level (linear regression).
Correlation of RV Antibody Levels with Asthma Severity
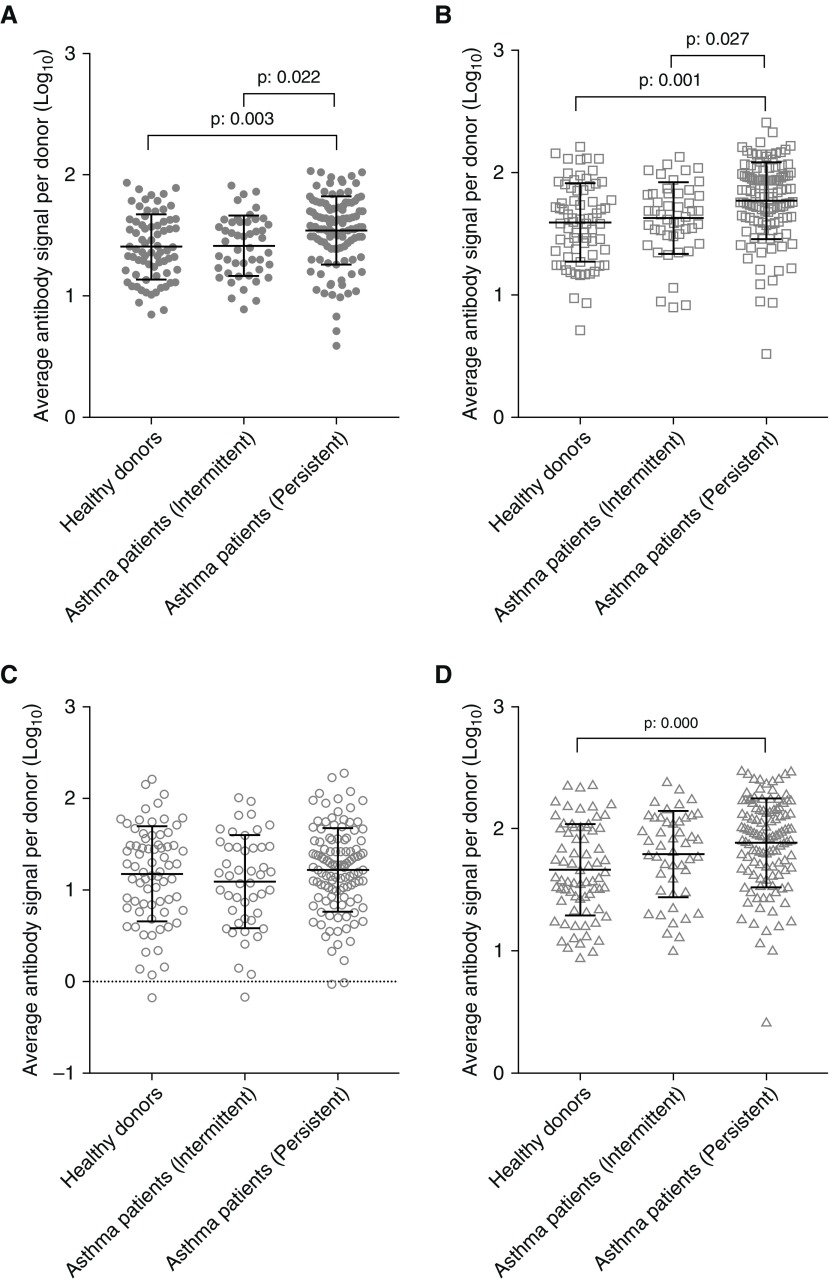
Children with asthma were characterized by the clinical investigators as intermittent (n = 47) or persistent (n = 115) (GINA). Higher RV antibody signal levels were present in children with persistent asthma (95% CI, 1.486–1.591) than in children with intermittent asthma (95% CI, 1.340–1.486) (Figure 5A). This was also the case for RV-A–specific antibody signal (persistent 95% CI, 1.713–1.829; intermittent 95% CI, 1.545–1.716) (Figure 5B). RV-C–specific antibody signal was higher in persistent asthma in comparison with healthy control subjects (95% CI, 1.820–1.955 vs. 95% CI, 1.577–1.753), but not in comparison with intermittent asthma (Figure 5D). No significant differences were observed between the groups in relation to RV-B (Figure 5C). Classification of the participants into the three groups based on their antibody profiles was also investigated through discriminant function analysis (see Figure E6).
Figure 5.
Differential levels of rhinovirus (RV) antibodies in patients with intermittent and persistent asthma. Children with more severe asthma have higher total RV (A)- and RV-A (B)–specific antibody levels than children with intermittent asthma. (D) RV-C–specific antibody levels were higher only in subjects with severe asthma when compared with healthy control subjects. (C) No differences were observed in RV-B–specific antibody levels. Differences were significant at the 0.05 level using ANOVA with post hoc Tukey test.
RV Antibody Levels Are Not Related to Current Asthma Control
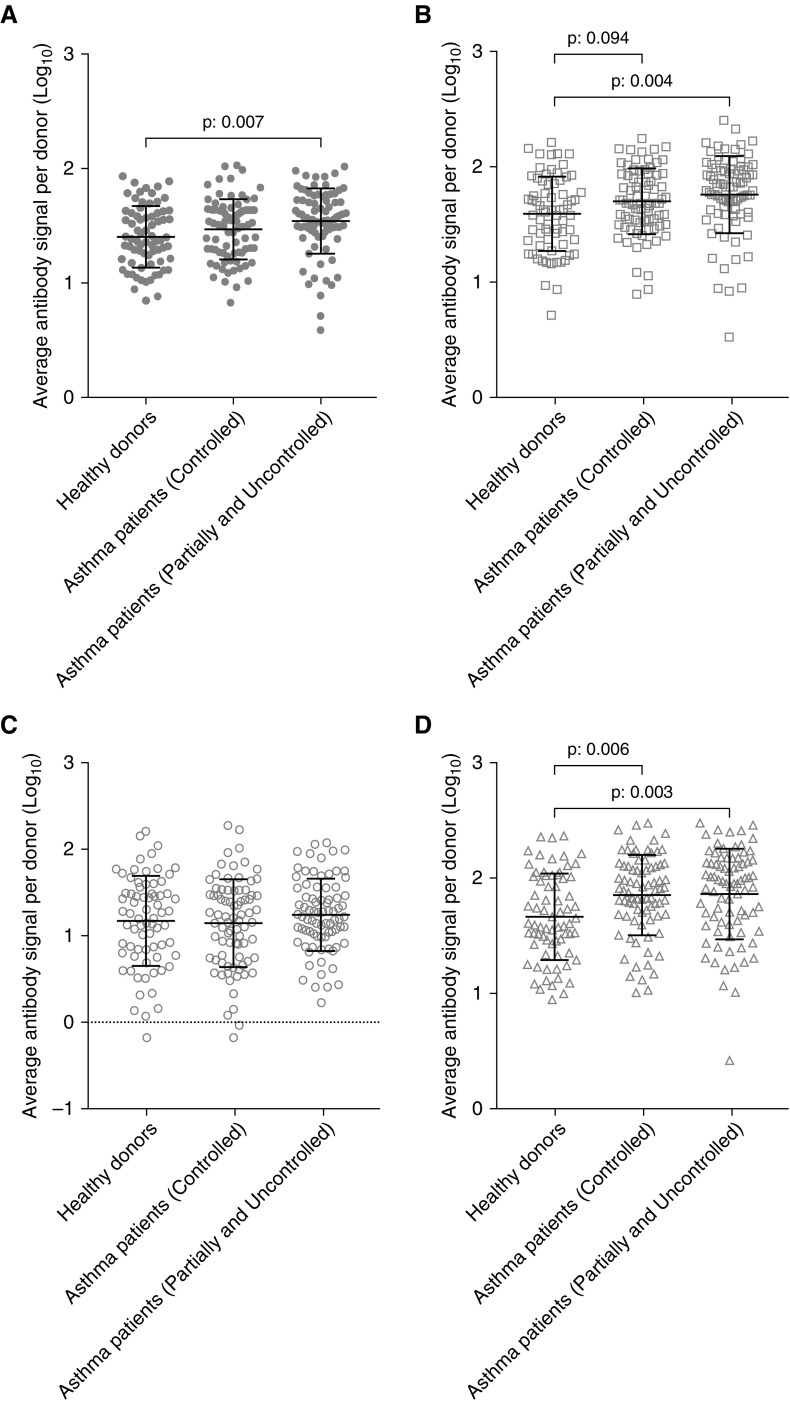
Patients with asthma were grouped based on disease control into controlled (n = 80) and partially controlled/uncontrolled (n = 81). No differences in antibody levels were observed between controlled and uncontrolled asthma in any RV group (Figure 6). Patients with not-well-controlled asthma at the time of inclusion (95% CI, 1.478–1.604) had significantly higher RV antibody signal than healthy donors (95% CI, 1.342–1.468) (Figure 6A). The RV-A–specific antibody signal was significantly higher in patients with partially controlled and uncontrolled asthma (95% CI, 1.686–1.835) than in healthy donors (95% CI, 1.518–1.669) (Figure 6B), and slightly increased in children with well-controlled asthma (95% CI, 1.637–1.764). RV-C–specific signal was significantly higher in partially controlled–uncontrolled (95% CI, 1.770–1.949) and well-controlled (95% CI, 1.777–1.931) children with asthma than in healthy donors (95% CI, 1.577–1.753) (Figure 6D). No significant differences were observed in RV-B–specific antibody signal (Figure 6C).
Figure 6.
Rhinovirus (RV) antibody levels in patients with asthma with different disease control. Data are presented for RV (A)-, RV-A (B)–, RV-B (C)–, and RV-C (D)–specific peptides. Differences were significant at the 0.05 level using ANOVA with post hoc Tukey test.
Seasonal variation in RV antibody levels is observed only in healthy children
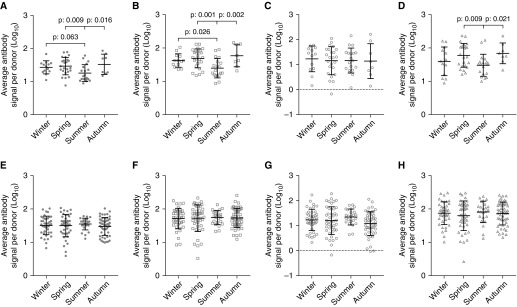
The RV antibody signal was analyzed based on the season of inclusion to the study (Figure 7). In healthy donors, significant differences were observed among children of whom samples were obtained during summer (Figure 7A). This variation was evident in the RV-A (Figure 7B) and RV-C (Figure 7D) species–specific antibody signal, but not in RV-B (Figure 7C). No seasonal variation was observed in antibody levels of patients with asthma (Figures 7E–7H).
Figure 7.
Seasonal variation in rhinovirus (RV) antibody signal levels. (A and E) Total RV; (B and F) RV-A; (C and G) RV-B; (D and H) RV-C. (A–D) Healthy children. (E–H) Patients with asthma. RV (A), RV-A (B), and RV-C (D) antibody levels in healthy children differ between seasons. In patients with asthma, no fluctuation of RV antibodies was observed (E–H). Differences were significant at the 0.05 level, ANOVA with post hoc Tukey test.
Atopic Status Does Not Affect RV Antibody Levels
Patients with asthma were stratified as atopic (n = 81) and nonatopic (n = 79) and the average antibody signal per donor was compared using Welch t test (see Figure E7). No differences were observed between the two groups in RV-A (A.), RV-B (D.), and RV-C (G.) Patients were further stratified based on the number of previously reported LRIs (LRI = 0 and LRI > 1). No differences were observed in RV-A antibody levels in patients with and without atopy with LRI = 0 (B.) and LRI > 1 (C.). No differences were observed in RV-B antibody levels in patients with and without atopy with LRI = 0 (E.) and LRI > 1 (F.). No differences were observed in RV-C antibody levels in patients with and without atopy with LRI = 0 (E.). Patients with atopy with LRI > 1 had increased RV-C antibody levels compared with patients without atopy with LRI > 1 (I.). Atopy was not related to the number of upper (ExpB = 1.046; P = 0.282) or lower (ExpB = 1.025; P = 0.874) respiratory infections tested with binary regression.
Discussion
This study provides several novel insights into the RV-specific antibody repertoire of preschool children, in both health and asthma. 1) A clear differential of RV species antibody levels was demonstrated in this multinational cohort (see Figure E8), in both health and asthma. 2) Asthma is characterized by higher levels of antibodies to RV-A and RV-C, but not RV-B, suggesting differential susceptibility to these species. 3) RV antibody levels reflect the number of common colds in healthy children, and wheeze episodes in children with asthma. 4) In the asthma group, the number of URIs was negatively correlated with the number of LRIs. This observation was not affected by RV species–specific antibody levels. 5) RV antibody levels correlate with asthma severity but not with current asthma control, suggesting accumulation over longer periods of time. 6) The presence of atopy does not affect RV antibody levels.
A newly developed technology was used that allows the measurement of 130 different RV proteins and peptides providing unprecedented power of analysis. This allowed a data-driven identification of species-specific and mixed (cross-reactive) antibodies using a combination of phylogenetic and unsupervised clustering to discriminate between expected and observed specificity. Subsequently, RV-A, RV-B, and RV-C species–specific peptides were used to identify differences between patients with asthma and healthy control subjects.
The antibody signal follows closely the degree of sequence homology (i.e., RV-A > RV-C > RV-B). Robust signal was generated against peptides derived from the VP1 region of all three RV species further confirming our earlier finding that the N terminus of VP1 represents a major epitope of RV-specific antibodies (19, 24). It has long been thought that RV antibodies cause a large change to the structure of the viral coat, which neutralizes the virus and stops infectivity (25). However, we have shown that the viral capsid is dynamic and undergoes uncoating when RV is bound to ICAM-1, thus exposing the normally inaccessible N terminus of VP1 and misdirecting the antibody response (19, 24).
Antibody levels against RV species were significantly different, with RV-C > RV-A > RV-B, in patients with asthma. RV-A and RV-C antibodies were higher than RV-B in healthy donors. A previous report has suggested that total and specific RV-A IgG1 titers are higher than both RV-B and RV-C (17) and the species-specific titers to RV-C are extremely low in children with and without asthma, although they both have high RV-C titers to cross-reactive RV-A and RV-C antigens. Differential detection of antibody levels against the three RV species may be attributed to differential exposure, differential immune response, and the ability to analyze a diverse repertoire of strains and epitopes. First, RV-C species exhibit higher within-group diversity than A and B species (9), suggesting that exposure to a certain RV-C strain might not influence the immune response against other RV-C strains. This is further supported by the lack of difference between RV-A and RV-C in our healthy control subjects. Second, our recent observations associating RV-A and RV-C antibody levels with more severe asthma outcomes and respiratory symptomatology, suggests a correlation of antibody response and immune status. Finally, we have analyzed a diverse collection of RV proteins and peptides, with only a few overlaps with the Iwasaki study (17) investigating antibody levels against RV in asthma; 14 RV-A (one common: A01B), nine RV-B (two common: B14, B69), and two RV-C (none common).
Children with asthma have higher RV-total and RV-A and RV-C species–specific antibodies than healthy children without asthma. Iwasaki and coworkers (17) also reported similar differences (higher RV-total, RV-A, and to a lesser extent RV-B) when comparing antibody levels in children with asthma during an exacerbation, with healthy control subjects. Furthermore, we have also previously observed increased VP1-specific IgG1 levels in adults with asthma (age 19–54 yr) (21). It seems that starting from at least the preschool years, patients with asthma develop high levels of antibodies against specific RV species A and C. In a responder analysis, many more patients with asthma than healthy participants are high responders to RV-A, RV-C, and RV-A/C mixed peptides. The differential antibody response to RV subtypes, paralleling their reported clinical impact in asthma, and the apparent lack of overall antibody-mediated protection from respiratory morbidity in asthma, points toward the innate immunity as the key limiting factor of RV virulence (26, 27): a defective innate response to RV-A and RV-C in asthma may explain both the higher levels of antibodies and increased morbidity from these viruses (28). Indeed, it was recently demonstrated that children, independent of their asthma status, have a competent CD4+ T-cell recall response to RV-A and RV-C (29).
In asthma, increased number of URIs was correlated with decreased number of LRIs but was not mediated by RV antibody levels. Moreover, RV antibody levels did not correlate with the number of URIs or LRIs as in the healthy group. Importantly, children with asthma reported significantly higher number of upper and LRIs compared with healthy children (23). In healthy children, RV antibody levels were robustly correlated with the number of reported respiratory infections in the last 12 months, in a linear manner. Children with LRIs > 1 had significantly lower RV-B and slightly decreased RV-A antibody levels. Unfortunately, the small number of LRIs did not allow robust characterization of URIs and LRIs and RV antibodies.
We believe that in healthy children RV antibody accumulation is akin to the number of RV infections and protective from reinfection and spread to the lower tract. Therefore, in this asthma age group, RV antibodies accumulate without conferring (at least clinically relevant) cross-protection. In contrast, RV antibodies in patients with asthma correlated with previous wheeze episodes. This may be caused by different kinetics of antibody accumulation in this population (i.e., children with asthma may have already accumulated high levels of RV antibodies at earlier times and are now expanding their repertoire only after more severe infections, associated with wheeze), and/or symptom interpretation in children with asthma: it is possible that several of the events identified as URI may be in fact triggered by other factors.
Whether patients with asthma have more URIs than normal individuals is still disputed, because it is possibly confounded by different symptom thresholds in asthmatic versus normal populations (4, 6). It is clear, however, that people with asthma suffer from more frequent LRIs and have more severe and longer-lasting LRT symptoms (30). In a cohort of younger children sampled during an acute episode of wheeze Stenberg-Hammar and coworkers (18) demonstrated that more respiratory symptoms were significantly associated with increases in RV-A- and RV-C–specific IgG1. Moreover, RV-B–specific antibody levels showed a tendency to be negatively correlated with the number of reported LRIs in healthy participants but not in patients with asthma, and in the small number of healthy children that had an LRI, RV antibody levels were significantly lower than those who did not.
In consequence, RV antibodies were also associated with asthma severity in our cohort, with children with persistent asthma having higher levels of RV-A and RV-C antibodies than those with intermittent disease. It is reasonable that patients with more severe disease had accumulated larger amount of RV antibodies because of a higher number of previous infections. It should be noted that children with severe persistent asthma were excluded from the study. In contrast, asthma control, reflecting disease activity 1 month before the antibody sampling, was not significantly correlated to RV antibody levels, even though there was a tendency of higher RV-A and -C antibodies in subjects with asthma with not well controlled disease.
Seasonality was not pronounced; however, total RV, RV-A, and RV-C antibody levels of healthy children were at their lowest during the summer, consistent with the epidemiology of RVs and the understanding of RV antibody production kinetics (15, 31, 32). However, this was not the case in patients with asthma suggesting an absence of correlation between RV antibody levels and RV epidemiology in this age group.
Currently no models exist that can explain how preexisting antibodies may affect the generation of protective responses to RV as a faction of the number of respiratory infections and/or infecting RV strain and if this may potentially be altered in asthma. Our findings can be summarized in a hypothetical graph based on the epitope masking model (see Figure E9) (33). Longitudinal studies, such PreDicta, are in great need to understand the buildup and extent of the RV antibody repertoire in health and asthma.
The major strengths of the study are the high number of proteins and peptides used, the unsupervised data-driven approach to discriminate between RV species–specific and mixed signal, the multicenter/multinational setting, the narrow range of age, and the exclusion of extreme asthma severity cases. A limitation in this study is the retrospective reporting of events, either infections or wheeze episodes, which may suffer from recall bias. However, the robustness of the correlation between reported URI and antibody levels in healthy children suggests that this is not the case, at least in this group. Nevertheless, it is possible that the interpretation of respiratory symptoms in subjects with asthma, particularly in persistent cases, is not easy and can underpin the lack of association in this group. In contrast, wheezing episodes are conceivably more memorable in asthma cases.
In conclusion, we have used the novel PreDicta RV antibody chip to characterize the species-specific antibody repertoire of preschool-age children with and without asthma. In health, RV antibodies reflect previous URIs, whereas in asthma they reflect previous episodes of wheeze and disease severity. There are clear differences in RV antibody levels between normal children and children with asthma, and within the asthmatic population, suggesting that these measurements could be further explored as potential biomarkers. The humoral immune response to RV subgroups is variable with higher levels of RV-C and RV-A antibodies; however, there is no apparent protection with increasing levels of antibodies. Longitudinal trajectories of RV antibody levels over time, in association with disease activity, will provide further insights on their role in disease progression.
Footnotes
Supported by the European Commission’s Seventh Framework program (260895 [PREDICTA]), by the Austrian Science Fund (project P29398-B30), and by research grants from Biomay AG and Viravaxx AG, Vienna, Austria.
Author Contributions: N.G.P., R.V., S.M., and K.N. contributed to the conception and design of the work. K.N., C.C., P.W., P.X., M.L.K., T.J., C.B., S.F., S.S., A.L.-P., H.L., N.Z., T.Z., F.S., A.N., M.A., E.A., N.G.P., and R.V. contributed to the acquisition of the data. S.M. analyzed the data. S.M. and N.G.P. interpreted the data. S.M. and N.G.P. drafted the work. S.M., K.N., R.V., and N.G.P. revised the final draft. All authors approved the final version to be published and agreed to be accountable for all aspects of the work in ensuring that questions related to the accuracy or integrity of any part of the work are appropriately investigated and resolved.
This article has an online supplement, which is accessible from this issue's table of contents at www.atsjournals.org.
Originally Published in Press as DOI: 10.1164/rccm.201803-0575OC on August 22, 2018
Author disclosures are available with the text of this article at www.atsjournals.org.
References
- 1.Eder W, Ege MJ, von Mutius E. The asthma epidemic. N Engl J Med. 2006;355:2226–2235. doi: 10.1056/NEJMra054308. [DOI] [PubMed] [Google Scholar]
- 2.Guibas GV, Megremis S, West P, Papadopoulos NG. Contributing factors to the development of childhood asthma: working toward risk minimization. Expert Rev Clin Immunol. 2015;11:721–735. doi: 10.1586/1744666X.2015.1035649. [DOI] [PubMed] [Google Scholar]
- 3.Papadopoulos NG, Christodoulou I, Rohde G, Agache I, Almqvist C, Bruno A, et al. Viruses and bacteria in acute asthma exacerbations: a GA2 LEN-DARE systematic review. Allergy. 2011;66:458–468. doi: 10.1111/j.1398-9995.2010.02505.x. [DOI] [PMC free article] [PubMed] [Google Scholar]
- 4.Busse WW, Lemanske RF, Jr, Gern JE. Role of viral respiratory infections in asthma and asthma exacerbations. Lancet. 2010;376:826–834. doi: 10.1016/S0140-6736(10)61380-3. [DOI] [PMC free article] [PubMed] [Google Scholar]
- 5.Jackson DJ, Gangnon RE, Evans MD, Roberg KA, Anderson EL, Pappas TE, et al. Wheezing rhinovirus illnesses in early life predict asthma development in high-risk children. Am J Respir Crit Care Med. 2008;178:667–672. doi: 10.1164/rccm.200802-309OC. [DOI] [PMC free article] [PubMed] [Google Scholar]
- 6.Xepapadaki P, Papadopoulos NG, Bossios A, Manoussakis E, Manousakas T, Saxoni-Papageorgiou P. Duration of postviral airway hyperresponsiveness in children with asthma: effect of atopy. J Allergy Clin Immunol. 2005;116:299–304. doi: 10.1016/j.jaci.2005.04.007. [DOI] [PMC free article] [PubMed] [Google Scholar]
- 7.Papadopoulos NG, Xepapadaki P, Mallia P, Brusselle G, Watelet JB, Xatzipsalti M, et al. Mechanisms of virus-induced asthma exacerbations: state-of-the-art. A GA2LEN and InterAirways document. Allergy. 2007;62:457–470. doi: 10.1111/j.1398-9995.2007.01341.x. [DOI] [PMC free article] [PubMed] [Google Scholar]
- 8.Ritchie AI, Farne HA, Singanayagam A, Jackson DJ, Mallia P, Johnston SL. Pathogenesis of viral infection in exacerbations of airway disease. Ann Am Thorac Soc. 2015;12:S115–S132. doi: 10.1513/AnnalsATS.201503-151AW. [DOI] [PubMed] [Google Scholar]
- 9.Palmenberg AC, Spiro D, Kuzmickas R, Wang S, Djikeng A, Rathe JA, et al. Sequencing and analyses of all known human rhinovirus genomes reveal structure and evolution. Science. 2009;324:55–59. doi: 10.1126/science.1165557. [DOI] [PMC free article] [PubMed] [Google Scholar]
- 10.Palmenberg AC, Gern JE. Classification and evolution of human rhinoviruses. Methods Mol Biol. 2015;1221:1–10. doi: 10.1007/978-1-4939-1571-2_1. [DOI] [PMC free article] [PubMed] [Google Scholar]
- 11.McIntyre CL, McWilliam Leitch EC, Savolainen-Kopra C, Hovi T, Simmonds P. Analysis of genetic diversity and sites of recombination in human rhinovirus species C. J Virol. 2010;84:10297–10310. doi: 10.1128/JVI.00962-10. [DOI] [PMC free article] [PubMed] [Google Scholar]
- 12.Briese T, Renwick N, Venter M, Jarman RG, Ghosh D, Köndgen S, et al. Global distribution of novel rhinovirus genotype. Emerg Infect Dis. 2008;14:944–947. doi: 10.3201/eid1406.080271. [DOI] [PMC free article] [PubMed] [Google Scholar]
- 13.Bochkov YA, Gern JE. Clinical and molecular features of human rhinovirus C. Microbes Infect. 2012;14:485–494. doi: 10.1016/j.micinf.2011.12.011. [DOI] [PMC free article] [PubMed] [Google Scholar]
- 14.Bonnelykke K, Coleman AT, Evans MD, et al. CDHR3 genetics and rhinovirus C respiratory illnesses. Am J Respir Crit Care Med. 2018;197:589–594. doi: 10.1164/rccm.201705-1021OC. [DOI] [PMC free article] [PubMed] [Google Scholar]
- 15.Barclay WS, al-Nakib W, Higgins PG, Tyrrell DA. The time course of the humoral immune response to rhinovirus infection. Epidemiol Infect. 1989;103:659–669. doi: 10.1017/s095026880003106x. [DOI] [PMC free article] [PubMed] [Google Scholar]
- 16.Iwasaki J, Smith WA, Stone SR, Thomas WR, Hales BJ. Species-specific and cross-reactive IgG1 antibody binding to viral capsid protein 1 (VP1) antigens of human rhinovirus species A, B and C. PLoS One. 2013;8:e70552. doi: 10.1371/journal.pone.0070552. [DOI] [PMC free article] [PubMed] [Google Scholar]
- 17.Iwasaki J, Smith WA, Khoo SK, Bizzintino J, Zhang G, Cox DW, et al. Comparison of rhinovirus antibody titers in children with asthma exacerbations and species-specific rhinovirus infection. J Allergy Clin Immunol. 2014;134:25–32. doi: 10.1016/j.jaci.2014.03.014. [DOI] [PubMed] [Google Scholar]
- 18.Stenberg-Hammar K, Niespodziana K, Söderhäll C, James A, Cabauatan CR, Konradsen JR, et al. Rhinovirus-specific antibody responses in preschool children with acute wheeze reflect severity of respiratory symptoms. Allergy. 2016;71:1728–1735. doi: 10.1111/all.12991. [DOI] [PubMed] [Google Scholar]
- 19.Niespodziana K, Stenberg-Hammar K, Megremis S, Cabauatan CR, Napora-Wijata K, Vacal PC, et al. PreDicta chip-based high resolution diagnosis of rhinovirus-induced wheeze. Nat Commun. 2018;9:2382. doi: 10.1038/s41467-018-04591-0. [DOI] [PMC free article] [PubMed] [Google Scholar]
- 20.Papadopoulos NG, Megremis S, Kitsioulis NA, Vangelatou O, West P, Xepapadaki P. Promising approaches for the treatment and prevention of viral respiratory illnesses. J Allergy Clin Immunol. 2017;140:921–932. doi: 10.1016/j.jaci.2017.07.001. [DOI] [PMC free article] [PubMed] [Google Scholar]
- 21.Niespodziana K, Cabauatan CR, Jackson DJ, Gallerano D, Trujillo-Torralbo B, Del Rosario A, et al. Rhinovirus-induced VP1-specific antibodies are group-specific and associated with severity of respiratory Symptoms. EBioMedicine. 2014;2:64–70. doi: 10.1016/j.ebiom.2014.11.012. [DOI] [PMC free article] [PubMed] [Google Scholar]
- 22.Gaido CM, Stone S, Chopra A, Thomas WR, Le Souëf PN, Hales BJ. Immunodominant T-cell epitopes in the VP1 capsid protein of rhinovirus species A and C. J Virol. 2016;90:10459–10471. doi: 10.1128/JVI.01701-16. [DOI] [PMC free article] [PubMed] [Google Scholar]
- 23.Xepapadaki P, Bachert C, Finotto S, Jartti T, Konstantinou GN, Kiefer A, et al. Contribution of repeated infections in asthma persistence from preschool to school age: design and characteristics of the PreDicta cohort. Pediatr Allergy Immunol. 2018;29:383–393. doi: 10.1111/pai.12881. [DOI] [PubMed] [Google Scholar]
- 24.Niespodziana K, Napora K, Cabauatan C, Focke-Tejkl M, Keller W, Niederberger V, et al. Misdirected antibody responses against an N-terminal epitope on human rhinovirus VP1 as explanation for recurrent RV infections. FASEB J. 2012;26:1001–1008. doi: 10.1096/fj.11-193557. [DOI] [PubMed] [Google Scholar]
- 25.Katpally U, Fu TM, Freed DC, Casimiro DR, Smith TJ. Antibodies to the buried N terminus of rhinovirus VP4 exhibit cross-serotypic neutralization. J Virol. 2009;83:7040–7048. doi: 10.1128/JVI.00557-09. [DOI] [PMC free article] [PubMed] [Google Scholar]
- 26.Chen Y, Hamati E, Lee PK, Lee WM, Wachi S, Schnurr D, et al. Rhinovirus induces airway epithelial gene expression through double-stranded RNA and IFN-dependent pathways. Am J Respir Cell Mol Biol. 2006;34:192–203. doi: 10.1165/rcmb.2004-0417OC. [DOI] [PMC free article] [PubMed] [Google Scholar]
- 27.Custovic A, Belgrave D, Lin L, Bakhsoliani E, Telcian AG, Solari R, et al. Cytokine responses to rhinovirus and development of asthma, allergic sensitization, and respiratory infections during childhood. Am J Respir Crit Care Med. 2018;197:1265–1274. doi: 10.1164/rccm.201708-1762OC. [DOI] [PMC free article] [PubMed] [Google Scholar]
- 28.Ritchie AI, Jackson DJ, Edwards MR, Johnston SL. Airway epithelial orchestration of innate immune function in response to virus infection. A focus on asthma. Ann Am Thorac Soc. 2016;13:S55–S63. doi: 10.1513/AnnalsATS.201507-421MG. [DOI] [PubMed] [Google Scholar]
- 29.Gaido CM, Granland C, Laing IA, et al. T-cell responses against rhinovirus species A and C in asthmatic and healthy children. Immun Inflamm Dis. 2018;6:143–153. doi: 10.1002/iid3.206. [DOI] [PMC free article] [PubMed] [Google Scholar]
- 30.Corne JM, Marshall C, Smith S, Schreiber J, Sanderson G, Holgate ST, et al. Frequency, severity, and duration of rhinovirus infections in asthmatic and non-asthmatic individuals: a longitudinal cohort study. Lancet. 2002;359:831–834. doi: 10.1016/S0140-6736(02)07953-9. [DOI] [PubMed] [Google Scholar]
- 31.Lee WM, Lemanske RF, Jr, Evans MD, Vang F, Pappas T, Gangnon R, et al. Human rhinovirus species and season of infection determine illness severity. Am J Respir Crit Care Med. 2012;186:886–891. doi: 10.1164/rccm.201202-0330OC. [DOI] [PMC free article] [PubMed] [Google Scholar]
- 32.Monto AS. The seasonality of rhinovirus infections and its implications for clinical recognition. Clin Ther. 2002;24:1987–1997. doi: 10.1016/S0149-2918(02)80093-5. [DOI] [PMC free article] [PubMed] [Google Scholar]
- 33.Zarnitsyna VI, Lavine J, Ellebedy A, Ahmed R, Antia R. Multi-epitope models explain how pre-existing antibodies affect the generation of broadly protective responses to influenza. PLoS Pathog. 2016;12:e1005692. doi: 10.1371/journal.ppat.1005692. [DOI] [PMC free article] [PubMed] [Google Scholar]


