

Abstract
Background:
Reduced intracortical inhibition is a neurophysiologic finding in focal dystonia that suggests a broader problem of impaired cortical excitability within the brain. A robust understanding of the neurophysiology in dystonia is essential to elucidate the pathophysiology of the disorder and develop new treatments. The cortical silent period (cSP) is a reliable, non-invasive method to measure intracortical inhibition in the primary motor cortex associated with a muscle of interest. In adductor spasmodic dysphonia (AdSD), cSP of the laryngeal motor cortex (LMC) which directly corresponds to the affected musculature, the thyroarytenoid (TA), has not been examined.
Objective:
This work evaluated the cSP of the LMC and the relationship between cSP and functional magnetic resonance imaging (fMRI) blood-oxygen-level dependent (BOLD) activation in people with AdSD (n = 12) compared to healthy controls (CTL, n = 14).
Results:
Shortened LMC cSP were observed bilaterally in people with AdSD vs CTL (F(1, 99) = 19.5226, p < 0.0001), with a large effect size (η2 = 0.1834). Between-group fMRI analysis revealed greater activation in bilateral LMC in the AdSD > CTL contrast as compared to CTL > AdSD contrast. Correlation analysis showed that people with AdSD have positive correlation of left LMC BOLD activation and the cSP. Further, the right LMC cSP lacks either positive or negative associations with BOLD activation. CTL individuals displayed both positive and negative correlations between cSP and BOLD activation in the left LMC. In CTL, the LMC cSP and BOLD activation showed exclusively negative correlations in both hemispheres.
Conclusion:
In AdSD, the cortical activation during phonation may not be efficiently or effectively associated with inhibitory processes, leading to muscular dysfunction. These findings may give insight into the maladaptive cortical control during phonation in people with AdSD.
Keywords: Transcranial magnetic stimulation, Laryngeal motor cortex, Cortical silent period, Adductor spasmodic dysphonia, Thyroarytenoid, laryngeal dystonia
Introduction
Dystonia is a movement disorder characterized by sustained or intermittent muscle contractions causing abnormal, often repetitive, movements, postures, or both. Focal dystonia is a subclassification of dystonia where only one body region is affected, examples include blepharospasm, oromandibular dystonia, cervical dystonia, writer’s cramp (focal hand dystonia), and laryngeal dystonia (spasmodic dysphonia) [1]. A common pathophysiologic feature within these sub-types of focal dystonia is impaired intracortical inhibition and surround inhibition [2,3]. Cortical inhibition can be assessed indirectly with transcranial magnetic stimulation (TMS) paradigms, e.g. short interval intracortical inhibition, inter-hemispheric inhibition and cortical silent period (cSP) [4]. Previous work using TMS has indicated reduced inhibition to be characteristic of focal hand dystonia [5], cervical dystonia [6] and spasmodic dysphonia (in cortical regions corresponding to non-affected muscles) [7].
Adductor spasmodic dysphonia (AdSD) is a primary, adult-onset, focal dystonia affecting intrinsic laryngeal muscles during speech. In AdSD, spasms in the laryngeal thyroarytenoid (TA) affect voluntary control by vocal fold hyperadduction disrupting vowel sounds [8], negatively impacting effective communication, occupation, and social engagement [9]. The pathophysiology of AdSD remains unknown. Studies using neuroimaging techniques have reported impaired brain activation in sensorimotor areas [10,11] and structural abnormalities [12] in AdSD. However, some inconsistencies exist, such as findings of both reduced [10] and increased [11] activity in sensory and/or motor cortices in AdSD using functional magnetic resonance imaging (fMRI). While functional neuroimaging provides valuable information, it is an indirect measure of neural activity and cannot identify the types of neural process being activated during a task, i.e. excitatory or inhibitory processes. Thus, it is difficult to gain insights into the cortical physiology of AdSD with neuroimaging alone.
TMS is a potentially complementary tool to neuroimaging alone, as it adds the evaluation of corticospinal excitability. AdSD studies utilizing TMS to evaluate motor cortex inhibition in hand [7,13] and facial [14] muscles have revealed shortened cSP (i.e., less inhibition) suggesting reduced intracortical inhibition in muscles not directly affected by the disorder. However, the intracortical inhibition of the laryngeal motor cortex (LMC), which directly controls the affected muscles (i.e. TA) in AdSD, has not been investigated. Technically, it is difficult to assess LMC intracortical inhibition because the recording EMG electrodes must be placed into the affected TA muscles. Due to recent advances in TMS techniques [15,16] this investigation is now possible. Thus, the purposes of this study were to (1) compare cortical excitability of the LMC between AdSD and healthy controls (CTL) using TMS, and (2) determine if there is a relationship between intracortical excitability measures (i.e. cSP) and neural activation revealed by fMRI [i.e. beta weight values of the blood-oxygen-level dependent (BOLD) signal]. Our primary hypothesis was that individuals with AdSD would have significantly shorter cSP duration in bilateral LMC and increased BOLD activation in M1 compared to CTL. Our secondary hypothesis was that in AdSD, there would be a negative correlation between LMC cSP and BOLD activation, indicating decreased inhibition.
Materials and methods
Participants
All participants gave written, informed consent, according to the Declaration of Helsinki [17] prior to participating. Sixteen healthy participants in CTL group (51.5 ± 7.7 yrs; 6 females) and thirteen people with AdSD (63.5 ± 5.6 yrs; 8 females) participated in two testing sessions. fMRI was performed on the first day, TMS assessment was performed on the second day. The interval between fMRI and TMS was a maximum of seven days, but for most participants it was one or two days. All participants were screened according to TMS [18] and neuroimaging [19] safety guidelines. TMS findings for eleven of the healthy participants were reported previously in a paper describing the laryngeal TMS methodology [15]. For AdSD, only participants with diagnosis from a laryngolo-gist who met criteria regarding their voice deficit were recruited. Potential participants with AdSD and voice tremor were excluded due to potential confounding pathology. Participants receiving botulinum toxin injections were tested when the effects of the toxin were diminished (1–7 days before re-injection). This study was approved by the Institutional Review Board of the University of Minnesota.
Cortical silent period
For our purposes we refer to the cSP collected from the TA muscle elicited by stimulation over the LMC as the LMC cSP; and refer to the LMC cSP collected from the left and right TA muscles as left TA cSP and right TA cSP respectively. TMS was delivered to the LMC area associated with TA muscle activation according to established parameters [15] using a 70 mm figure-of-eight coil connected to the Bistim2 and 2002 stimulator set (The Magstim Company Ltd, UK). LMC cSP responses were collected as previously reported [15]. Briefly, after skin preparation, fine-wire electrodes (#019–772,800, Nicolet Co., Middleton, WI) were inserted bilaterally into the TA muscles (i.e. vocal folds). TA EMG signals were amplified with a gain of x300 by bi-polar pre-amps (Y03–002, Motion Lab Systems, Inc., Baton Rouge, LA), passed through a bandpass filter (15–2000 Hz), and digitized by a 24-bit analog-to-digital converter (NI9234, National Instruments Co., Austin, TX) in AC coupling mode (0.5Hz) with the sampling rate of 6.4k Hz. All data were collected and stored using a custom data acquisition program written with LabVIEW (V2012, National Instruments, Austin, TX) on a laptop computer (Latitude, Dell Co., Ltd, Round Rock, TX) which was also used to monitor real-time EMG activity. The insertion of the fine-wire electrodes into the target TA muscle was verified with participant vocalization using a short (0.5–1s) phonation task of /i/. Then, peripheral nerve stimulation was applied by placing the TMS coil over the mastoid bone to stimulate the vagas nerve that innervates the TA muscle. Five trials of peripheral stimulation were collected during participant phonation of a sustained /i/ to verify the fine wire electrode insertion in the TA muscle. Coil placement for peripheral nerve stimulation was tangential to the tip of mastoid bone and oriented in a posterior-anterior direction. The center of the coil was located above the mastoid (the exit of vagus nerve from the skull through the jugular foramen) behind the ear. This placement is consistent with previous studies [20,21]. The peripheral stimulation intensity was set to 40% of maximum TMS output. The responses were confirmed by observing the latency of the peripheral stimulation evoked potentials which occurred within a physiologically acceptable range of 3–8 ms after the stimulus. If verification failed, insertion of another fine-wire electrode was conducted until reliable TA EMG responses were observed. During all cortical TMS stimulation trials, participants were instructed to phonate a sustained (2–3s) /i/ at a comfortable pitch and volume. The purpose of this sustained phonation was to generate the cSP in response to TMS. The phonation during cSP testing was not normalized to maximum voluntary volume and pitch due to difficulty of precisely generating these two vocal factors. Participants were instructed to phonate at a comfortable and natural pitch and volume. It is unlikely that cSP values were affected by this lack of standardization, however, as contraction strength of the target muscle does not significantly influence cSP duration [22–27]. Fifty trials of LMC cSP were collected from bilateral TAs in responses to TMS over each hemisphere. Given the bilateral cortical control of the TA muscles, there are consequently four cSP values for each participant: left TA cSP from left hemisphere LMC stimulation, right TA cSP from left hemisphere LMC stimulation, left TA cSP from right hemisphere LMC stimulation and right TA cSP from right hemisphere LMC stimulation. In total, 100 trials of stimulation were delivered with an interstimulus interval of approximately 5–8s. This stimulation pace was selected to prevent vocal fatigue and neuromodulation effects. Real-time EMG was displayed on a screen for the investigator to constantly monitor the status of the electrodes and the TA muscle EMG during the experiment. In participants with AdSD, if a burst of tension was observed, the participant was instructed to relax and the next trial was delayed. The stimulation intensity was determined via the cSP threshold, which was defined as the lowest intensity that can evoke a visible cSP in 3 out of 5 trials [15].
Functional magnetic resonance imaging
A block-design was used to determine BOLD response during the phonation task. Thirteen rest and twelve active blocks (15s each) were interleaved. The task performed involved repeated phonation of /i/ for 0.5s–1s for 15s in the active blocks, and rest for 15s in the rest blocks. Thorough task training was completed prior to data acquisition to insure competence with the task and minimize head or jaw motion. In addition, head motion was minimized using padding and placement of surgical tape across the forehead and nose to provide sensory cues to reduce motion. Participants were instructed to rest comfortably with the mouth slightly open and to not move the lip, tongue or jaw throughout the entire task fMRI scan.
Images were acquired on a 3-Tesla Scanner (Prisma, Siemens Healthineers, Germany) using a 32-channel head coil. T1-weighted structural images were acquired (256 mm × 0.8 mm thick sagittal slices, TE1 = 1.81 ms, TE2 = 3.6 ms, TE3 = 5.39 ms, TE4 = 7.81 ms, TI = 1000 TR = 2500 ms, flip angle = 8). For fMRI, whole brain echo planar functional images were acquired using 208 mm × 2 mm thick axial slices with the following parameters: TE = 37 ms, TR = 800 ms, matrix = 104 mm × 104 mm × 72 mm, multi-band = 8. Imaging data were motion corrected and dewarped within FEAT utility of FMRIB Software Library (FSL, v5.0.1, Analysis Group, FMRIB, Oxford, UK) with the spatial smoothing FWHM parameter of 4 mm. In the individual level general linear model, a 3-column format description of the blocks were used with the convolution of Double-Gamma HRF. All motion correction parameters were regressed out. Images were co-registered with each individual’s T1-weighted structural image and normalized to Montreal Neurological Institute standard space (MNI152).
Data analysis
Only the anatomical MRI was used in the TMS neuronavigation process. All data processing and analysis for TMS and fMRI was completed at the conclusion of the data collection with investigators blinded to group allocation.
For LMC cSP, trials that were contaminated by large TMS artifact were excluded due to difficulty in determining the offset of cSP. Group differences were tested by three-way ANOVA with group (AdSD vs CTL), stimulated hemisphere (left vs right) and TA side (left vs right) as factors. Tukey’s HSD test was used for post-hoc analyses. Significance level was set to p < 0.05 and Bonferroni corrections were used for all tests. Effect size of the three-way ANOVA was evaluated by using the equation of:
According to Cohen’s guidelines, effect size (η2) scale is small: 0.01, medium: 0.059 and large: 0.138 [28].
Between group fMRI BOLD responses were compared by using a fixed model in FEAT higher-level analysis in FSL. For within group correlation between LMC cSP and BOLD activation analysis, average cSP values from bilateral TA responses were calculated and input into the GLM model of FEAT in FSL and used to calculate correlations, within which both positive and negative correlations between cSP duration and beta weight responses of BOLD were calculated. The rationale for the averaging of bilateral TA cSP is the bilateral control of each LMC over the TA muscles. For example, the left LMC cSP was represented by the participant’s average cSP duration from both the left and right TA muscles in response to the same stimulation. Additionally, there was no cSP duration difference noted between TA sides in this or previous work [15]. Given that inhibition level is negatively correlated with cSP duration [4], a positive correlation between BOLD and cSP would suggest that higher BOLD activation corresponds to more inhibition as measured with cSP, whereas a negative correlation would indicate that higher BOLD activation is associated with less inhibition. All MRI analyses were done in the MNI152 standard space with an M1 mask from AFNI software package [29]. Voxel-wise significance was set to p < 0.001. Multiple comparison corrections were carried out using Gaussian random field theory method in FSL. Activations and correlations are discussed related to results within the LMC area as well as general M1 activation. Given that there is no definitive definition of LMC boarders, the region was defined according to the locations reported in previous fMRI and TMS publications [30–33]. Specifically, the LMC area was represented by a sphere with a radius of 5 mm which was centered to the MNI coordinates of: left LMC, (−50,−14,40); and right LMC, (51,−15,41) [32]. Given the difference in age between groups, age was used as a co-variant to regress out potential age effect.
Results
All participants tolerated MRI and TMS procedures with expected mild adverse events related to fine-wire EMG electrode placement, including skin soreness (n = 6), bruising (n = 1) and throat tenderness (n = 3). LMC cSP data were excluded (n = 2 CTL, n = 1 AdSD) or limited to one side only (n = 1 CTL and n = 2 AdSD) due to fine-wire EMG signals. Fourteen healthy (53.0 ± 7.6 yrs; 5 females) and twelve AdSD (63.5 ± 5.6 yrs; 8 females) participants’ data were analyzed. Cortical stimulation intensities and AdSD participants’ symptom of duration information are listed in Table 1. Details of the data exclusion due to stimulation artifact is listed in Supplementary Table 1. A representative sample of the waterfall plot illustrating all 50 trials from one AdSD and CTL participant is illustrated as well as averaged traces demonstrating the cSP is shown in Fig. 1.
Table 1.
Participant information.
| Healthy participants | Adductor spasmodic dysphonia participants | |||||
| ID | TMS intensity | ID | TMS intensity | Symptom duration (month) | ||
| Left hemisphere | Right hemisphere | Left hemisphere | Right hemisphere | |||
| CTL01 | 60 | 60 | SD01 | 60 | 60 | 228 |
| CTL02 | 63 | 63 | SD02 | 70 | 66 | 132 |
| CTL03 | 63 | 63 | SD03 | 72 | 72 | 300 |
| CTL04 | 57 | 61 | SD04 | 55 | 55 | 192 |
| CTL05 | 64 | 65 | SD05 | 65 | 60 | 264 |
| CTL06 | 52 | 52 | SD06 | 60 | 60 | 36 |
| CTL07 | 67 | 58 | SD07 | 65 | 65 | 120 |
| CTL08 | 55 | 52 | SD08 | 63 | 62 | 300 |
| CTL09 | 60 | 60 | SD09 | 52 | 52 | 132 |
| CTL10 | 60 | 60 | SD10 | 55 | 55 | 132 |
| CTL11 | 50 | 52 | SD11 | 55 | 55 | 48 |
| CTL12 | 55 | 50 | SD12 | 48 | 50 | 276 |
| CTL13 | 52 | 52 | ||||
| CTL14 | 50 | 52 | ||||
TMS: transcranial magnetic stimulation. TA: thyroarytenoid.
Fig. 1.

Representative example of TMS evoked responses from one adductor spasmodic dysphonia (AdSD) and one healthy control (CTL) participant. Left: Waterfall plot of all responses from one thyroarytenoid muscle (left TA) evoked from single pulse TMS delivered over the right laryngeal motor cortex. Time 0 represents the TMS artifact. Observable is the resultant motor evoked potential (MEP) and cortical silent period (cSP). Right: The corresponding averaged trace illustrating the cSP values of 53.4 ms from the CTL participant and 42.7 ms from the AdSD participant. TMS: transcranial magnetic stimulation.
Cortical silent period
The primary finding of this study was that the LMC cSP duration in AdSD was significantly shorter than CTL, regardless of which hemisphere was stimulated or the TA side recorded from (F (1,98) = 20.5402, p < 0.0001). This significantly lower intracortical inhibition between groups has a large effect size of η2 = 0.1834 (Fig. 2). No significant difference was detected between hemispheres (F(1, 99) = 0.0219, p = 0.8826), TA side (F(1, 99) = 0.0411, p = 0.8398) or in any interactions between the three factors (Fig. 2). cSP durations and the MEP latency values for peripheral and cortical stimulation are listed in Table 2.
Fig. 2.

Mean cortical silent period (±SD) in AdSD vs CTL. Shortened cSP in laryngeal motor cortex (LMC) was observed in AdSD as compared to CTL. *: p<0.0001. Effect size: η2 = 0.1834. (TA = thyroarytenoid muscle)
Table 2.
Cortical silent period duration and motor evoked potential latency (ms, mean ± SD).
| Measure | Group | Left-H | Right-H | ||
|---|---|---|---|---|---|
| Left TA | Right TA | Left TA | Right TA | ||
| cSP duration | CTL | 51.3 ± 9.2 (n = 13) | 48.9 ± 11.3 (n = 14) | 49.2 ± 11.3 (n = 13) | 49.3 ± 10.7 (n = 14) |
| AdSD | 41.4 ± 9.2(12) | 39.8 ± 9.6 (n = 11) | 39.7 ± 7.7 (n = 12) | 40.7 ± 5.8 (n = 11) | |
| cSP MEP latency | CTL | 15.9 ± 2.6 (n = 13) | 13.3 ± 2.2 (n = 14) | 15.6 ± 2.7 (n = 13) | 13.2 ± 2.1 (n = 14) |
| AdSD | 14.4 ± 2.2 (12) | 13.5 ± 1.8 (n = 11) | 15.7 ± 2.5 (n = 12) | 13.4 ± 1.9 (n = 11) | |
| Left | Right | ||||
| Peripheral latency | CTL | 8.1 ± 2.7 (n = 13) | 6.8 ± 1.4 (n = 14) | ||
| AdSD | 7.0 ± 2.3(11) | 6.6 ± 1.7 (n = 11) | |||
cSP: cortical silent period group. MEP: motor evoked potential. Left-H: left hemisphere stimulation. Right-H: right hemisphere stimulation. TA: thyoarytenoid.
Functional magnetic resonance imaging
The fMRI findings demonstrated differences between groups which revealed greater activation bilaterally in M1 in the AdSD > CTL contrast as compared to CTL > AdSD, meaning there was overall greater cortical activation in people with AdSD vs CTL. The AdSD > CTL activation was evenly distributed between hemisphere; the CTL > AdSD activation was heavily biased to the left LMC as shown in Fig. 3.
Fig. 3.
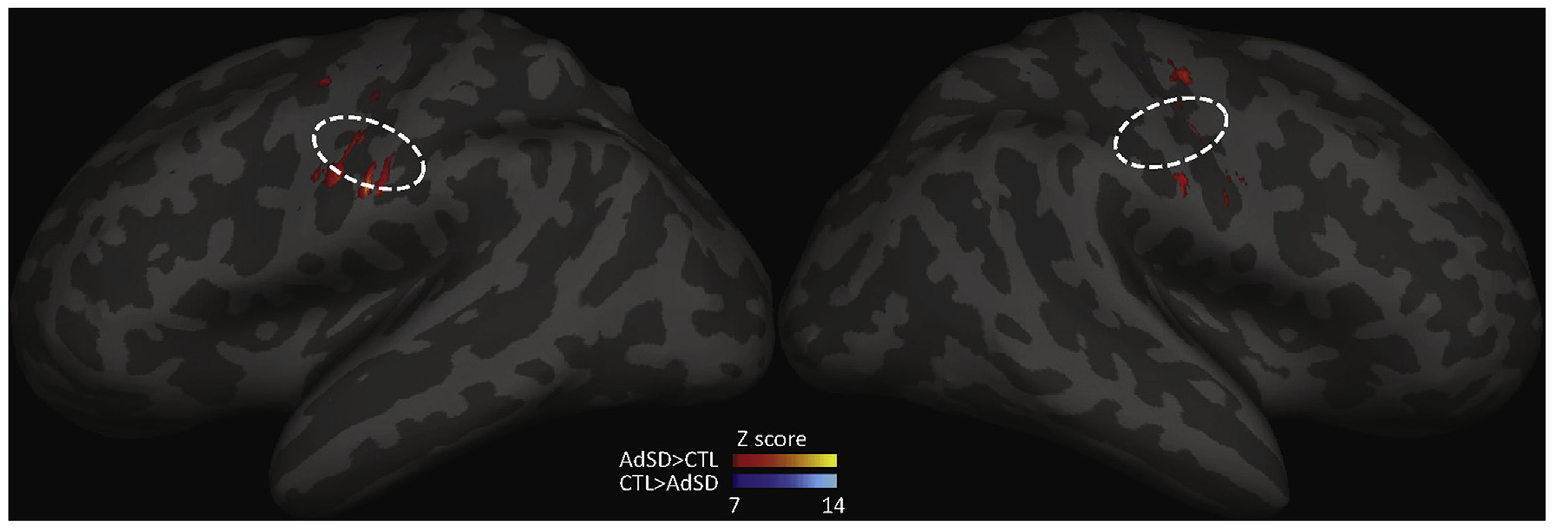
Between group comparisons of fMRI BOLD activation in M1 during phonation. Dashed lines (projection of a circle with a radius of 5mm): estimated LMC area projection on inflated brain surface. Warm colors represent AdSD>CTL, cool colors represent CTL>AdSD. Results indicate greater activation in AdSD vs CTL in LMC area, particularly in the left hemisphere.
Correlation analyses
An exploratory analysis was performed to examine the relationship between individual LMC cSP durations and BOLD beta weight responses in M1 to infer associations between the TMS-derived intracortical inhibition measure and the fMRI-derived ‘activation’ during phonation. Results revealed findings contrary to our hypothesis which postulated that in AdSD there would be a negative association between inhibition and activation, suggesting more BOLD is associated with less inhibition. However, in AdSD, the LMC cSP and BOLD activation were primarily positively correlated and had broader distribution in the right hemisphere. Additionally, there were a sparse number of negatively correlated regions in the left hemisphere. In CTL, the LMC cSP and BOLD activation showed exclusively negative correlations in both hemispheres with broader distribution in the right hemisphere (Fig. 4).
Fig. 4.
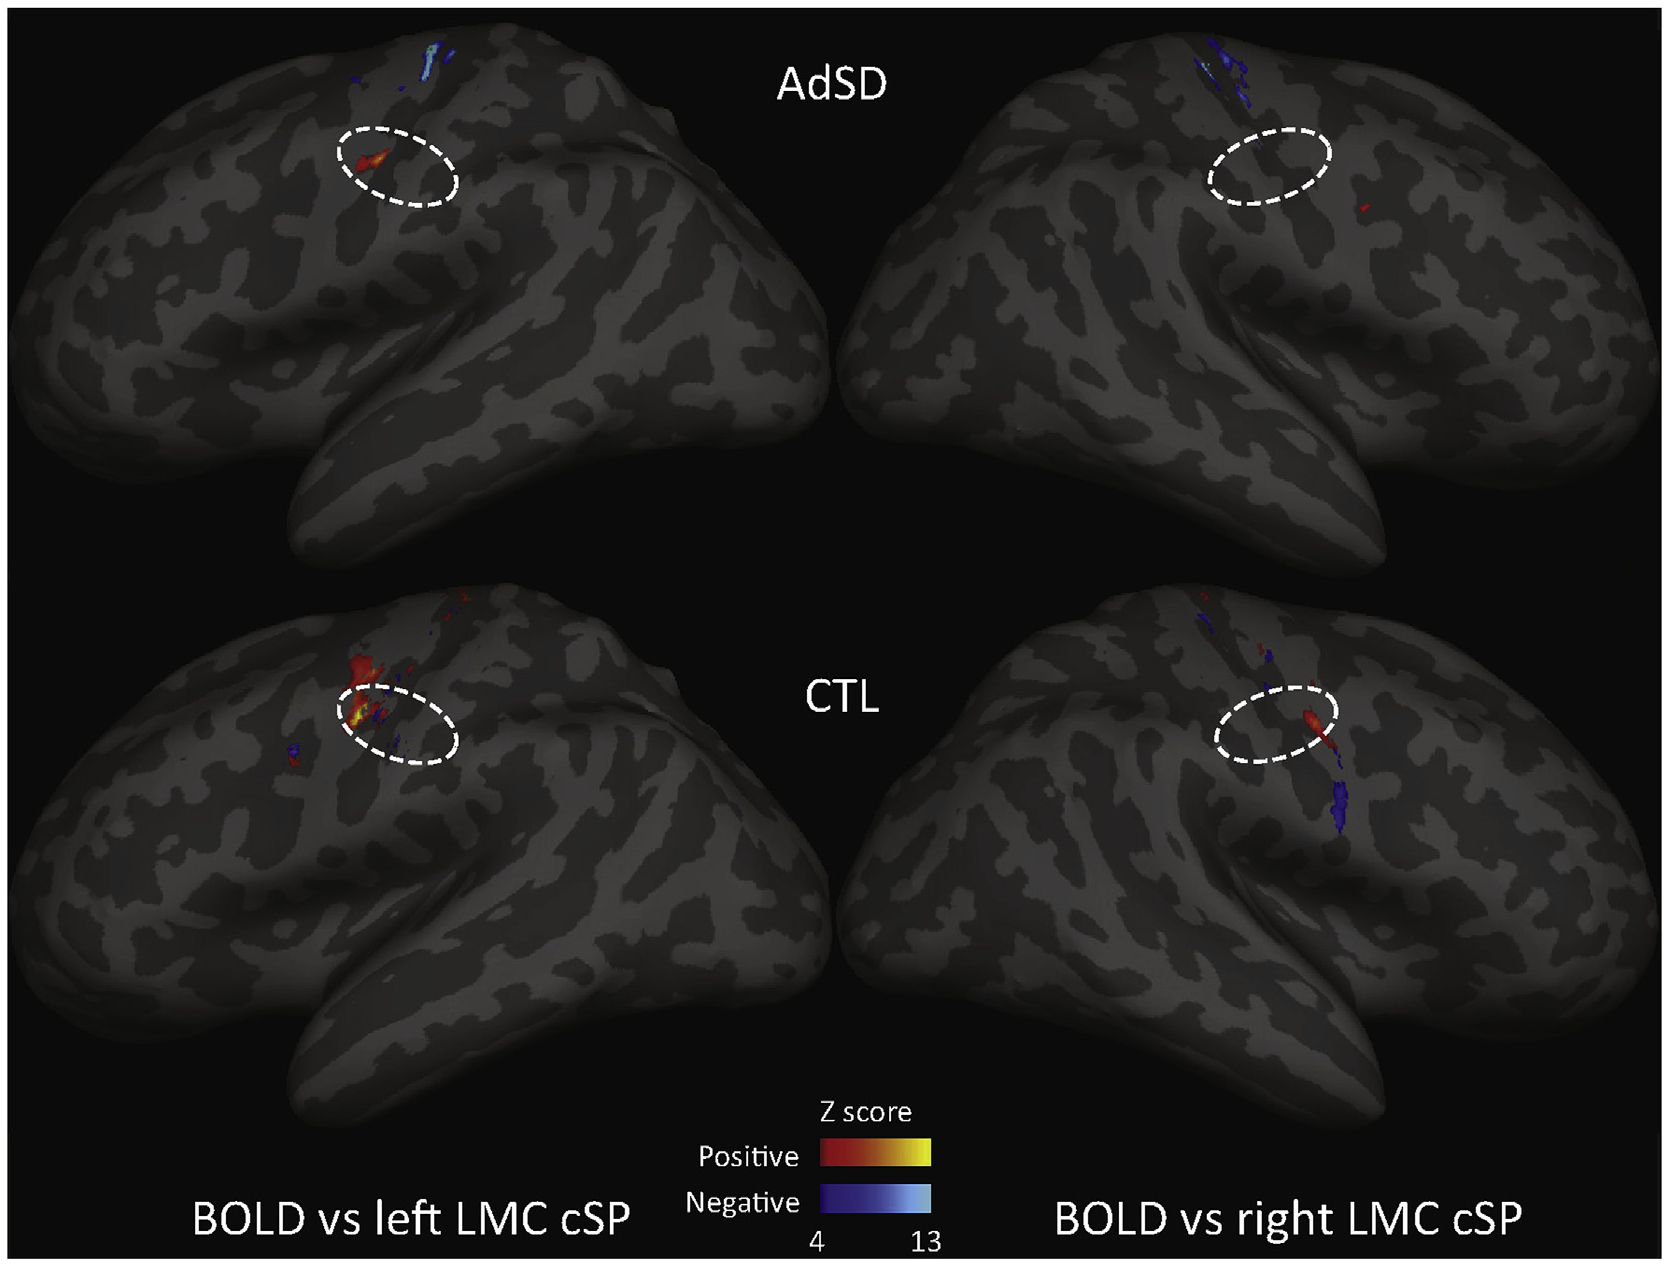
Laryngeal motor cortex (LMC) cortical silent period (cSP) and BOLD activation correlation. In AdSD (top), the cSP were primarily positively correlated with BOLD with significant correlations exclusively in the left LMC. There were negative correlations in the more superior M1 regions not associated with the larynx. In the control group (CTL) (bottom), the cSP displayed both positive and negative correlations with BOLD. There was primarily positive correlations that were stronger in the left vs right. Negative correlations were few and in the left LMC only. Dashed lines (projection of a circle with a radius of 5mm): estimated LMC area projection on inflated brain surface.
Discussion
These results reveal that individuals with AdSD demonstrate significantly shortened cSP durations in the cortical areas corresponding to the affected muscles (TA) compared to CTL. The cSP reflects GABAB receptor mediated inhibitory processes within cortical motor areas [34]. Thus, a shortened cSP indicates a reduced level of intracortical inhibition in LMC. This is the first report of laryngeal cSP in people with AdSD, but results are in alignment with related studies. Shortened cSP collected from hand and masseter have been previously reported in people with AdSD [14]. Therefore, mounting TMS evidence suggests there is insufficient inhibition in laryngeal, facial and hand regions of M1 in AdSD. This impaired inhibition is similar to findings in other types of focal dystonias, e.g. focal hand dystonia [35,36], cervical dystonia [37] and cranial dystonia [38], revealing neurophysiologic commonalities in the disorders.
The phonation task fMRI demonstrated overactivation in AdSD compared to CTL bilaterally in M1, but less activation in the left LMC region. This suggests AdSD has hyperactivity in M1, but not particularly in the phonation motor areas known to be more active in the left hemisphere for voice production [30,32]. These findings agree with a previous whole brain fMRI study that demonstrated overactivation in AdSD vs CTL [12]. Several neuroimaging studies have revealed greater activation in the laryngeal sensorimotor cortex during symptomatic and asymptomatic tasks in people with AdSD [11,12,39–41]; however, the nature of the neural activities measured (i.e., excitatory or inhibitory processes) with BOLD are unknown. Considering that cSP reflects an intracortical inhibitory process [34], the correlation analysis between LMC cSP and BOLD provides an exploratory insight into this mechanism by evaluating the relationship between a known inhibitory measure (i.e. cSP) with BOLD activation.
In the correlation analysis between LMC cSP and M1 BOLD activation, the results demonstrated a distribution between groups that was contrary to our hypothesis: there were mostly positive correlations in bilateral M1 with a few negative correlations in the left M1 in AdSD. Significant correlations within the LMC voxels were almost exclusively positive correlations and in the left hemisphere. This suggests that in people with AdSD, the left LMC has BOLD activation associated primarily with inhibitory (positive correlation) processes, and lacks BOLD activation that is measurably associated, either positively or negatively, with inhibitory process in the right LMC. This demonstrates a nearly complete contrast to the CTL group in which exclusively negative correlations were located in bilateral M1 with broader distribution in the right M1 (Fig. 4). This suggests that in CTL, the neural activity of phonation (as reflected by BOLD) is associated with excitatory processes, due to the negative correlation with inhibitory cSP; while, in AdSD, the neural activity is primarily associated with inhibitory processes. When considered collectively with the task fMRI results, whereby AdSD demonstrated more overall BOLD activation in bilateral M1, but opposite correlations with CTL, it may suggest that, in AdSD, the cortical activity is not efficiently (more BOLD activation) or effectively (opposite correlation) associated with focused inhibitory process.
Surprisingly, in AdSD there was also a positive correlation bilaterally in superior M1 regions, which is difficult to interpret, as these cortical regions are distant from the LMC, were not stimulated to produce the cSP response, and are associated with different body somatotopy, such as the hand or trunk.
The significant correlations between TMS and fMRI suggest an association of brain activities, however these measurements were not collected simultaneously, which is a limitation of this work. The only TMS measure reported in this work was the cSP, which limits our ability to draw conclusions about the neural elements that are related to the cortical hyperactivity observed in the AdSD fMRI group data. This was a necessary limitation due to the inherent tonic activity in the TA muscle, which impairs the ability to perform other TMS outcomes that require a resting or relaxed muscle (i. g. paired pulse measures or a stimulus response curve) [15,16]. Another limitation of this study is the lack of age-matching between groups. This limitation was due to the difficulty in recruiting older healthy participants for fine-wire insertion. It has been reported that untreated AdSD has not been observed to worsen with advancing age, suggesting that it is not a degenerative disorder [42,43]. Furthermore, age was used as a co-variant in the correlation analysis to regress out any potential age effect, thus the effect on our results may be lessened. In this fMRI experiment design, there was no control task to demonstrate that the results are specifically related to spasmodic dysphonia symptoms; however, given that there is a CTL group serving as a contrast in both between-group fMRI difference and within-group TMS and BOLD correlation analysis, this lack of control task may have a minor effect on the results. Future work may explore non-dystonic phonation tasks, such as a whisper, for a control task.
Quality of the fine-wire electrodes insertion was validated by responses to both peripheral and cortical stimulation. The slightly longer latency (3–5 s) of the evoked potentials in left TA compared to the right TA are consistent with previously reported findings given the longer path of the left recurrent laryngeal nerve around the heart [15,44,45] which helped to confirm the validity of the electrode insertion in this work.
Conclusion
This is the first study to report shortened cSP from the LMC in AdSD. This finding, combined with the hyperactivation found during an fMRI phonation task, suggests impaired efficiency and effectiveness of the neural activity related to inhibitory processes during symptomatic phonation tasks in AdSD. Further, other non-symptomatic regions within M1 also displayed hyperactivity, as measured by task fMRI, and may be involved in phonation tasks, either as a compensatory effect or a consequence of AdSD pathology. Overall, these findings advance our understanding of the pathophysiology of AdSD and may suggest potential neuromodulation interventions.
Supplementary Material
Acknowledgements
We acknowledge the support provided by the University of Minnesota’s MnDRIVE (Minnesota’s Discovery, Research and Innovation Economy) initiative, Brain Conditions Program in this work. We thank Yi Ling Kuo for editorial assistance.
Funding
This work was partly supported by the National Institute of Communication Disorders and Deafness, National Institutes of Health (R21DC012344, 1R01DC015216); Research Grants, National Spasmodic Dysphonia Association (NSDA).
Footnotes
Declaration of competing interest
Authors have no conflict of interest to declare.
Appendix A. Supplementary data
Supplementary data to this article can be found online at https://doi.org/10.1016/j.brs.2020.03.003.
References
- [1].Albanese A, Bhatia K, Bressman SB, DeLong MR, Fahn S, Fung VSC, et al. Phenomenology and classification of dystonia: a consensus update. Mov Disord 2013;28:863–73. 10.1002/mds.25475. [DOI] [PMC free article] [PubMed] [Google Scholar]
- [2].Sohn Y, Hallett M. Surround inhibition in human motor system. Exp Brain Res 2004;158:397–404. 10.1007/s00221-004-1909-y. [DOI] [PubMed] [Google Scholar]
- [3].Mink JW. The basal ganglia: focused selection and inhibition of competing motor programs. Prog Neurobiol 1996;50:381–425. [DOI] [PubMed] [Google Scholar]
- [4].Hallett M Transcranial magnetic stimulation: a primer. Neuron 2007;55: 187–99. 10.1016/j.neuron.2007.06.026. [DOI] [PubMed] [Google Scholar]
- [5].Bütefisch CM, Boroojerdi B, Chen R, Battaglia F, Hallett M. Task-dependent intracortical inhibition is impaired in focal hand dystonia. Mov Disord 2005;20:545–51. 10.1002/mds.20367. [DOI] [PMC free article] [PubMed] [Google Scholar]
- [6].Ganos C, Ferré ER, Marotta A, Kassavetis P, Rothwell J, Bhatia KP, et al. Cortical inhibitory function in cervical dystonia. Clin Neurophysiol 2018;129:466–72. 10.1016/J.CLINPH.2017.11.020. [DOI] [PubMed] [Google Scholar]
- [7].Samargia S, Schmidt R, Kimberley TJ. Shortened cortical silent period in adductor spasmodic dysphonia: evidence for widespread cortical excitability, vol. 560; 2014. 10.1016/j.neulet.2013.12.007. [DOI] [PMC free article] [PubMed] [Google Scholar]
- [8].Ludlow CL. Spasmodic dysphonia: a laryngeal control disorder specific to Speech. J Neurosci 2011;31:793–7. 10.1523/JNEUROSCI.2758-10.2011. [DOI] [PMC free article] [PubMed] [Google Scholar]
- [9].Baylor CR, Yorkston KM, Eadie TL. The consequences of spasmodic dysphonia on communication-related quality of life: a qualitative study of the insider’s experiences. J Commun Disord 2005;38:395–419. 10.1016/j.jcomdis.2005.03.003. [DOI] [PMC free article] [PubMed] [Google Scholar]
- [10].Haslinger B, Erhard P, Dresel C, Castrop F, Roettinger M, Ceballos-Baumann AO. “Silent event-related” fMRI reveals reduced sensorimotor activation in laryngeal dystonia. Neurology 2005;65:1562–9. 10.1212/01.wnl.0000184478.59063.db. [DOI] [PubMed] [Google Scholar]
- [11].Simonyan K, Ludlow CL. Abnormal activation of the primary somatosensory cortex in spasmodic dysphonia: an fMRI study. Cerebr Cortex 2010;20: 2749–59. 10.1093/cercor/bhq023. [DOI] [PMC free article] [PubMed] [Google Scholar]
- [12].Simonyan K, Ludlow CL. Abnormal structure-function relationship in spasmodic dysphonia. Cerebr Cortex 2012;22:417–25. 10.1093/cercor/bhr120. [DOI] [PMC free article] [PubMed] [Google Scholar]
- [13].Suppa A, Marsili L, Giovannelli F, Di Stasio F, Rocchi L, Upadhyay N, et al. Abnormal motor cortex excitability during linguistic tasks in adductor-type spasmodic dysphonia. Eur J Neurosci 2015;42:2051–60. 10.1111/ejn.12977. [DOI] [PubMed] [Google Scholar]
- [14].Samargia S, Schmidt R, Kimberley TJ. Cortical silent period reveals differences between adductor spasmodic dysphonia and muscle tension dysphonia. Neurorehabil Neural Repair 2016;30:221–32. 10.1177/1545968315591705. [DOI] [PMC free article] [PubMed] [Google Scholar]
- [15].Chen M, Summers RLS, Goding GS, Samargia S, Ludlow CL, Prudente CN, et al. Evaluation of the cortical silent period of the laryngeal motor cortex in healthy individuals. Front Neurosci 2017;11:88 10.3389/fnins.2017.00088. [DOI] [PMC free article] [PubMed] [Google Scholar]
- [16].Summers RLS, Chen M, Kimberley TJ. Corticospinal excitability measurements using transcranial magnetic stimulation are valid with intramuscular electromyography. PloS One 2017;12:e0172152 10.1371/journal.pone.0172152. [DOI] [PMC free article] [PubMed] [Google Scholar]
- [17].World Medical Association. World medical association declaration of Helsinki. J Am Med Assoc 2013;310:2191 10.1001/jama.2013.281053. [DOI] [PubMed] [Google Scholar]
- [18].Rossi S, Hallett M, Rossini PM, Pascual-Leone A. Safety of TMS Consensus Group. Safety, ethical considerations, and application guidelines for the use of transcranial magnetic stimulation in clinical practice and research. Clin Neurophysiol 2009;120:2008–39. 10.1016/j.clinph.2009.08.016. [DOI] [PMC free article] [PubMed] [Google Scholar]
- [19].Institute of Mental Health N. MRI Research safety and ethics: points to consider. 2005.
- [20].Sims HS, Yamashita T, Rhew K, Ludlow CL. Assessing the clinical utility of the magnetic stimulator for measuring response latencies in the laryngeal muscles. Otolaryngol Head Neck Surg 1996;114:761–7. 10.1016/S0194-5998(96)70099-2. [DOI] [PubMed] [Google Scholar]
- [21].Khedr EM, Aref E-EM. Electrophysiological study of vocal-fold mobility disorders using a magnetic stimulator. Eur J Neurol 2002;9:259–67. 10.1046/j.1468-1331.2002.00394.x. [DOI] [PubMed] [Google Scholar]
- [22].Haug BA, Schönle PW, Knobloch C, Köhne M. Silent period measurement revives as a valuable diagnostic tool with transcranial magnetic stimulation, vol. 85; 1992. 10.1016/0168-5597(92)90081-L. [DOI] [PubMed] [Google Scholar]
- [23].Inghilleri M, Berardelli A, Cruccu G, Manfredi M. Silent period evoked by transcranial stimulation of the human cortex and cervicomedullary junction. J Physiol 1993;466:521–34. [PMC free article] [PubMed] [Google Scholar]
- [24].Roick H, von Giesen HJ, Benecke R. On the origin of the postexcitatory inhibition seen after transcranial magnetic brain stimulation in awake human subjects. Exp Brain Res 1993;94:489–98. 10.1007/BF00230207. [DOI] [PubMed] [Google Scholar]
- [25].Taylor JL, Allen GM, Butler JE, Gandevia SC. Effect of contraction strength on responses in biceps brachii and adductor pollicis to transcranial magnetic stimulation. Exp Brain Res 1997;117:472–8. 10.1007/s002210050243. [DOI] [PubMed] [Google Scholar]
- [26].Wu L, Goto Y, Taniwaki T, Kinukawa N, Tobimatsu S. Different patterns of excitation and inhibition of the small hand and forearm muscles from magnetic brain stimulation in humans. Clin Neurophysiol 2002;113:1286–94. 10.1016/S1388-2457(02)00160-8. [DOI] [PubMed] [Google Scholar]
- [27].Säisänen L, Pirinen E, Teitti S, Könönen M, Julkunen P, Maääattäa S, et al. Factors influencing cortical silent period: optimized stimulus location, intensity and muscle contraction. J Neurosci Methods 2008;169:231–8. 10.1016/j.jneumeth.2007.12.005. [DOI] [PubMed] [Google Scholar]
- [28].Cohen J Statistical power analysis for the behavioral sciences. L. Erlbaum Associates; 1988. [Google Scholar]
- [29].Cox RW. AFNI: software for analysis and visualization of functional magnetic resonance neuroimages. Comput Biomed Res 1996;29:162–73. [DOI] [PubMed] [Google Scholar]
- [30].Brown S, Ngan E, Liotti M. A larynx area in the human motor cortex. Cerebr Cortex 2008;18:837–45. 10.1093/cercor/bhm131. [DOI] [PubMed] [Google Scholar]
- [31].Kumar V, Croxson PL, Simonyan K. Structural organization of the laryngeal motor cortical network and its implication for evolution of Speech production. J Neurosci 2016;36:4170–81. 10.1523/JNEUROSCI.3914-15.2016. [DOI] [PMC free article] [PubMed] [Google Scholar]
- [32].Simonyan K, Ostuni J, Ludlow CL, Horwitz B. Functional but not structural networks of the human laryngeal motor cortex show left hemispheric lateralization during syllable but not breathing production. J Neurosci 2009;29: 14912–23. 10.1523/JNEUROSCI.4897-09.2009. [DOI] [PMC free article] [PubMed] [Google Scholar]
- [33].Turkeltaub PE, Eden GF, Jones KM, Zeffiro TA. Meta-analysis of the functional neuroanatomy of single-word reading: method and validation. Neuroimage 2002;16:765–80. 10.1006/NIMG.2002.1131. [DOI] [PubMed] [Google Scholar]
- [34].Wolters A, Ziemann UBR. The cortical silent period. Oxford Handbook of Transcranial Stimulation In: Epstein Charles M, Wassermann Eric M, UZ, editors. Oxford handb. Transcranial stimul Oxford University Press; 2008. [Google Scholar]
- [35].Kimberley TJ, Schmidt RLS, Chen M, Dykstra DD, Buetefisch CM. Mixed effectiveness of rTMS and retraining in the treatment of focal hand dystonia. Front Hum Neurosci 2015;9:385 10.3389/fnhum.2015.00385. [DOI] [PMC free article] [PubMed] [Google Scholar]
- [36].Kimberley TJ, Borich MR, Schmidt RL, Carey JR, Gillick B. Focal hand dystonia: individualized intervention with repeated application of repetitive transcranial magnetic stimulation. Arch Phys Med Rehabil 2015;96:S122–8. 10.1016/j.apmr.2014.07.426. [DOI] [PMC free article] [PubMed] [Google Scholar]
- [37].Amadio S, Panizza M, Pisano F, Maderna L, Miscio C, Nilsson J, et al. Transcranial magnetic stimulation and silent period in spasmodic torticollis. Am J Phys Med Rehabil n.d.;79:361–368. [DOI] [PubMed] [Google Scholar]
- [38].Currà A, Romaniello A, Berardelli A, Cruccu G, Manfredi M. Shortened cortical silent period in facial muscles of patients with cranial dystonia. Neurology 2000;54:130–5. 10.1212/wnl.54.1.130. [DOI] [PubMed] [Google Scholar]
- [39].Ali SO, Thomassen M, Schulz GM, Hosey LA, Varga M, Ludlow CL, et al. Alterations in CNS activity induced by botulinum toxin treatment in spasmodic dysphonia: an H215O PET study. J Speech Lang Hear Res 2006;49:1127 10.1044/1092-4388(2006/081. [DOI] [PubMed] [Google Scholar]
- [40].Battistella G, Fuertinger S, Fleysher L, Ozelius LJ, Simonyan K. Cortical sensorimotor alterations classify clinical phenotype and putative genotype of spasmodic dysphonia. Eur J Neurol 2016;23:1517–27. 10.1111/ene.13067. [DOI] [PMC free article] [PubMed] [Google Scholar]
- [41].Kiyuna A, Maeda H, Higa A, Shingaki K, Uehara T, Suzuki M. Brain activity related to phonation in young patients with adductor spasmodic dysphonia. Auris Nasus Larynx 2014;41:278–84. 10.1016/j.anl.2013.10.017. [DOI] [PubMed] [Google Scholar]
- [42].ARONSON. AE. Clinical voice disorders 1985. An Interdiscip Approach. [Google Scholar]
- [43].Brodnitz FS. Spastic dysphonia. Ann Otol Rhinol Laryngol 1976;85:210–4. 10.1177/000348947608500205. [DOI] [PubMed] [Google Scholar]
- [44].Thumfart WF, Zorowka P, Pototschnig C, Eckel HE. Electrophysiologic investigation of lower cranial nerve diseases by means of magnetically stimulated neuromyography of the larynx. Ann Otol Rhinol Laryngol 1992;101:629–34. 10.1177/000348949210100801. [DOI] [PubMed] [Google Scholar]
- [45].Khedr EM, Aref E-EM. Electrophysiological study of vocal-fold mobility disorders using a magnetic stimulator. Eur J Neurol 2002;9:259–67. [DOI] [PubMed] [Google Scholar]
Associated Data
This section collects any data citations, data availability statements, or supplementary materials included in this article.