Abstract
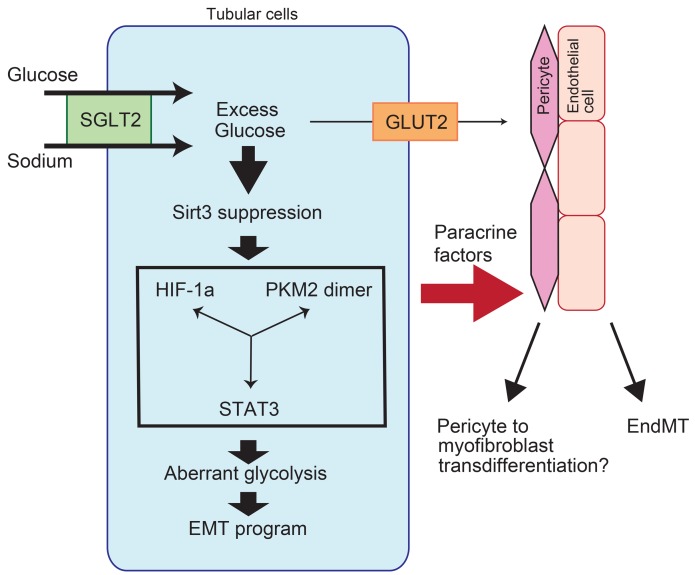
Sodium glucose cotransporter 2 (SGLT2) inhibitors are beneficial in halting diabetic kidney disease; however, the complete mechanisms have not yet been elucidated. The epithelial-mesenchymal transition (EMT) is associated with the suppression of sirtuin 3 (Sirt3) and aberrant glycolysis. Here, we hypothesized that the SGLT2 inhibitor empagliflozin restores normal kidney histology and function in association with the inhibition of aberrant glycolysis in diabetic kidneys. CD-1 mice with streptozotocin-induced diabetes displayed kidney fibrosis that was associated with the EMT at 4 months after diabetes induction. Empagliflozin intervention for 1 month restored all pathological changes; however, adjustment of blood glucose by insulin did not. Empagliflozin normalized the suppressed Sirt3 levels and aberrant glycolysis that was characterized by HIF-1α accumulation, hexokinase 2 induction, and pyruvate kinase isozyme M2 dimer formation in diabetic kidneys. Empagliflozin also suppressed the accumulation of glycolysis byproducts in diabetic kidneys. Another SGLT2 inhibitor, canagliflozin, demonstrated similar in vivo effects. High-glucose media induced the EMT, which was associated with Sirt3 suppression and aberrant glycolysis induction, in the HK2 proximal tubule cell line; SGLT2 knockdown suppressed the EMT, with restoration of all aberrant functions. SGLT2 suppression in tubular cells also inhibited the mesenchymal transition of neighboring endothelial cells. Taken together, SGLT2 inhibitors exhibit renoprotective potential that is partially dependent on the inhibition of glucose reabsorption and subsequent aberrant glycolysis in kidney tubules.
Keywords: Endocrinology, Metabolism
Keywords: Diabetes, Drug therapy, Fibrosis
SGLT2 inhibitors exhibit renoprotective potential that is partially dependent on the inhibition of glucose reabsorption and subsequent aberrant glycolysis in kidney tubules.
Introduction
Diabetic kidney disease (DKD) is the leading cause of end-stage renal disease, but a specific therapy to halt the progression of DKD is not available (1). The most relevant treatments for DKD are renin-angiotensin system inhibitors, such as angiotensin-converting enzyme inhibitors (2) or angiotensin II type 1 receptor blockers (3), but the residual risk of DKD remains a substantial burden. Therefore, there is a significant demand in diabetes research for additional or alternative strategies to combat DKD progression.
Sodium glucose cotransporter 2 (SGLT2) is expressed in the S1 and S2 segments of the kidney proximal tubule. SGLT2 plays a significant role in the reabsorption of glucose filtered from the glomerulus (4). Approximately 90%–95% of filtered glucose in the urine is taken up through SGLT2. The function of SGLT2 in glucose reabsorption and the lack of significant health problems in patients with renal glycosuria who have mutations in the SGLT2 gene have led researchers to develop an SGLT2 inhibitor as an antidiabetic drug that expels glucose into the urine (4).
The EMPA-REG trial demonstrated a breakthrough in both clinical practice and the basic science of diabetic medicine (5). In the renal outcome analysis from the EMPA-REG trial, empagliflozin reduced the hard outcome of renal complications in high-risk diabetic patients (6). The effects of empagliflozin were more prominent in patients with advanced kidney disease than the effects on the early induction of nephropathy (6). The most sophisticated hypothesis to explain the renal benefit of the SGLT2 inhibitor was based on the hemodynamic alteration gained by SGLT2 inhibition. Cherney et al. elegantly demonstrated that the administration of empagliflozin restored the suppressed glomerular filtration rate (GFR) in type 1 diabetic patients, as monitored by inulin clearance only in patients with an increased GFR (7). In the EMPA-REG renal outcome study, cessation of empagliflozin restored the serum creatinine–based estimated GFR levels to pretrial levels, which also suggested the renal hemodynamic effects of SGLT2 inhibition (6). Although empagliflozin treatment has achieved positive renal outcomes, the relevant mechanism by which SGLT2 inhibition halts the progression of DKD is largely unknown. In diabetic patients, the proximal tubule is exposed to immense amounts of glucose though SGLT2-mediated reabsorption (8–10). However, how these amounts of glucose in the proximal tubule affect tubular cell homeostasis has not been elucidated.
The mitochondrial deacetylase sirtuin 3 (Sirt3) is involved in metabolism, the stress response, and longevity (11). Sirt3 deacetylates and then activates mitochondrial enzymes that are involved in fatty acid β-oxidation, amino acid metabolism, electron transport chain activity, and antioxidant defense (11). Sirt3-deficient mice exhibit fibrosis in the organs of several disease models (12, 13). Additionally, Sirt3 deficiency induces HIF-1α overaccumulation in cancer cells, which is associated with aberrant glycolysis through the so-called Warburg effect (14). Furthermore, HIF-1α overexpression in kidney proximal tubular cells results in kidney fibrosis via induction of the epithelial-mesenchymal transition (EMT) (15, 16). In cancer cells, Sirt3 suppression induces HIF-1α accumulation and enhances glycolysis, which are associated with the EMT and cancer metastasis (14, 17).
Here, we hypothesized that SGLT2 inhibition suppresses fibrogenesis in the kidney proximal tubules via suppression of the EMT, which is associated with the restoration of Sirt3 levels and the suppression of aberrant glycolysis.
Results
Empagliflozin suppressed kidney fibrosis in diabetic mice.
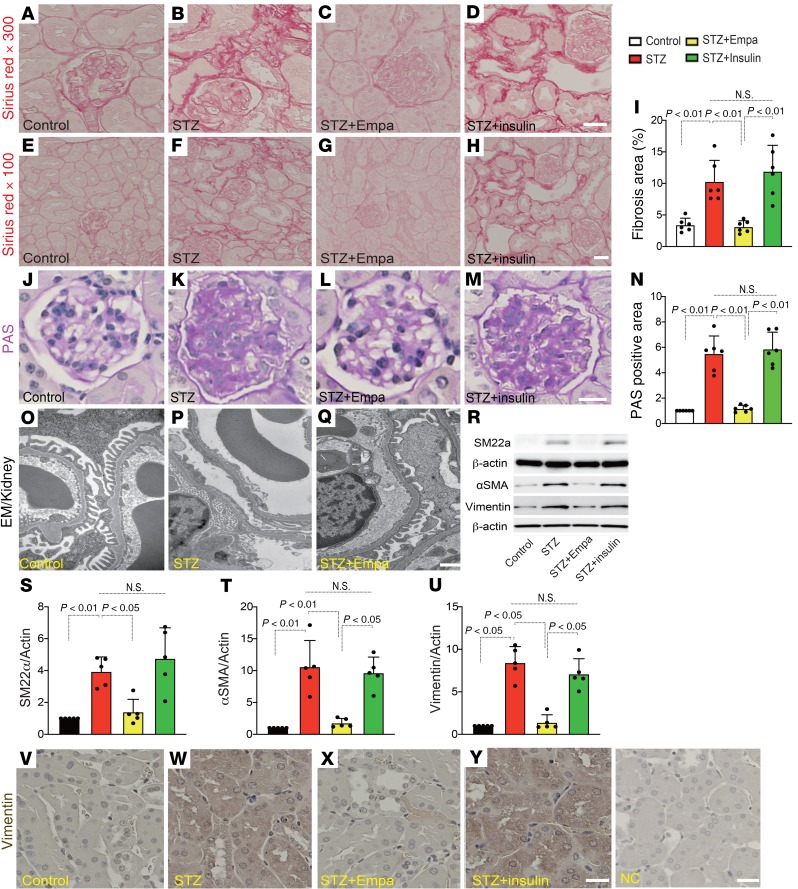
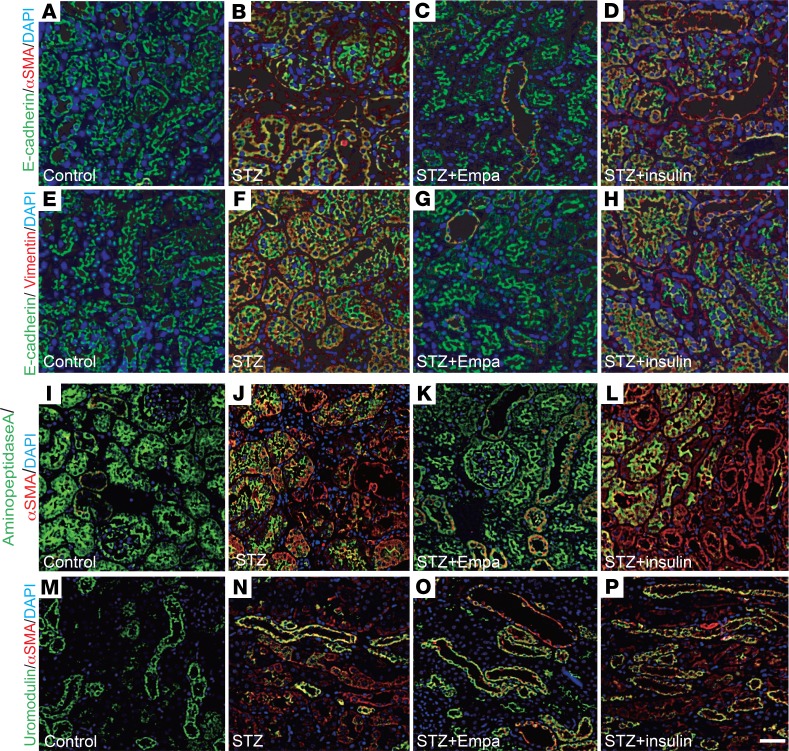
First, we investigated whether SGLT2 inhibition resulted in antifibrotic effects in a fibrosis model of the diabetic kidney. Three months after the induction of diabetes, the mice were treated with empagliflozin or insulin (blood glucose was adjusted to that of the empagliflozin group) for 1 month (Supplemental Figure 1; supplemental material available online with this article; https://doi.org/10.1172/jci.insight.129034DS1). Histological analysis revealed that CD-1 diabetic mice exhibited mild but significant kidney fibrosis 4 months after the induction of diabetes from a single streptozotocin (STZ) injection compared with that of the control mice (Figure 1, A, B, E, F, and I). Empagliflozin treatment suppressed fibrosis (Figure 1, C, G, and I), whereas blood glucose adjustment with insulin did not suppress kidney fibrosis (Figure 1, D, H, and I). The glomerular structure and damage were also assessed by periodic acid–Schiff (PAS) staining. Empagliflozin but not insulin ameliorated diabetes-induced glomerular damage (Figure 1, J–N). Electron microscopy analysis demonstrated that empagliflozin ameliorated glomerular pathological alterations, such as podocyte effacement and endothelial damage (Figure 1, O–Q). Western blot analysis revealed increased levels of mesenchymal markers in diabetic mice, such as smooth muscle protein 22α (SM22α), α-smooth muscle actin (αSMA), and vimentin; empagliflozin but not insulin inhibited the expression of these mesenchymal proteins (Figure 1, R–U). Immunohistochemical analysis of vimentin also showed similar results (Figure 1, V–Y). Next, we investigated the fibrogenic transition of proximal tubular cells (the EMT). Multiplex immunohistochemical analysis of the epithelial marker E-cadherin and the mesenchymal marker αSMA and vimentin revealed that the diabetic mice exhibited higher numbers of E-cadherin and mesenchymal marker double-positive cells, indicating EMT activation (Figure 2, A, B, E, and F, and Supplemental Figure 2, A and B). Empagliflozin but not insulin treatment suppressed the EMT (Figure 2, C, D, G, and H, and Supplemental Figure 2, A and B). The colabeling of αSMA/aminopeptidase A (a marker of the proximal tubule) or αSMA/uromodulin (a marker of the distal tubule) showed that empagliflozin suppressed the expression of αSMA in the proximal tubule, but in the distal tubule, empagliflozin had minor effects (Figure 2, I–P, and Supplemental Figure 3, A and B).
Figure 1. Empagliflozin suppressed kidney fibrosis in association with inhibition of the EMT in kidneys from diabetic CD-1 mice.
Higher-magnification (original magnification, ×300) (A–D) and lower-magnification (original magnification, ×100) (E–H) images of Sirius Red staining for fibrosis. Scale bar: 60 μm (A–D); 20 μm (E–H). (I) Relative fibrosis areas were calculated using ImageJ software. Six independent high-magnification images of the staining were analyzed. n = 6. (J–N) PAS staining was performed in kidney paraffin sections. Six independent images of the staining were analyzed. n = 6 in each group. Scale bar: 80 μm. (N) Quantification of the relative surface area of glomeruli by ImageJ software. (O–Q) Electron microscopy (EM) was performed to evaluate glomerular damage. Representative images are presented. n = 2. Scale bar: 1 μm. (R) Representative Western blotting images of mesenchymal markers in kidney samples. β-Actin from same gel is shown under the corresponding blots as loading control. (S–U) Densitometric analysis of the Western blotting results normalized to β-actin. n = 5 in each group. (V–Y) Immunohistochemical analysis for vimentin. Deparaffinized sections were analyzed from each group of mice. n = 5. Scale bar: 50 μm. Representative data are shown. The data are expressed as mean ± SD. One-way ANOVA followed by Tukey’s multiple comparison test was used to determine significance, which was defined as P < 0.05. Empa, empagliflozin; NC, negative control.
Figure 2. Empagliflozin suppressed the mesenchymal phenotypes in the proximal tubules in diabetic mice.
(A–H) EMT analysis. E-cadherin–positive/αSMA-positive cells (A–D) and E-cadherin–positive/vimentin-positive cells (E–H) were recognized as cells undergoing the EMT. For each group of mice. n = 5. Scale bar: 50 μm. (I–P) Immunofluorescence for aminopeptidase A/αSMA and uromodulin/αSMA in kidney sections. Deparaffinized sections were analyzed from each group of mice. n = 5. Scale bar: 50 μm. Empa, empagliflozin.
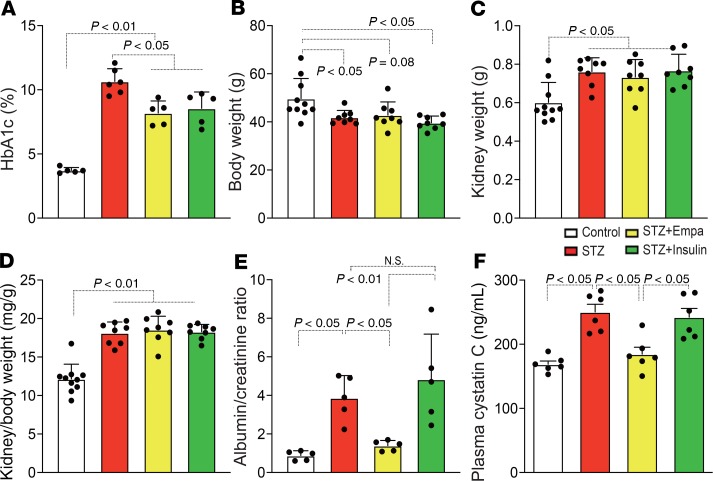
The characteristics of the experimental groups were also analyzed. The STZ group displayed significantly higher glycated hemoglobin A1C (HbA1c) levels, reduced body weights, heavier kidney weights, and larger kidney-to-body weight ratios (Figure 3, A–D). Empagliflozin and insulin treatment significantly suppressed HbA1c levels, but this short-term intervention did not alter body or kidney weights in diabetic mice (Figure 3, A–D). The analysis of urine albumin and plasma cystatin C revealed that empagliflozin suppressed the diabetes-induced increase in urine albumin and plasma cystatin C, but insulin did not (Figure 3, E and F).
Figure 3. Characteristics of each group of mice.
The HbA1c level (A), body weight (B), kidney weight (C), kidney/body weight (D), albumin-creatinine ratio (E), and plasma cystatin C (F) are shown. For A, n = 5–6; for B–D, n = 8–10; for E and F, n = 6. The data are expressed as mean ± SD. One-way ANOVA followed by Tukey’s multiple comparison test was used to determine significance, which was defined as P < 0.05. Empa, empagliflozin.
Empagliflozin restored Sirt3 expression and suppressed aberrant glycolysis in diabetic kidney tubules.
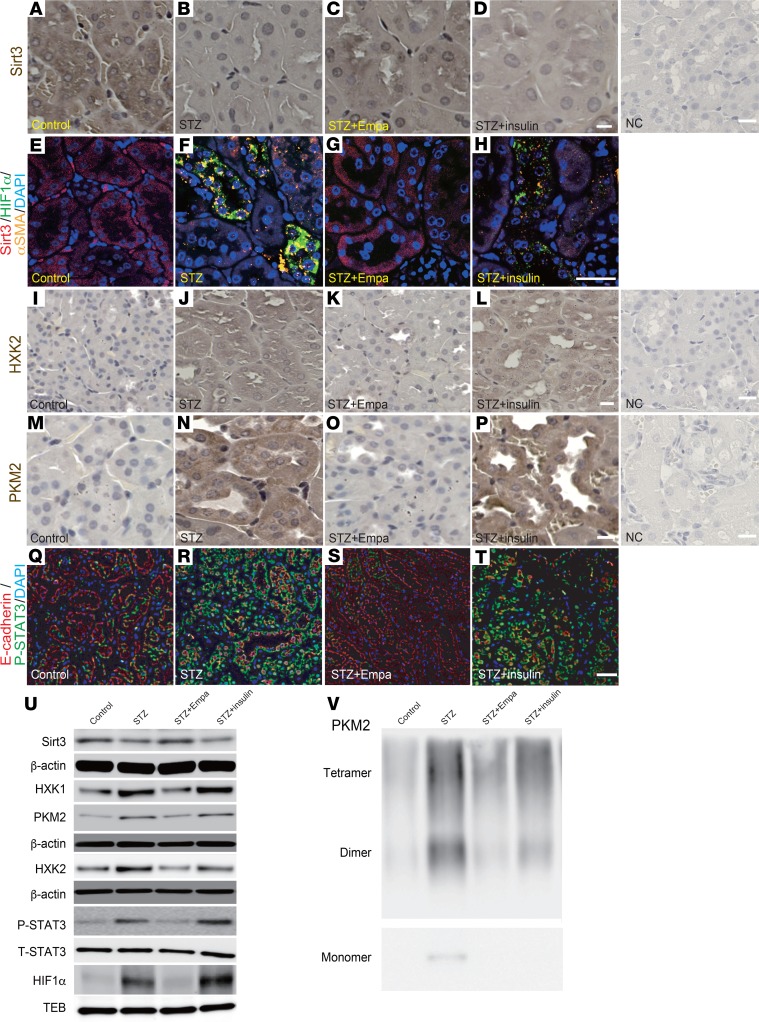
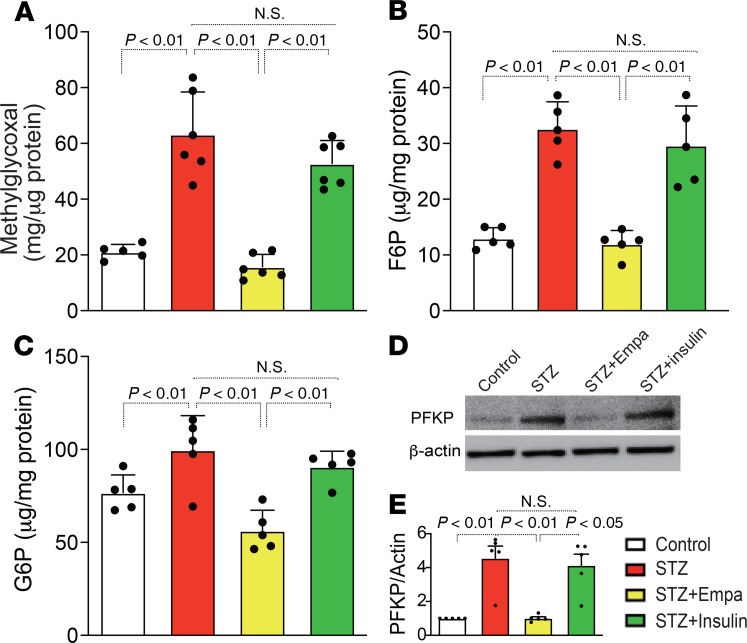
When analyzing the mechanisms underlying the EMT in our diabetic mice, we found that the Sirt3 levels were markedly suppressed in the diabetic animals compared with the levels in the control mice (Figure 4, A, B, E, and F). Treatment with empagliflozin but not insulin restored Sirt3 levels (Figure 4, C, D, G, and H). HIF-1α accumulation was also observed in the diabetic mice compared with the levels detected in the control mice (Figure 4, E and F); empagliflozin but not insulin inhibited this accumulation of HIF-1α (Figure 4, G and H). Sirt3 suppression accompanied by HIF-1α accumulation is associated with the EMT and aerobic glycolysis in cancer cells (14, 18). Inhibition of glycolysis has been demonstrated to be a relevant strategy for inhibiting kidney fibrosis (19). In our analysis, alteration of Sirt3 and HIF-1α in tubular cells was associated with EMT induction, similar to the cancer cells (Figure 4, E–H, and Supplemental Figure 4). The levels of hexokinase 2 (HXK2) and pyruvate kinase M2 (PKM2) were minimal in the control group kidneys (Figure 4, I and M). Conversely, the diabetic mice displayed induction of HXK2 and PKM2 (Figure 4, J and N). The kidneys from the empagliflozin-treated diabetic mice exhibited suppressed HXK2 and PKM2 levels (Figure 4, K and O), and these levels were not altered by insulin (Figure 4, L and P). As a consequence of Sirt3 suppression, activation of STAT3 contributes to EMT induction via interaction with HIF-1α in cancer cells (20, 21). Diabetic mice displayed markedly high numbers of nuclei immunolabeled with phosphorylated STAT3 (P-STAT3) compared with those of the control group; empagliflozin but not insulin suppressed this diabetes-induced STAT3 phosphorylation (Figure 4, Q–T). Western blot analysis also revealed suppression of Sirt3; induction of HXK1, HXK2, and PKM2; and nuclear accumulation of HIF-1α and P-STAT3 in the diabetic kidney. Empagliflozin but not insulin restored all of these molecules to their normal expression levels (Figure 4U and Supplemental Figure 5). The immunohistochemical analysis demonstrated that PKM2 was localized to the nucleus as well (Figure 4N); nuclear accumulation of PKM2 has been shown to involve PKM2 dimers. Crosslinking analysis of the diabetic kidney lysates showed high levels of PKM2 dimers and monomers. Empagliflozin completely inhibited PKM2 dimer and monomer formation, but insulin only partially inhibited this effect (Figure 4V). Supporting these findings, diabetic kidneys had significantly increased methylglyoxal levels (Figure 5A); empagliflozin but not insulin inhibited diabetes-induced increases in methylglyoxal (Figure 5A). Fructose-6-phosphate (F6P), glucose-6-phosphate (G6P), and phospho-fructokinase platelets (PFKPs) were used to analyze glycolysis intermediates, and we found that empagliflozin suppressed the diabetes-induced increases in F6P, G6P, and PFKP, but insulin did not (Figure 5, B–E).
Figure 4. Empagliflozin restored Sirt3 expression and inhibited aberrant glycolysis in the diabetic kidney.
(A–D) Immunohistochemical analysis of Sirt3 levels. (E–H) Multiplex opal in situ analysis for Sirt3/HIF-1α/αSMA expression. (I–P) Immunohistochemical analysis of HXK2 (I–L) and PKM2 expression (M–P). A representative analysis is shown for 4 independent experiments. Scale bar: 60 μm (A–D and M–P); 30 μm (I–L); 80 μm (E–H). (Q–T) Immunofluorescence microscopic analysis of E-cadherin/P-STAT3 in kidney tissues from each group of mice. Scale bar: 50 μm. (U) Western blotting analysis to detect the expression of Sirt3, P-STAT3, and molecules related to aberrant glycolysis. Representative data from 5 independent analyses are shown. The quantification data are shown in Supplemental Figure 5. (V) β-Actin or TEB from same gel are shown under the corresponding blots as loading control. T-STAT3 was analyzed in different gels using same biological samples as P-STAT3. Chemical crosslinking analysis of PKM2. Kidney lysates were treated with glutaraldehyde and separated in gels. Representative analysis from 5 independent experiments is shown. Empa, empagliflozin; NC, negative control.
Figure 5. Empagliflozin suppressed glycolysis intermediates in diabetic kidneys.
(A) Methylglyoxal in the kidneys of the indicated groups was measured and quantified. n = 5 in all groups. (B and C) The kidney glycolysis intermediates (F6P and G6P) were analyzed. n = 5. (D) Representative Western blotting images of PFKP in kidney tissues. β-Actin from same gel is shown under the corresponding blots as loading control. (E) Densitometric analysis of the Western blotting results was normalized to β-actin. n = 5 in each group. The data are expressed as mean ± SD. One-way ANOVA followed by Tukey’s multiple comparison test was used to determine significance, which was defined as P < 0.05. Empa, empagliflozin.
To further confirm the inhibitory effects of empagliflozin on the EMT and aberrant glycolysis in kidney fibrosis, we treated diabetic mice with different doses of empagliflozin (0.2 mg/kg/d, 1 mg/kg/d, and 5 mg/kg/d). We found that empagliflozin suppressed the EMT, aberrant glycolysis, and associated kidney fibrosis at a dose of 1 mg/kg/d and significantly inhibited the EMT at a dose of 5 mg/kg/d. In addition, we treated the diabetic mice with canagliflozin (another SGLT2 inhibitor) and obtained similar results as those with empagliflozin (Supplemental Figure 7, A–L, and Supplemental Figure 8, A–J).
SGLT2 knockdown prevented high-glucose–induced EMT.
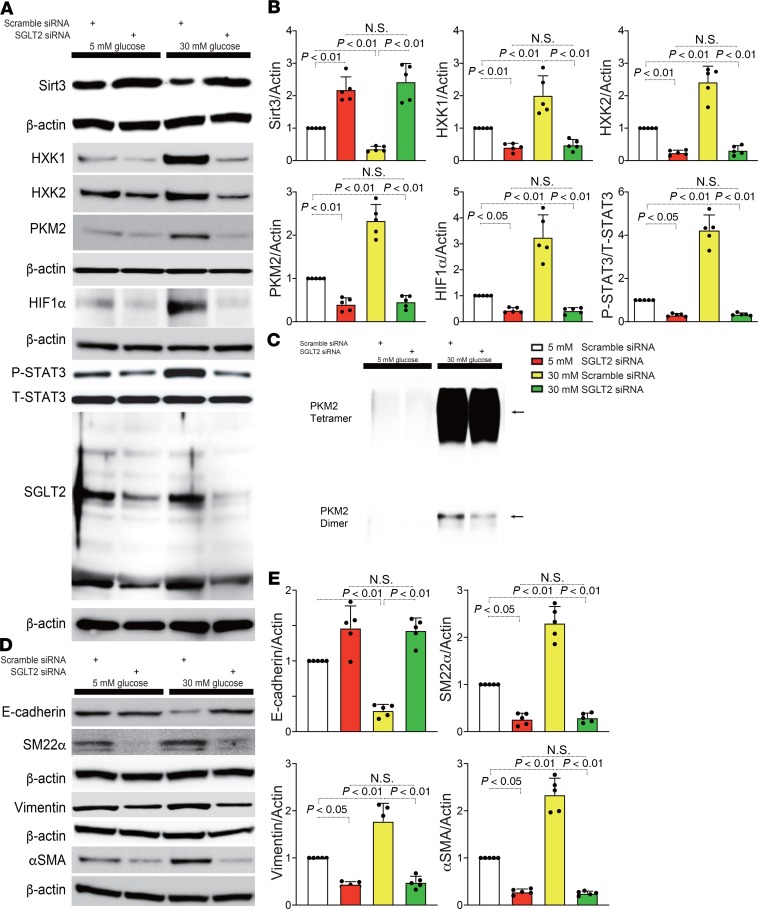
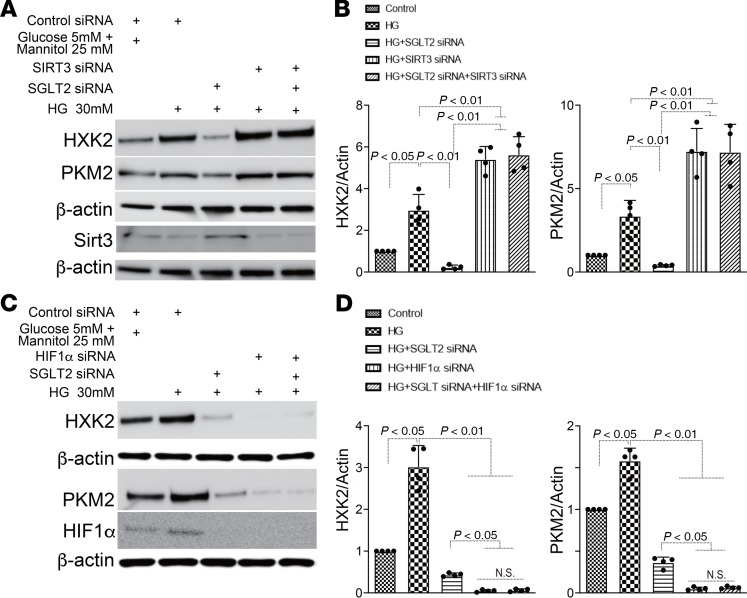
In HK2 cells, SGLT2 knockdown significantly suppressed glucose uptake (Supplemental Figure 9, A–D). To further investigate the pathophysiological effect of SGLT2-mediated glucose uptake in proximal tubular cells, we used gene silencing of SGLT2 by siRNA (3 sets of siRNAs) transfection in the HK2 proximal tubular cell line. First, we validated that specific SGLT2 siRNA transfection successfully downregulated SGLT2 expression in HK2 cells (Figure 6A, Supplemental Figure 10A, and Supplemental Figure 12A). Incubation in high-glucose medium (30 mM) suppressed Sirt3 expression and induced the accumulation of HIF-1α and P-STAT3 (Figure 6, A and B; Supplemental Figure 10, A and B; and Supplemental Figure 12, A and B). SGLT2 knockdown reversed this high-glucose–induced alteration (Figure 6, A and B; Supplemental Figure 10, A and B; and Supplemental Figure 12, A and B), indicating that the SGLT2-mediated uptake of glucose in proximal tubular cells had pathological significance. The HXK1, HXK2, and PKM2 levels displayed similar trends to those of HIF-1α and P-STAT3 (Figure 6, A and B; Supplemental Figure 10, A and B; and Supplemental Figure 12, A and B). Additionally, PKM2 dimer formation was increased in the cells that were incubated in high-glucose medium, whereas SGLT2 knockdown suppressed this aberrant PKM2 accumulation (Figure 6C). High-glucose medium also induced the expression of mesenchymal markers, such as SM22α, vimentin, and αSMA, and suppressed E-cadherin, suggesting that high-glucose culture conditions induce the EMT in proximal tubular cells. However, high-glucose medium–induced EMT was significantly diminished in the SGLT2-knockdown cells (Figure 6, D and E; Supplemental Figure 10, C and D; and Supplemental Figure 12, C and D). Both Sirt3 and HIF-1α play critical roles in the regulation of glycolysis (22, 23). SGLT2 knockdown suppressed the high-glucose–mediated increases in HXK2 and PKM2; in contrast, Sirt3 knockdown by specific siRNA induced these effects (Figure 7, A and B; Supplemental Figure 11, A and B; and Supplemental Figure 13, A and B). In the Sirt3-knockdown cells, SGLT2 siRNA failed to restore HXK2 and PKM2 protein levels in cells incubated in high-glucose conditions (Figure 7, A and B; Supplemental Figure 11, A and B; and Supplemental Figure 13, A and B). HIF-1α knockdown was sufficient to suppress HXK2 and PKM2 protein levels in HK-2 cells incubated in high-glucose media (Figure 7, C and D; Supplemental Figure 11, C and D; and Supplemental Figure 13, C and D).
Figure 6. SGLT2 knockdown protected HK2 cells against high-glucose–induced EMT in association with suppression of aberrant glycolysis.
(A) Representative Western blotting data for Sirt3, P-STAT3, and the molecules related to aberrant glycolysis from 5 independent experiments. β-Actin from same gel are shown under the corresponding blots as loading control, except for Sirt3, for which β-actin was run in different gel using same samples. T-STAT3 was analyzed in different gels using same samples as P-STAT3. (B) Densitometric analysis of the indicated molecules. n = 5. (C) Chemical crosslinking analysis for PKM2. HK2 cell lysates were treated with glutaraldehyde and separated in a gel. A representative analysis from 5 independent experiments is shown. (D) Representative Western blot data for the EMT from 5 independent experiments. E-cadherin is blotted on the same membrane as Sirt3 in A. β-Actin was analyzed in same membrane with E-cadherin or Sirt3 and is shown under the corresponding blots as loading control. SM22α, vimentin, and αSMA were analyzed on a different gel using the same biological samples. (E) Densitometric analyses of the indicated molecules. The data are expressed as mean ± SD. One-way ANOVA followed by Tukey’s multiple comparison test was used to determine significance, which was defined as P < 0.05. Empa, empagliflozin.
Figure 7. SGLT2 knockdown suppressed aberrant glycolysis in a Sirt3 pathway–dependent manner.
SGLT2 siRNA with or without Sirt3 or HIF-1α siRNA were transfected into HK2 cells, and after 6 hours, the medium was changed to fresh medium with high glucose and incubated for 48 hours. Western blotting analysis of glycolysis markers (A and C). Representative analysis from 5 independent experiments is shown (B and D). α-Actin from same gel is shown under the corresponding blots as loading control (A, same gels; C, same biological samples).The data were normalized to α-actin and are shown as mean ± SD. One-way ANOVA followed by Tukey’s multiple comparison test was used to determine significance, which was defined as P < 0.05.
Conditioned medium from SGLT2-knockdown HK2 cells protected against the endothelial-mesenchymal transition.
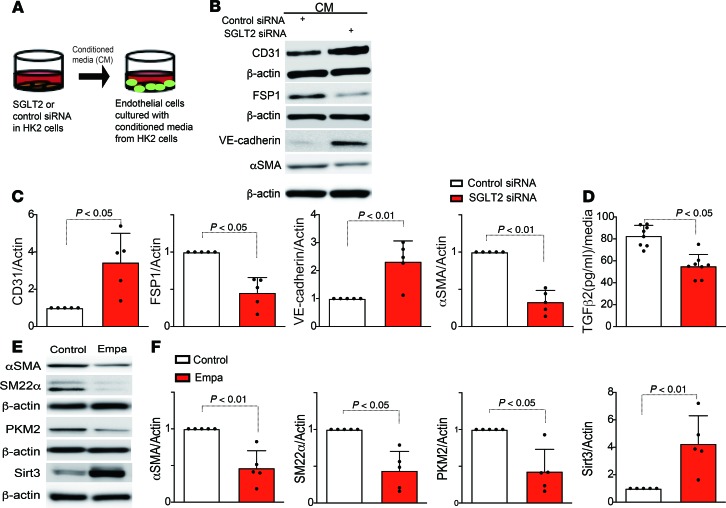
We analyzed whether SGLT2 knockdown in tubular epithelial cells influenced the phenotype of the peritubular capillaries (PECs). Medium from either SGLT2 or scramble siRNA–transfected HK2 cells was transferred to cultured human dermal microvascular endothelial cells (HMVECs) (Figure 8A). The medium from the scramble siRNA–transfected HK2 cells induced expression of FSP1 and αSMA and suppressed expression of the endothelial markers CD31 and VE-cadherin in the HMVECs (Figure 8, B and C), suggesting an alteration in the normal endothelial cell phenotype, resulting in the endothelial-mesenchymal transition (EndMT) following cell culture; the HMVECs that were incubated with medium from the SGLT2 siRNA–transfected HK2 cells did not undergo the EndMT (Figure 8, B and C). Furthermore, TGF-β2 in the medium of SGLT2 or scramble siRNA–transfected HK2 cells was measured, and SGLT2 siRNA significantly suppressed the levels of TGF-β2 compared with those of the control group (Figure 8D). In addition, neutralizing TGF-β but not CTGF in the medium from scramble siRNA–transfected HK2 cells suppressed EndMT induction (Supplemental Figure 14, A and B). Supporting these findings, empagliflozin suppressed the levels of αSMA, SM22α, PKM2, and Sirt3, even in the nondiabetic mouse group (Figure 8, E and F). In vivo, diabetic CD-1 mice exhibited the EndMT, as shown previously (24–27), and empagliflozin-treated mice had fewer cells undergoing the EndMT (Supplemental Figure 15, A–C, E–H, and J). Insulin treatment in diabetic CD-1 mice did not ameliorate the number of cells undergoing the EndMT (Supplemental Figure 15, D, I, E, and J).
Figure 8. SGLT2-mediated uptake of glucose induced neighboring endothelial cells to transition into mesenchymal cells.
(A) Design of the conditioned media experiment. HK2 cells were transfected with scramble or SGLT2 siRNA, and after 6 hours, the medium was changed to fresh medium and incubated for 48 hours. The subsequently harvested media were transferred to HMVEC cultures. (B) Representative Western blotting images of the indicated molecules from 5 independent experiments are shown. β-Actin from same gel is shown under the corresponding blots as loading control. (C) Densitometric analysis of the levels relative to β-actin are shown. (D) ELISA analysis of TGF-β2 levels from conditioned medium. (E) Representative Western blotting images of αSMA, SM22α, PKM2, and Sirt3 from 5 independent experiments. β-Actin is shown under the corresponding blots as loading control (run in different gels using same biological samples). (F) Densitometric analysis of the levels relative to β-actin are shown. The data are expressed as mean ± SD. One-way ANOVA followed by Tukey’s multiple comparison test was used to determine significance, which was defined as P < 0.05. Empa, empagliflozin.
Discussion
In this study, we described the potential renoprotective effects of empagliflozin via suppression of the EMT in the kidney proximal tubule. In summary, (a) empagliflozin suppressed kidney fibrosis and displayed antifibrotic effects independent of blood glucose amelioration; (b) empagliflozin suppressed the EMT in the renal proximal tubule and the EndMT in the PEC; (c) empagliflozin restored diabetes-suppressed Sirt3 levels in the proximal tubule in a manner that was associated with suppression of HIF-1α and P-STAT3, PKM2 dimer formation and aberrant glycolysis; (d) SGLT2 knockdown in HK2 cells resulted in protection from high-glucose medium–induced EMT in association with suppression of aberrant glycolysis similar to that of the in vivo model; and (e) conditioned medium from SGLT2-knockdown HK2 cells protected HMVECs from the EndMT. These data suggested that an SGLT2 inhibitor could reduce the mesenchymal transition in both the proximal tubule and endothelial cells in diabetic mice and subsequently inhibit kidney fibrosis.
The pathological significance of urine glucose remains uncertain. However, the diabetic kidney proximal tubule theoretically suffers from huge amounts of glucose uptake from the urine via SGLT2, since SGLT2 levels are increased in diabetic kidneys (8–10). Proximal tubular cells appear to be unable to appropriately reduce glucose transport rates and prevent excessive alterations in intracellular glucose levels when exposed to high-glucose conditions (8, 9). Hyperglycemia not only exposes tubular cells to high levels of glucose from the basolateral side but also enhances the amount of glucose filtered from the glomeruli and, thereby, increases the tubular glucose load, exposure, and reabsorption (8–10). The significance of such filtered and reabsorbed glucose in the proximal tubule has been minimally considered in the pathogenesis of DKD (28). One reason for this lack may be that reabsorbed glucose is believed to be directly transported out to the basolateral side via GLUT2. During the 1960s and 1970s, many investigators concluded that there was “no or minimal glycolysis in the proximal tubules” (29, 30). However, recent analyses have demonstrated the presence of reasonable amounts of glycolysis in the proximal tubules by multiphoton microscopy analysis (28). Furthermore, under several stress conditions, glycolysis plays a role in proximal tubule pathobiology (31, 32). In this regard, glycolysis inhibition could suppress kidney fibrosis in the unilateral ureteral obstruction model of renal fibrosis (19). Additionally, glycolysis inhibition ameliorated kidney pathology in an animal model of polycystic kidney disease (33). Aberrant glycolysis similar to the Warburg effect, which is characteristics of tumor cell metabolism, has been a focus in the pathogenesis of DKD (34); to date, there has been no clear demonstration of the link between inhibition of aberrant glycolysis and SGLT-2 inhibitor use in human DKD. As discovered in the current study, direct effects of SGLT-2 inhibition on proximal tubule glycolysis and EMT could play significant roles in the amelioration of DKD, and SGLT-2 inhibitors may ameliorate advanced/fibrotic kidney disease in patients with diabetes when compared with the of cases with recommended targets of SGLT-2 inhibitors in current guidelines. Further study must be performed focusing on this topic.
Sirt3 suppression and the accumulation of HIF-1α and P-STAT3 are associated with both the EMT and aberrant glycolysis (14, 18). Inhibition of glycolysis by 2-deoxy-D-glucose (2-DG) is associated with suppression of the EMT and tumor metastasis in cancer cells (35–37). HIF-1α and P-STAT3 accumulation in kidney tubules is associated with the EMT and fibrosis (15, 16). As described above, proximal tubular cells are exposed to unavoidably high levels of glucose uptake from the urine under diabetic conditions; theoretically, urine-derived glucose could be used as a substrate for glycolysis (28). Therefore, the activation of HIF-1α and the induction of aberrant glycolytic enzymes stimulated by high levels of glucose reabsorption induces proximal tubular cells to adopt a mesenchymal phenotype.
We observed PKM2 dimerization in the diabetic kidney and in a proximal tubular cell line exposed to high-glucose medium. PKM2 dimers have been shown to transactivate HIF-1α and are responsible for aberrant glycolysis in cancer cells via the Warburg effect (38–40). Very recently, Joslin investigators reported that aberrant glycolysis played a pathogenic role in the diabetic kidney phenotype (41). Joslin investigators focused on glomerular pathology, but the tubular interstitial phenotype was also ameliorated with the normalization of PKM2 activity (41). These authors elegantly showed normalization of abnormal PKM2 accumulation by TEPP-46–mediated inhibition of fibronectin, type I collagen α3, and TGF-β1 expression levels in the tubular lesion; conversely, the effects of TEPP-46 were minimal in the glomeruli (41). Type I collagen α3 and TGF-β1 levels were induced in the tubular lesion and kidney cortex but not in the glomeruli of diabetic animals (41). These reports suggest that glycolysis in the kidney proximal tubule contributes to kidney disease pathogenesis, especially under pathological conditions.
SGLT2 inhibitors act primarily on kidney proximal tubular cells. In our analysis, SGLT2 inhibition suppressed the EMT in proximal tubular cells and the EndMT in PECs. Suppression of SGLT2 in vitro and in vivo confirmed these findings. As the source of myofibroblasts, the EMT has been the focus of intensive discussion (42). However, tubular cells are damaged in diabetic kidney tissue, which is where massive glucose reabsorption occurs. This process induces phenotypic alterations in which the tubular cells adopt matrix-producing cell phenotypes, including the expression of mesenchymal proteins, such as αSMA and FSP1. Kidney fibrosis may be promoted by the interactions among cells of any type in the kidney (42). Our analysis suggests that the EMT phenotype in proximal tubular cells influences the phenotypes of PECs or potentially other cells via soluble factors.
In our analysis, SGLT2 inhibition s significantly (P < 0.05) reduced albumin/creatinine ratio in diabetic mice. The electron microscopy data showing that empagliflozin ameliorated the podocyte phenotype clearly indicated that empagliflozin ameliorated the glomerular phenotype in diabetic kidneys. Most likely, such amelioration of the glomerular phenotype by SGLT2 inhibition was associated with the restoration of the tubule-glomerular feedback mechanism, which is diminished in diabetic kidneys (7), suggesting that the tubular phenotype is directly linked to the glomerular phenotype. Another possible link between tubular cell and glomerular phenotypes has been reported as well (43). Additionally, it is well known that tubulointerstitial damage directly induces kidney parenchymal hypoxia, inducing global kidney damage, including in the glomeruli (44). However, there is a curious paper reporting SGLT2 expression in glomerular mesangial cells (45) and podocytes as well (46). Additionally, it is possible that other cell types express SGLT2 and have pathogenic roles (47). Even though there is dominant expression of SGLT2 in kidney proximal tubules, it is difficult to determine a clear distinction in either the tubular- or glomerular-dominant hypothesis of SGLT2 inhibitor action.
The subanalysis from the EMPA-REG trial focused on urine albumin levels and provided provocative findings on the renoprotective effects of SGLT2 inhibition (48). In normoalbuminuric diabetic patients, empagliflozin suppressed urine albumin levels as expected; once empagliflozin treatment ceased at the end of the intervention period (average 2.6 years), the urine albumin levels returned to the placebo levels after a washout period of 5 weeks (48). However, in the microalbuminuria and macroalbuminuria groups, empagliflozin treatment suppressed urine albumin levels; once treatment ceased as defined above, the empagliflozin-treated group still exhibited suppression of urine albumin compared with the level in the placebo group 5 weeks later (48). These data suggest that the effects of SGLT2 inhibition on microalbuminuria onset in normoalbuminuric diabetic patients were solely hemodynamic effects; in patients with advanced-stage kidney disease, SGLT2 inhibitors displayed renoprotective effects by hemodynamic restoration and most likely ameliorated morphological alterations in the diabetic kidney. In our analysis, empagliflozin treatment restored both diabetes-increased urine albumin and plasma cystatin C levels. However, in the small insulin group with adjusted blood glucose levels similar to those of the empagliflozin group, the increased levels of urine albumin and plasma cystatin C in the diabetes group were not normalized, suggesting that empagliflozin ameliorated diabetes-impaired kidney function independent of blood glucose normalization.
Many hypotheses have been proposed based on the astonishing protective effects of SGLT2 inhibitors on the renal outcomes obtained by cardiovascular outcome trials (49, 50), especially recently reported CREDENCE trial (50) in which only advanced diabetic nephropathy patients were recruited. The most relevant theory involves the restoration of tubuloglomerular feedback mechanisms and subsequent suppression of hyperfiltration in the diabetic kidney (7). Although the hemodynamic alteration and the restoration of tubuloglomerular feedback mechanisms by SGLT-2 inhibition could potentially affect the tubular phenotype, our current study demonstrated that, at least in part, the inhibition of SGLT2 in the renal tubule has direct effects on tubule metabolic pathways associated with the restoration of Sirt3 expression in the kidney tubule, resulting in suppression of the EMT and an aberrant glycolytic pathway that is characterized by P-STAT3 and HIF-1α accumulation and PKM2 dimer formation.
We describe here that the renoprotective effects of empagliflozin are partially independent of both blood glucose and hemodynamic alterations but are potentially dependent on the direct effects of inhibiting glucose uptake into the proximal tubule.
Methods
Reagents.
Rabbit anti-SGLT2 (1:300, GTX59872, Research Resource Identifiers [RRID]: AB_10722320), rabbit anti–aminopeptidase A (1:100, GTX102838, RRID: AB_1950202), and rat anti–E-cadherin (1:1000, GTX11512, RRID: AB_381324) antibodies were purchased from GeneTex Inc. Rabbit anti–pyruvate kinase isozyme M2 (1:2000, 4053s, RRID: AB_1904096) and rabbit anti–HXK-2 (1:1000, 2867, RRID: AB_2232946) antibodies were obtained from Cell Signaling Technology. Rabbit anti-αSMA (1:1000, ab5694, RRID: AB_2223021), rabbit anti–phospho-STAT3 (1:500, ab76315, RRID: AB_1658549), rabbit anti-hexokinase 1 (1:1000, ab65069, RRID: AB_1140844), mouse anti–phospho-fructokinase platelet (PFKP) (1:1000, ab119796, RRID: AB_10903593), mouse anti-vimentin (1:2000, ab8978, RRID: AB_306907), mouse anti-HIF-1α (1:500, ab51608, RRID: AB_880418), and goat anti-STAT3 (1:1000, ab5073, RRID: AB_304731) antibodies were purchased from Abcam. Rat anti-uromodulin antibody (1:100, MA5-24374, RRID: AB_2606307) was obtained from Thermo Fisher Scientific. Rabbit anti-SM22α (1:1000, NB600-507, RRID: AB_10002969) was obtained from Novus Biological. Mouse anti–β-actin antibody (1:10000, A2228, RRID: AB_476697) was obtained from MilliporeSigma. Goat anti-Sirt3 antibody (1:300, sc-365175, RRID: AB_10710522) was purchased from Santa Cruz Biotechnology.
Animal experiments.
Eight-week-old male CD-1 mice (Sankyo Lab Service) were used in all in vivo experiments. The mice received intraperitoneal injections of STZ (200 mg/kg BW). Two weeks after STZ injection, diabetic induction was confirmed by a blood glucose level >16 mM. By 12 weeks after diabetes induction, the diabetic mice were divided into 7 groups (gavage administration of empagliflozin [0.2, 1, or 5 mg/kg BW/d], canagliflozin [30 mg/kg BW/d], placebo [methylcellulose], or insulin pellets) (Supplemental Figure 16A). In addition, 8-week-old CD-1 mice were fed for 12 weeks, and the mice were divided into 2 groups (control mice and empagliflozin-treated control mice) (Supplemental Figure 16B). All mice were sacrificed at 24 weeks. Empagliflozin was provided by Boehringer Ingelheim via a material transfer agreement.
Multiplex staining.
The Opal in situ kit (Waltham) was used for multiplex staining according to the manufacturer’s instructions. Deparaffinized sections were labeled with the relative antibodies (red, opal 520 [TSA-FITC]; green, opal 570 [TSA-Cy3]; and yellow, opal 670 [TSA-Cy5]). The cell nuclei were labeled with DAPI. In the negative controls, the primary antibody was omitted and replaced with blocking solution.
Morphological evaluation.
After deparaffinization and dehydration, Sirius red and PAS staining were performed in kidney samples. Images were analyzed by ImageJ (NIH) software. The fibrotic areas, as indicated by Sirius red staining, and the collagen fiber area and glomerular size, as indicated by PAS staining, were quantified. In each mouse, 6 images were evaluated. In brief, the images were opened in ImageJ software, the RGB stack was selected, and the montage was created. After making the threshold, the red area was made the default. Then, the selected red area was measured, and the data were obtained.
Kidney function analysis.
Briefly, the blood was centrifuged at 1100 g for 15 minutes, and then plasma were collected. Urinary albumin creatinine was analyzed according to the manufacturer’s instructions (Exocell). Plasma cystatin C was also detected according to the manufacturer’s instructions (Abcam).
EMT and EndMT detection in vivo.
Frozen sections (5 μm) were used for the detection of EMT or EndMT in vivo. Cells undergoing the EMT were detected by double-positive labeling for E-cadherin and SMA or E-cadherin and vimentin. The EndMT was identified by double-positive labeling for CD31 and αSMA or CD31 and FSP1. The immunolabeled sections were analyzed by fluorescence microscopy. For each mouse, images taken at 200× magnification for EMT analysis were obtained from 6 different areas, and quantification was performed.
Immunohistochemistry.
Deparaffinized (2 min in xylene 4 times, 1 min in 100% ethanol twice, 30 s in 95% ethanol, 30 s in 70% ethanol, and 1 min in distilled water) mouse kidney sections were used for Sirt3, HXK-2, PKM2, and vimentin labeling. Immunohistochemistry was performed with the Vectastain ABC kit (Vector Laboratories). The Sirt3, HXK-2, PKM2, and vimentin primary antibodies were diluted 1:100. In the negative controls, the primary antibody was omitted and replaced with blocking solution.
Electron microscopy.
First, 1 M cacodylic acid and 25% glutaraldehyde in PBS were used to fix the small pieces of the kidney, and the slides were dehydrated at room temperature. After the Epon-embedded tissue samples were oriented in either a longitudinal or transverse direction, an RMC/MTX ultramicrotome (Elexience) was used to cut the Epon-embedded tissue into ultrathin sections (60–80 nm), which were then mounted on copper grids and stained with lead citrate and 8% uranyl acetate. A Jeol 1200 EX transmission electron microscope (Jeol LTD) equipped with a MegaView II high-resolution transmission electron microscopy camera was used to observe the copper grids.
Western blot analysis.
The protein lysates were denatured in SDS sample buffer at 100°C for 5 minutes and subsequently centrifuged (14,000 g for 10 minutes at 4°C). The supernatants were separated on SDS-polyacrylamide gels. The separated samples were transferred onto PVDF membranes (Pall Corporation) using the semidry method. The membranes were washed with Tris-buffered saline (TBS) and blocked with TBS-T (TBS containing 0.05% Tween 20) containing 5% nonfat dry milk or 5% BSA. After blocking, the membranes were incubated with primary antibodies (the anti-SGLT2 antibody was diluted 1:50, and the other antibodies were diluted 1:400) specific for the molecules of interest in TBS-T containing 5% BSA at 4°C overnight. After the membranes were washed with TBS-T 3 times, they were incubated with HRP-conjugated secondary antibodies diluted 1:2000 (Cell Signaling Technology) for 1 hour at room temperature. The immunoreactive bands were visualized with an ECL detection system (Pierce Biotechnology) using ImageQuant LAS 400 (GE Healthcare Life Sciences).
Metabolite measurement.
Kidney samples (10 mg) were lysed in RIPA buffer and centrifuged at 15,000 g for 15 minutes at 4°C. The protein concentrations of the supernatants were measured and adjusted. The methylglyoxal competitive ELISA kit (Cell Biolabs), fructose-6-phosphate assay kit, and glucose-6-phosphate assay kit (MyBioSource) were used to monitor these glycolysis byproducts in the obtained kidney protein lysates. The experimental procedures were conducted according to manufacturer’s instructions. The methylglyoxal, fructose-6-phosphate, and glucose-6-phosphate levels are shown as per mg protein of kidney samples.
Glucose uptake.
HK-2 cells (ATCC, CRL-2190, RRID: CVCL_0302) were transfected with SGLT2 siRNA or scramble siRNA for 48 hours. Then, the treated cells were cultured in 0.5% BSA/PBS for 1 hour. The glucose uptake of HK-2 cells was detected by 2-DG glucose uptake (Promega) and 2-[N-(7-nitrobenz-2-oxa-1,3-diazol-4-yl) amino] 2-deoxyglucose (2-NBDG) glucose uptake assays (Abcam). The experimental protocol was performed according to the manufacturer’s instructions.
Chemical crosslinking experiments.
Kidney tissues or human proximal tubular epithelial HK-2 cells were lysed with RIPA lysis buffer (containing PMSF, protease inhibitor cocktail, and sodium orthovanadate, which were purchased from Santa Cruz Biotechnology) for 30 minutes at 4°C. The lysates were centrifuged at 14,000 g for 15 minutes at 4°C. Then, the supernatants were treated with 2.3% glutaraldehyde at a final concentration of 5% and incubated at 37°C for 10 minutes. Tris-HCl (50 mM, pH 7.5) was used to stop the reaction. The samples were boiled with 2× sample loading buffer at 94°C for 5 minutes and then separated by 10% SDS-PAGE.
SGLT2 siRNA transfection.
HK-2 (ATCC, CRL-2190, RRID: CVCL_0302) cells were transfected with an siRNA-targeting SGLT2 (100 nmol/l, Invitrogen) (SGLT2, 5′-GUCAUUGCUGCAUAUUUCC) or control scramble siRNA. The transfection reagent Lipofectamine 2000 (Invitrogen) was used according to the manufacturer’s instructions. The cells were incubated with Lipofectamine 2000 and the target RNA in Keratinocyte-SFM (1×) medium (Life Technologies) for 6 hours. Then, the medium was replaced with fresh medium with or without high-glucose (30 mM) treatment for 48 hours. The HK-2 cell lines for the in vitro experiment were obtained from ATCC within 6 months.
In vitro EndMT and TGF-β2 detection.
HMVECs (Lonza) cultured in EGM2 were used in this experiment. When the HMVECs cultured on plates (Thermo Fisher Scientific) reached 70% confluence, the endothelial cells were treated with culture medium from HK-2 cells transfected with the control or SGLT2 siRNA (48-hour incubation with the HK-2 cells) and incubated with or without neutralizing antibodies for TGF-β (2 μg/ml, R&D Systems) or connective tissue growth factor (5 μg/ml, LifeSpan BioSciences). After 48 hours, the HMVECs were harvested for Western blot analysis. TGF-β2 levels were analyzed in the medium from HK-2 cells by using a human TGF-β2 ELISA kit (Abcam). The protocol was conducted according to the manufacturer’s instructions.
Statistics.
The data are expressed as mean ± SD. One-way ANOVA followed by Tukey’s multiple comparison test was used to determine significance, which was defined as P < 0.05. GraphPad Prism software (version 7.0f) (RRID: SCR_002798) was used for the statistical analysis.
Study approval.
All animal experiments were performed in accordance with the ethical and scientific standards confirmed by the Animal Laboratory of Kanazawa Medical University. The animal experiments were approved by the Institutional Animal Care and Use Committee of Kanazawa Medical University (protocol nos. 2015-59 and 2017-73).
Author contributions
JL performed most of the experiments and participated in writing the manuscript. HL performed some in vitro and in vivo (all of those that dealt with canagliflozin) experiments. ST performed some of the animal experiments. KN supervised the experiments and was involved in the discussions. MK participated in discussions. SPS and YT performed some of the immunolabeling experiments and were involved in the discussions. KK proposed the original idea and design of the experiments, supervised the experiments, provided intellectual input, and edited the manuscript. DK provided intellectual input.
Supplementary Material
Acknowledgments
Empagliflozin was provided by Boehringer Ingelheim through a material transfer agreement. This study was essentially supported by a 2016 grant from the Japan Diabetes Foundation. This work was partially supported by the Japan Society for the Promotion of Science to KK (grants 23790381 and 23790381) and DK (grants 25282028 and 25670414). This work was partially supported by Grants for Collaborative Research awarded to DK (C2011-4 and C2012-1) and Grants for Promoted Research awarded to KK (S2015-3, S2016-3, and S2017-1) from Kanazawa Medical University. Boehringer Ingelheim, Mitsubishi-Tanabe Pharma, and Ono Pharmaceutical contributed to establishing the Division of Anticipatory Molecular Food Science and Technology.
Version 1. 03/05/2020
In-Press Preview
Version 2. 03/26/2020
Electronic publication
Footnotes
Conflict of interest: KK and DK received lecture honoraria from Boehringer Ingelheim and Eli Lilly. KK is under a consultancy agreement with Boehringer Ingelheim.
Copyright: © 2020, American Society for Clinical Investigation.
Reference information: JCI Insight. 2020;5(6):e129034.https://doi.org/10.1172/jci.insight.129034.
Contributor Information
Jinpeng Li, Email: lijinpeng3202@126.com.
Haijie Liu, Email: 664275280@qq.com.
Susumu Takagi, Email: s-takagi@kanazawa-med.ac.jp.
Kyoko Nitta, Email: kyoko_5721@yahoo.co.jp.
Munehiro Kitada, Email: kitta@kanazawa-med.ac.jp.
Yuta Takagaki, Email: yuutatakagaki@me.com.
Keizo Kanasaki, Email: kkanasakidr@gmail.com.
Daisuke Koya, Email: koya0516@kanazawa-med.ac.jp.
References
- 1. Tuttle KR, et al. Diabetic kidney disease: a report from an ADA Consensus Conference. Diabetes Care. 2014;37(10):2864–2883. [DOI] [PMC free article] [PubMed] [Google Scholar]
- 2.Lewis EJ, Hunsicker LG, Bain RP, Rohde RD. The effect of angiotensin-converting-enzyme inhibition on diabetic nephropathy. The Collaborative Study Group. N Engl J Med. 1993;329(20):1456–1462. doi: 10.1056/NEJM199311113292004. [DOI] [PubMed] [Google Scholar]
- 3.Brenner BM, et al. Effects of losartan on renal and cardiovascular outcomes in patients with type 2 diabetes and nephropathy. N Engl J Med. 2001;345(12):861–869. doi: 10.1056/NEJMoa011161. [DOI] [PubMed] [Google Scholar]
- 4.Raskin P. Sodium-glucose cotransporter inhibition: therapeutic potential for the treatment of type 2 diabetes mellitus. Diabetes Metab Res Rev. 2013;29(5):347–356. doi: 10.1002/dmrr.2403. [DOI] [PubMed] [Google Scholar]
- 5.Zinman B, et al. Empagliflozin, cardiovascular outcomes, and mortality in type 2 diabetes. N Engl J Med. 2015;373(22):2117–2128. doi: 10.1056/NEJMoa1504720. [DOI] [PubMed] [Google Scholar]
- 6.Wanner C, et al. Empagliflozin and progression of kidney disease in type 2 diabetes. N Engl J Med. 2016;375(4):323–334. doi: 10.1056/NEJMoa1515920. [DOI] [PubMed] [Google Scholar]
- 7.Cherney DZ, et al. Renal hemodynamic effect of sodium-glucose cotransporter 2 inhibition in patients with type 1 diabetes mellitus. Circulation. 2014;129(5):587–597. doi: 10.1161/CIRCULATIONAHA.113.005081. [DOI] [PubMed] [Google Scholar]
- 8.Gerich JE. Role of the kidney in normal glucose homeostasis and in the hyperglycaemia of diabetes mellitus: therapeutic implications. Diabet Med. 2010;27(2):136–142. doi: 10.1111/j.1464-5491.2009.02894.x. [DOI] [PMC free article] [PubMed] [Google Scholar]
- 9.Poudel RR. Renal glucose handling in diabetes and sodium glucose cotransporter 2 inhibition. Indian J Endocrinol Metab. 2013;17(4):588–593. doi: 10.4103/2230-8210.113725. [DOI] [PMC free article] [PubMed] [Google Scholar]
- 10.Ferrannini E, Veltkamp SA, Smulders RA, Kadokura T. Renal glucose handling: impact of chronic kidney disease and sodium-glucose cotransporter 2 inhibition in patients with type 2 diabetes. Diabetes Care. 2013;36(5):1260–1265. doi: 10.2337/dc12-1503. [DOI] [PMC free article] [PubMed] [Google Scholar]
- 11.Finkel T, Deng CX, Mostoslavsky R. Recent progress in the biology and physiology of sirtuins. Nature. 2009;460(7255):587–591. doi: 10.1038/nature08197. [DOI] [PMC free article] [PubMed] [Google Scholar]
- 12.Sundaresan NR, Gupta M, Kim G, Rajamohan SB, Isbatan A, Gupta MP. Sirt3 blocks the cardiac hypertrophic response by augmenting Foxo3a-dependent antioxidant defense mechanisms in mice. J Clin Invest. 2009;119(9):2758–2771. doi: 10.1172/JCI39162. [DOI] [PMC free article] [PubMed] [Google Scholar]
- 13.Sundaresan NR, et al. SIRT3 blocks aging-associated tissue fibrosis in mice by deacetylating and activating glycogen synthase kinase 3β. Mol Cell Biol. 2015;36(5):678–692. doi: 10.1128/MCB.00586-15. [DOI] [PMC free article] [PubMed] [Google Scholar]
- 14.Finley LW, et al. SIRT3 opposes reprogramming of cancer cell metabolism through HIF1α destabilization. Cancer Cell. 2011;19(3):416–428. doi: 10.1016/j.ccr.2011.02.014. [DOI] [PMC free article] [PubMed] [Google Scholar]
- 15.Higgins DF, et al. Hypoxia promotes fibrogenesis in vivo via HIF-1 stimulation of epithelial-to-mesenchymal transition. J Clin Invest. 2007;117(12):3810–3820. doi: 10.1172/JCI30487. [DOI] [PMC free article] [PubMed] [Google Scholar]
- 16.Sun S, et al. Hypoxia-inducible factor-1alpha induces Twist expression in tubular epithelial cells subjected to hypoxia, leading to epithelial-to-mesenchymal transition. Kidney Int. 2009;75(12):1278–1287. doi: 10.1038/ki.2009.62. [DOI] [PubMed] [Google Scholar]
- 17.Schito L, Rey S. Hypoxic pathobiology of breast cancer metastasis. Biochim Biophys Acta Rev Cancer. 2017;1868(1):239–245. doi: 10.1016/j.bbcan.2017.05.004. [DOI] [PubMed] [Google Scholar]
- 18.Palmirotta R, et al. Sirtuins and cancer: role in the epithelial-mesenchymal transition. Oxid Med Cell Longev. 2016;2016:3031459. doi: 10.1155/2016/3031459. [DOI] [PMC free article] [PubMed] [Google Scholar]
- 19.Ding H, et al. Inhibiting aerobic glycolysis suppresses renal interstitial fibroblast activation and renal fibrosis. Am J Physiol Renal Physiol. 2017;313(3):F561–F575. doi: 10.1152/ajprenal.00036.2017. [DOI] [PubMed] [Google Scholar]
- 20.Guo X, Yan F, Li J, Zhang C, Bu P. SIRT3 attenuates AngII-induced cardiac fibrosis by inhibiting myofibroblasts transdifferentiation via STAT3-NFATc2 pathway. Am J Transl Res. 2017;9(7):3258–3269. [PMC free article] [PubMed] [Google Scholar]
- 21.Cui Y, et al. STAT3 regulates hypoxia-induced epithelial mesenchymal transition in oesophageal squamous cell cancer. Oncol Rep. 2016;36(1):108–116. doi: 10.3892/or.2016.4822. [DOI] [PMC free article] [PubMed] [Google Scholar]
- 22.Srivastava SP, et al. SIRT3 deficiency leads to induction of abnormal glycolysis in diabetic kidney with fibrosis. Cell Death Dis. 2018;9(10):997. doi: 10.1038/s41419-018-1057-0. [DOI] [PMC free article] [PubMed] [Google Scholar]
- 23.Majmundar AJ, Wong WJ, Simon MC. Hypoxia-inducible factors and the response to hypoxic stress. Mol Cell. 2010;40(2):294–309. doi: 10.1016/j.molcel.2010.09.022. [DOI] [PMC free article] [PubMed] [Google Scholar]
- 24.Kanasaki K, et al. Linagliptin-mediated DPP-4 inhibition ameliorates kidney fibrosis in streptozotocin-induced diabetic mice by inhibiting endothelial-to-mesenchymal transition in a therapeutic regimen. Diabetes. 2014;63(6):2120–2131. doi: 10.2337/db13-1029. [DOI] [PubMed] [Google Scholar]
- 25.Nagai T, et al. N-acetyl-seryl-aspartyl-lysyl-proline inhibits diabetes-associated kidney fibrosis and endothelial-mesenchymal transition. Biomed Res Int. 2014;2014:696475. doi: 10.1155/2014/696475. [DOI] [PMC free article] [PubMed] [Google Scholar]
- 26.Shi S, et al. Interactions of DPP-4 and integrin β1 influences endothelial-to-mesenchymal transition. Kidney Int. 2015;88(3):479–489. doi: 10.1038/ki.2015.103. [DOI] [PubMed] [Google Scholar]
- 27.Li J, et al. FGFR1 is critical for the anti-endothelial mesenchymal transition effect of N-acetyl-seryl-aspartyl-lysyl-proline via induction of the MAP4K4 pathway. Cell Death Dis. 2017;8(8):e2965. doi: 10.1038/cddis.2017.353. [DOI] [PMC free article] [PubMed] [Google Scholar]
- 28.Hato T, et al. Novel application of complementary imaging techniques to examine in vivo glucose metabolism in the kidney. Am J Physiol Renal Physiol. 2016;310(8):F717–F725. doi: 10.1152/ajprenal.00535.2015. [DOI] [PMC free article] [PubMed] [Google Scholar]
- 29.Mandel LJ. Metabolic substrates, cellular energy production, and the regulation of proximal tubular transport. Annu Rev Physiol. 1985;47:85–101. doi: 10.1146/annurev.ph.47.030185.000505. [DOI] [PubMed] [Google Scholar]
- 30.Wirthensohn G, Guder WG. Renal substrate metabolism. Physiol Rev. 1986;66(2):469–497. doi: 10.1152/physrev.1986.66.2.469. [DOI] [PubMed] [Google Scholar]
- 31.Kim J, Devalaraja-Narashimha K, Padanilam BJ. TIGAR regulates glycolysis in ischemic kidney proximal tubules. Am J Physiol Renal Physiol. 2015;308(4):F298–F308. doi: 10.1152/ajprenal.00459.2014. [DOI] [PMC free article] [PubMed] [Google Scholar]
- 32.Lee H, et al. Increased mitochondrial activity in renal proximal tubule cells from young spontaneously hypertensive rats. Kidney Int. 2014;85(3):561–569. doi: 10.1038/ki.2013.397. [DOI] [PMC free article] [PubMed] [Google Scholar]
- 33.Rowe I, et al. Defective glucose metabolism in polycystic kidney disease identifies a new therapeutic strategy. Nat Med. 2013;19(4):488–493. doi: 10.1038/nm.3092. [DOI] [PMC free article] [PubMed] [Google Scholar]
- 34.Zhang G, Darshi M, Sharma K. The Warburg effect in diabetic kidney disease. Semin Nephrol. 2018;38(2):111–120. doi: 10.1016/j.semnephrol.2018.01.002. [DOI] [PMC free article] [PubMed] [Google Scholar]
- 35.Sottnik JL, Lori JC, Rose BJ, Thamm DH. Glycolysis inhibition by 2-deoxy-D-glucose reverts the metastatic phenotype in vitro and in vivo. Clin Exp Metastasis. 2011;28(8):865–875. doi: 10.1007/s10585-011-9417-5. [DOI] [PubMed] [Google Scholar]
- 36.Lu J, Tan M, Cai Q. The Warburg effect in tumor progression: mitochondrial oxidative metabolism as an anti-metastasis mechanism. Cancer Lett. 2015;356(2 Pt A):156–164. doi: 10.1016/j.canlet.2014.04.001. [DOI] [PMC free article] [PubMed] [Google Scholar]
- 37.Zhao H, et al. Up-regulation of glycolysis promotes the stemness and EMT phenotypes in gemcitabine-resistant pancreatic cancer cells. J Cell Mol Med. 2017;21(9):2055–2067. doi: 10.1111/jcmm.13126. [DOI] [PMC free article] [PubMed] [Google Scholar]
- 38.Soga T. Cancer metabolism: key players in metabolic reprogramming. Cancer Sci. 2013;104(3):275–281. doi: 10.1111/cas.12085. [DOI] [PMC free article] [PubMed] [Google Scholar]
- 39.Greer SN, Metcalf JL, Wang Y, Ohh M. The updated biology of hypoxia-inducible factor. EMBO J. 2012;31(11):2448–2460. doi: 10.1038/emboj.2012.125. [DOI] [PMC free article] [PubMed] [Google Scholar]
- 40.Palsson-McDermott EM, et al. Pyruvate kinase M2 regulates Hif-1α activity and IL-1β induction and is a critical determinant of the Warburg effect in LPS-activated macrophages. Cell Metab. 2015;21(1):65–80. doi: 10.1016/j.cmet.2014.12.005. [DOI] [PMC free article] [PubMed] [Google Scholar]
- 41.Qi W, et al. Pyruvate kinase M2 activation may protect against the progression of diabetic glomerular pathology and mitochondrial dysfunction. Nat Med. 2017;23(6):753–762. doi: 10.1038/nm.4328. [DOI] [PMC free article] [PubMed] [Google Scholar]
- 42.Kanasaki K, Taduri G, Koya D. Diabetic nephropathy: the role of inflammation in fibroblast activation and kidney fibrosis. Front Endocrinol (Lausanne) 2013;4:7. doi: 10.3389/fendo.2013.00007. [DOI] [PMC free article] [PubMed] [Google Scholar]
- 43.Hasegawa K, et al. Renal tubular Sirt1 attenuates diabetic albuminuria by epigenetically suppressing Claudin-1 overexpression in podocytes. Nat Med. 2013;19(11):1496–1504. doi: 10.1038/nm.3363. [DOI] [PMC free article] [PubMed] [Google Scholar]
- 44.Nangaku M. Chronic hypoxia and tubulointerstitial injury: a final common pathway to end-stage renal failure. J Am Soc Nephrol. 2006;17(1):17–25. doi: 10.1681/ASN.2005070757. [DOI] [PubMed] [Google Scholar]
- 45.Maki T, et al. Amelioration of diabetic nephropathy by SGLT2 inhibitors independent of its glucose-lowering effect: A possible role of SGLT2 in mesangial cells. Sci Rep. 2019;9(1):4703. doi: 10.1038/s41598-019-41253-7. [DOI] [PMC free article] [PubMed] [Google Scholar]
- 46.Cassis P, et al. SGLT2 inhibitor dapagliflozin limits podocyte damage in proteinuric nondiabetic nephropathy. JCI Insight. 2018;3(15):98720. doi: 10.1172/jci.insight.98720. [DOI] [PMC free article] [PubMed] [Google Scholar]
- 47.Scafoglio CR, et al. Sodium-glucose transporter 2 is a diagnostic and therapeutic target for early-stage lung adenocarcinoma. Sci Transl Med. 2018;10(467):eaat5933. doi: 10.1126/scitranslmed.aat5933. [DOI] [PMC free article] [PubMed] [Google Scholar]
- 48.Cherney DZI, et al. Effects of empagliflozin on the urinary albumin-to-creatinine ratio in patients with type 2 diabetes and established cardiovascular disease: an exploratory analysis from the EMPA-REG OUTCOME randomised, placebo-controlled trial. Lancet Diabetes Endocrinol. 2017;5(8):610–621. doi: 10.1016/S2213-8587(17)30182-1. [DOI] [PubMed] [Google Scholar]
- 49.Zelniker TA, et al. SGLT2 inhibitors for primary and secondary prevention of cardiovascular and renal outcomes in type 2 diabetes: a systematic review and meta-analysis of cardiovascular outcome trials. Lancet. 2019;393(10166):31–39. doi: 10.1016/S0140-6736(18)32590-X. [DOI] [PubMed] [Google Scholar]
- 50.Perkovic V, et al. Canagliflozin and renal outcomes in type 2 diabetes and nephropathy. N Engl J Med. 2019;380(24):2295–2306. doi: 10.1056/NEJMoa1811744. [DOI] [PubMed] [Google Scholar]
Associated Data
This section collects any data citations, data availability statements, or supplementary materials included in this article.


