

Abstract
BACKGROUND:
The study of allergic drug reactions has been limited because of challenges in identifying and confirming cases.
OBJECTIVE:
To determine the utility of International Classification of Diseases, Ninth Revision, Clinical Modification (ICD-9-CM) codes for identifying inpatient allergic drug reactions and to compare findings with previous data in the emergency department.
METHODS:
By reviewing medical records of inpatients with ICD-9-CM codes and E codes suggestive of allergic drug reactions at a large urban academic medical center, we determined codes that yielded the most drug allergy cases and identified culprit drugs.
RESULTS:
In 2005 and 2010, 3337 and 5282 possible allergic drug reactions during hospitalization were identified and 1367 were reviewed. Allergic drug reactions were found in 409 (30.1%) of the reviewed charts, with 172 (29.7%) in 2005 and 237 (30.5%) in 2010. The codes that identified the highest percentage of true allergic drug reactions were dermatitis due to drug (693.0), allergic urticaria (708), angioneurotic edema (995.1), and anaphylaxis (995.0). Antibiotics were the most common cause (44.4%); however, multiple drug classes were often identified as likely culprit drugs.
CONCLUSION:
Specific ICD-9-CM codes can identify patients with allergic drug reactions, with antibiotics accounting for almost half of true reactions. Most patients with codes 693.0, 995.1, 708, and 995.0 had allergic drug reactions, with 693.0 as the highest yield code. An aggregate of multiple specific codes consistently identifies a cohort of patients with confirmed allergic drug reactions.
Keywords: International Classification of Diseases, Ninth Revision, Clinical Modification (ICD-9-CM) codes, Adverse drug reactions, Drug allergy, Drug hypersensitivity, Epidemiology
INTRODUCTION
Allergic drug reactions comprise less than 10% of adverse drug reactions (ADRs), but have a substantial negative impact on clinical outcomes and cost of care.1 Systematic study of the epidemiology of drug allergy has been difficult because of the challenge of identifying true cases in large data sets, and the chart review that is required to confirm case identification is time- and resource-intensive. Clinical epidemiology studies are increasingly relying on electronic medical records, including claims data and associated billing codes. International Classification of Diseases (ICD) codes are used to record the diagnosis for all patient encounters and may provide a valuable resource for identifying patients, but these codes are used primarily for billing, and individual physicians use a heterogeneous mixture of codes, making information inaccurate or incomplete.2 Researchers have found that specific conditions are often distributed across multiple codes.3,4
We previously demonstrated the utility of using a broad set of International Classification of Diseases, Ninth Revision, Clinical Modification (ICD-9-CM) codes and E codes in identifying cases of allergic drug reactions in the emergency department (ED).5 We confirmed an allergic drug reaction in 27% of the ED visits by studying these codes and determined the accuracy of the codes used through chart review. The codes that identified the highest percentage of true allergic drug reactions were dermatitis due to drug (693.0; 87%), adverse reaction to drug (995.2; 52%), and anaphylaxis (995.0; 38%). Because coding in different clinical settings may vary substantially, we evaluated the utility and accuracy of ICD-9 codes in the inpatient setting and compared findings with our previous ED data.5
METHODS
We reviewed random samples of medical records of inpatients treated in an academic medical center in 2005 and 2010. The year 2005 overlaps with our previous ED study time period (2001–2006), and the year 2010 provides a more recent time point.
Reaction identification
All selected medical records were reviewed by both a trained research assistant and a board-certified allergist/immunologist. We determined allergic drug reactions if identified by the primary or consulting physician and by the presence of allergic symptoms (including rash, angioedema, respiratory symptoms, or anaphylaxis) that were temporally related to the initiation of drug therapy and consistent with an immunologically mediated response to a drug.6,7 If there was disagreement between the reviewers, the case was reviewed by a second allergist. If described by a physician in the reviewed notes, the specific drug responsible for the reaction as well as symptoms documented in the note were recorded. Possible drug reaction with eosinophilia and systemic symptoms (DRESS) was identified if the specific term was used or rash, eosinophilia, and laboratory abnormalities were identified together. Possible Stevens-Johnson syndrome/toxic epidermal necrolysis (SJS/TEN) was identified if the term was used or mucosal lesions, blistering, skin detachment, or desquamating rash was identified.
After manual chart review, we determined the percentage of allergic drug reactions within each code and constructed a hierarchy of the codes on the basis of this frequency from the highest to the lowest. Duplicates were eliminated by allowing only 1 code per medical record number for each hospitalization and included under the highest place in the hierarchy they occurred.
Statistical analysis
Demographic characteristics among patients with and without drug allergic reactions were presented as numbers with frequencies or medians with interquartile ranges, and were compared using Wil-coxon rank sum test or the chi-square test. Frequencies of allergic drug reactions between years (2005 and 2010) and locations (inpatient and ED) were compared using chi-square tests. Two-sided P values less than .05 were considered significant. Statistical analyses were performed using SAS 9.4 (SAS Institute, Cary, NC). This study was approved by the Partners Human Research Committee.
RESULTS
ICD-9-CM codes to identify allergic drug reactions
We identified 3337 inpatient visits in 2005 and 5282 inpatient visits in 2010 with a possible allergic drug reaction. For 2005, 580 of the 3337 possible allergic drug reactions during hospitalization were reviewed and allergic drug reactions were identified in 172 (29.7%). The codes that identified the highest percentage of true allergic drug reactions were dermatitis due to drug (693.0; 81.7%), angioneurotic edema (995.1; 73.9%), and allergic urticaria (708; 60.0%) (Table I). For 2010, 777 of the 5282 possible allergic drug reactions during hospitalization were reviewed and allergic drug reactions were found in 237 (30.5%). The codes that identified the highest percentage of true allergic drug reactions were dermatitis due to drug (693.0; 76.8%), anaphylaxis (995.1; 65.4%), and allergic urticaria (708; 64.7%) (Table I). E codes without 1 of the ICD-9-CM codes for allergic drug reactions were not commonly used, and of charts reviewed with E codes, 6.7% in 2005 and 11.4% in 2010 were found to be associated with allergic drug reactions.
TABLE I.
Inpatient visits with allergic drug reactions by ICD-9-CM code in 2005 and 2010
| Hierarchy | ICD-9-CM code | Code description | No. of patients* | No. reviewed | % Reviewed | No. with drug allergy | % Drug allergy |
|---|---|---|---|---|---|---|---|
| 2005 | |||||||
| 1 | 693.0 | Dermatitis due to drug | 269 | 60 | 22.3 | 49 | 81.7 |
| 2 | 995.1 | Angioneurotic edema | 57 | 23 | 40.4 | 17 | 73.9 |
| 3 | 708.0 | Allergic urticaria | 34 | 20 | 58.8 | 12 | 60.0 |
| 4 | 995.0 | Anaphylaxis | 45 | 21 | 46.7 | 11 | 52.4 |
| 5 | 698.8 | Specified pruritus | 18 | 17 | 94.4 | 8 | 47.1 |
| 6 | 995.3 | Allergy unspecified | 72 | 18 | 25.0 | 7 | 38.9 |
| 7 | 995.2 | Unspecified adverse effect due to unspecified drug | 268 | 54 | 20.1 | 17 | 31.5 |
| 8 | 708.9 | Urticaria unspecified | 52 | 25 | 48.1 | 8 | 32.0 |
| 9 | 698.9 | Unspecified pruritus | 113 | 28 | 24.8 | 6 | 21.4 |
| 10 | 782.1 | Rash | 444 | 87 | 19.6 | 19 | 21.8 |
| 11 | 288.3 | Eosinophilia | 51 | 18 | 35.3 | 4 | 22.2 |
| E930–949 | E code† | 1914 | 209 | 10.9 | 14 | 6.7 | |
| Total | 3337 | 580 | 17.4 | 172 | 29.7 | ||
| 2010 | |||||||
| 1 | 693.0 | Dermatitis due to drug | 453 | 99 | 21.9 | 76 | 76.8 |
| 2 | 708.0 | Allergic urticaria | 67 | 24 | 35.8 | 15 | 62.5 |
| 3 | 995.0 | Anaphylaxis | 46 | 17 | 37.0 | 11 | 64.7 |
| 4 | 995.1 | Angioneurotic edema | 102 | 61 | 59.8 | 24 | 39.3 |
| 5 | 995.2 | Unspecified adverse effect due to unspecified drug | 807 | 98 | 12.1 | 38 | 38.8 |
| 6 | 995.3 | Allergy unspecified | 71 | 25 | 35.2 | 9 | 36.0 |
| 7 | 782.1 | Rash | 1079 | 110 | 10.2 | 23 | 20.9 |
| 8 | 698.8 | Specified pruritus | 37 | 26 | 70.3 | 5 | 19.2 |
| 9 | 698.9 | Unspecified pruritus | 151 | 38 | 25.2 | 5 | 13.2 |
| 10 | 288.3 | Eosinophilia | 213 | 51 | 23.9 | 6 | 11.8 |
| 11 | 708.9 | Urticaria unspecified | 37 | 26 | 70.3 | 2 | 7.7 |
| E930–949 | E code† | 2219 | 202 | 9.1 | 23 | 11.4 | |
| Total | 5282 | 777 | 14.7 | 237 | 30.5 |
Duplicated ICD-9-CM codes for the same patients during the same inpatient visit were deleted according to assigned hierarchy. Patients with both ICD-9-CM and E codes in the same inpatient visit were included under their ICD-9 codes.
External causes of injury and supplemental classification: drugs, medicinal, and biological substances causing adverse effects in therapeutic use.
Patient characteristics
The patient population, with and without allergic drug reactions, identified using these codes was similar between 2005 and 2010 (see Table E1 in this article’s Online Repository at www.jaci-inpractice.org).
Drugs causing hypersensitivity reactions
In total, 408 patients with allergic drug reactions were identified. The most common cause of allergic drug reactions was antibiotics (44.4% [n = 181]) (Figure 1). Of these patients, 17.1% (n = 31) were on multiple antibiotics, and the specific culprit drug could not be determined. Of the antibiotic reactions, vancomycin was the most common individual culprit drug, identified alone in 22.1% of antibiotic reactions and present in 33.7% of all antibiotic reactions. β-Lactams alone were identified in 13.8% of reactions and in 18.8% of all antibiotic reactions. Antibiotic reactions were primarily coded as dermatitis due to drug (693.0), unspecified effect due to drug (995.2), and rash (782.1), with these codes accounting for 70.2% of the antibiotic reactions.
FIGURE 1.
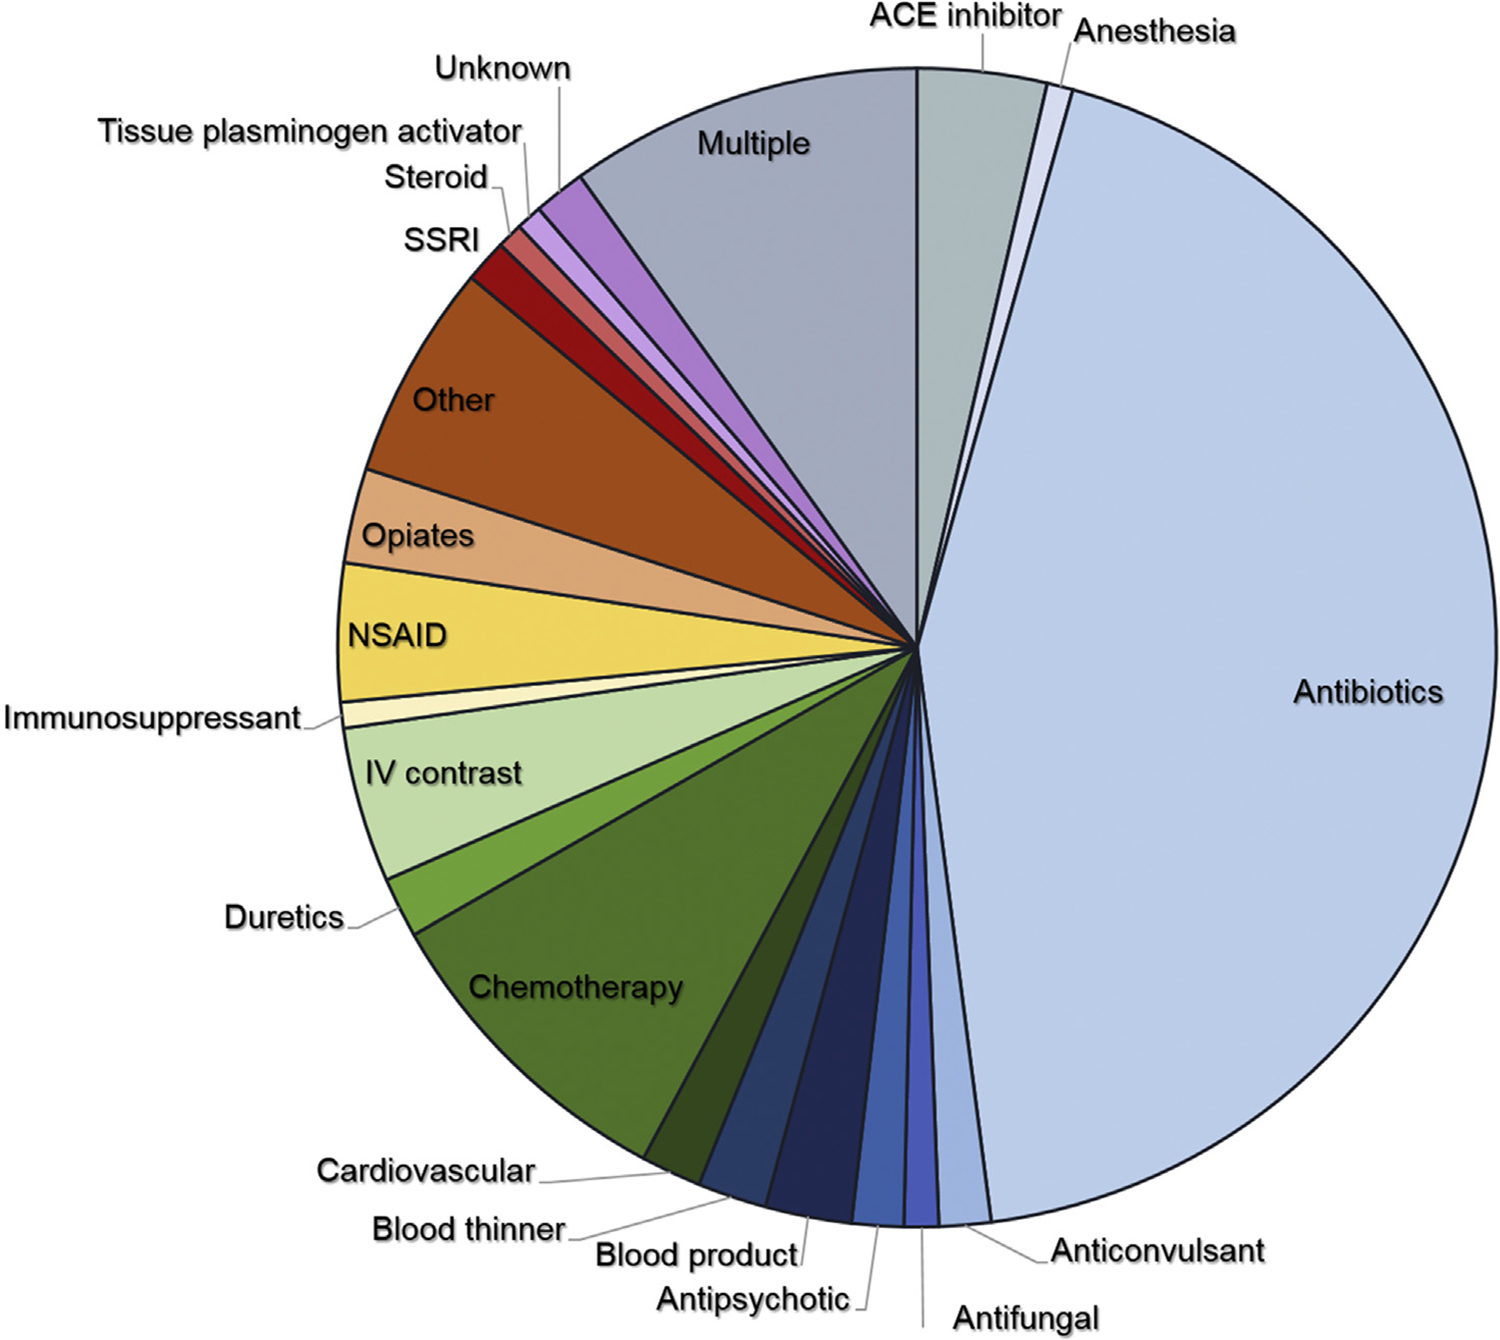
Patients (N = 408) identified with allergic drug reactions and their causative agents (cardiovascular drugs included antiarrhythmics, antihypertensives, β-blockers, and calcium channel blockers). IV, Intravenous; NSAID, nonsteroidal anti-inflammatory drug; SSRI, selective serotonin reuptake inhibitor.
The second most common cause of allergic drug reactions (10.5%) occurred in patients receiving multiple drugs where no clear culprit drug was identified (Figure 1). Sixty-eight percent of these reactions (in 28 of 41 patients) included an antibiotic. Other classes included anticonvulsants (17%), angiotensin-converting enzyme (ACE) inhibitors (12%), nonsteroidal anti-inflammatory drugs (10%), and intravenous contrast (7%). The third most common cause of allergic drug reactions was che-motherapeutics (9.1%), and these reactions were associated with the codes dermatitis due to drug (693.0) and unspecified adverse effect due to drug (995.2). These 2 codes accounted for 59.4% of reactions. ACE inhibitors made up a small percentage of reactions (3.4%), but were associated only with the code for angioedema (995.1). Blood products were primarily coded with urticaria, with 7 of the 10 reactions coded by 708 and 708.9. Reactions to opiates were primarily coded with pruritus, with 7 of the 11 reactions coded by 698.8 and 698.9.
Symptoms of allergic drug reactions
Rash was the most common symptom, occurring in 222 of the 408 reactions (54.4%), with urticaria accounting for 10.1% of patients with rash. Pruritus occurred in 20.6%, either with rash or with erythema. Angioedema was present in 65 of the 408 cases (15.9%). Respiratory symptoms occurred in 6.9% and anaphylaxis in 8.3%. Possible DRESS was suspected in 2.0%, and possible SJS/TEN was suspected in 2.5%.
Comparison between years and service location
In both 2005 and 2010, dermatitis due to drug (693.0) had the highest specificity, with allergic drug reactions found in 81.7% in 2005 and 76.8% in 2010 (Table II). This was also the most specific code in the ED study.5 There was no statistical difference between 2005 and 2010 in allergic urticaria (708.0), anaphylaxis (995.0), allergy unspecified (995.3), unspecified effect due to unspecified drug (995.2), and rash (782.1). There was a significant difference between 2005 and 2010 for angioedema (995.1), specified pruritus (698.8), and urticaria unspecified (708.9). In comparison with our previous ED data, significant differences were found between a few codes (Table II). Although the specific codes varied, 29.7% of patients reviewed in 2005 were found to have allergic drug reactions compared with 30.5% of patients in 2010 and 27.2% of patients from the ED study (Table II).5
TABLE II.
Comparison between ED visits with drug reaction and inpatient visits in 2005 and 2010
| Drug allergy (%) | ||||||||
|---|---|---|---|---|---|---|---|---|
| Hierarchy | ICD-9-CM code | Code description | Inpatient 2005 | Inpatient 2010 | P value | Inpatient (2005, 2010) | ED (2000–2006)5 | P value |
| 1 | 693 | Dermatitis due to drug | 81.7 | 76.8 | .47 | 78.6 | 86.7 | .051 |
| 2 | 995.2 | Unspecified adverse effect due to unspecified drug | 31.5 | 38.8 | .37 | 36.2 | 52.1 | .009 |
| 3 | 995 | Anaphylaxis | 52.4 | 64.7 | .44 | 57.9 | 38 | .047 |
| 4 | 708 | Allergic urticaria | 60 | 62.5 | .87 | 61.4 | 24.6 | <.001 |
| 5 | 995.1 | Angioneurotic edema | 73.9 | 39.3 | .005 | 48.8 | 23.2 | .001 |
| 6 | 995.3 | Allergy unspecified | 38.9 | 36 | .85 | 37.2 | 11.2 | <.001 |
| 7 | 698.8 | Specified pruritus | 47.1 | 19.2 | .05 | 30.2 | 27.1 | .74 |
| 8 | 698.9 | Unspecified pruritus | 21.4 | 13.2 | .37 | 16.7 | 21.2 | .49 |
| 9 | 782.1 | Rash | 21.8 | 20.9 | .87 | 21.3 | 15.6 | .11 |
| 10 | 708.9 | Urticaria unspecified | 32 | 7.7 | .03 | 19.6 | 17.6 | .75 |
| 11 | 288.3 | Eosinophilia | 22.2 | 11.8 | .28 | 14.5 | 4.9 | .12 |
| E930–949 | E code* | 6.7 | 11.4 | .10 | 8.7 | 12.4 | .11 | |
| Total | 29.7 | 30.5 | .36 | 30.1 | 27.2 | .08 | ||
External causes of injury and supplemental classification: drugs, medicinal, and biological substances causing adverse effects in therapeutic use.
DISCUSSION
We studied a broad set of ICD-9-CM codes and E codes to identify allergic drug reactions in the inpatient setting, validated and described cases, and compared findings over time and between locations. We found that despite variation in the specific coding, approximately 30% of reactions identified by the set of codes used were true allergic drug reactions, and this was consistent in both the 2005 and 2010 inpatient setting and our previous ED data. The most specific code was dermatitis due to drug (693.0), where approximately 80% of reactions were consistently found to be allergic drug reactions (ie, good specificity), but this code was used only in approximately 30% of patients identified as having an allergic drug reaction (ie, poor sensitivity). Our study demonstrates that a combination of billing codes for identification of allergic drug reactions better represents the rate of allergic drug reactions and the importance of detailed patient-level data to validate cases in various health care settings.
Interestingly, the coding of patients with allergic drug reactions differed for many of the codes between 2005 and 2010 as well as between the ED and inpatient settings. Given the nonspecific nature of many of the codes and the inconsistency in coding by providers, variation in coding would be expected in codes such as specified and unspecified pruritus and urticaria.2,8 Surprisingly, angioedema (995.1) had a significantly higher percentage of allergic drug reactions on review in 2005 than in 2010. The rate of angioedema associated with ACE inhibitors is largely stable at approximately 0.7%, and allergic drug reactions identified by the code for angioedema continue to be largely associated with ACE inhibitor use.9 Given that twice as many patients were identified in 2010 than in 2005 with the angioedema code, increased identification of patients with other causes of angioedema such as infection, autoimmune disease, and malignancy may account for the variance.10,11
Although antibiotics were the primary cause of allergic drug reactions as is well known, the second most common cause occurred in patients receiving multiple classes of drugs at the time of their reaction, which made identification of a single culprit drug difficult. Of these, 68% included an antibiotic, but other classes of drugs causing reactions were also observed, including anticonvulsants, ACE inhibitors, nonsteroidal anti-inflammatory drugs, and intravenous contrast. This finding was not observed in the previous ED study and was unique to the inpatient setting. The number of drugs given during a hospitalization has increased over time, and the risk of ADRs is known to increase with the number of medications given during a hospitalization. In a study of unplanned hospitalizations in older veterans, patients taking more than 5 medications were 4 times more likely to be hospitalized from ADR than patients taking less.12 In a retrospective study in an ED population, patients taking 2 concurrent medications had a 13% risk of an adverse drug interaction, rising to 38% for 4 medications and 82% for 7 or more medications prescribed simultaneously.13 When patients are receiving multiple medications, determining the culprit drug is difficult, which leads to more medications listed as allergies, which has an impact on future care.
SJS/TEN and DRESS are rare severe cutaneous adverse reactions with clear specific diagnosis codes.14–16 Given our focus on immediate reactions, we had not intended to capture SJS/TEN and DRESS in our data set because these reactions often take time to evolve before a clear diagnosis can be made. Our identification was solely on symptoms, and additional criteria would be needed to confirm the diagnosis, including progression and the use of billing codes specific for these diagnoses. In a study of billing codes for SJS/TEN, nonspecific codes were shown to identify a small percentage of patients with SJS/TEN, and additional criteria such as prolonged hospitalization improved the likelihood of true cases.17 Given the potentially high mortality rate of these reactions, early involvement of physicians specialized in allergy or dermatology in cases of suspected severe cutaneous adverse reactions may result in more timely diagnosis and improved patient outcomes.
In 2015, ICD-10-CM coding became the standard billing codes used in the United States. ICD-10 contains 4 times as many codes, increasing the specificity of coding.18,19 For many codes, particularly the codes used in this study, there is simple mapping of codes from ICD-9-CM to ICD-10-CM. For example, unspecified adverse effect due to unspecified drug (995.2) and angioedema (995.1) map to unspecified adverse effect of a drug (T88.7) and angioedema (T78.3). Similarly, dermatitis due to drugs and medicines taken internally (693.0) maps to generalized skin eruption due to drugs and medicaments taken internally (L27.0). Anaphylaxis (995.0) can now be more specifically mapped to its causative agent, which would be anaphylactic shock due to the adverse effect of a drug (T88.6) for allergic drug reactions. In a meta-analysis of studies of ADRs using ICD-10 billing codes, anaphylactic shock due to the adverse effect of a drug (T88.6) and unspecified adverse effect of a drug (T88.7) were among the top disease manifestation codes used to identify adverse drug in all studies, indicating the importance of these codes.18
Although algorithms using billing codes can be an important way to estimate allergic drug reactions, the limitation is the reliance on the provider coding the event, because even the most accurate code has a sensitivity of 80%. To compile large cohorts using billing codes, therefore, chart review continues to be necessary. Alternative methods to identify drug allergy cohorts with less chart review, such as natural language processing (NLP), may prove useful, particularly if used with billing codes to improve accuracy. Studies using NLP have begun to demonstrate its power in identifying events and patient pop-ulations.20,21 For example, an algorithm using ICD-9-CM codes and key terms was developed using NLP that could accurately identify patients with intracranial aneurysms with a positive predictive value of 86%.22 NLP showed comparable performance with clinician manual chart review for identification of ED patients with high suspicion of Kawasaki disease.23 NLP has been used to identify patient cohorts with gastrointestinal pathologies such as hepatocellular carcinoma and cirrhosis.24,25 For ADRs, NLP models were recently shown to accurately categorize medication-related events to help improve the efficiency of patient safety event review.26 We are currently studying using billing codes with NLP to improve drug allergy case-finding. With these methods, it may be possible to identify an allergic drug reaction while the patient is still hospitalized, allowing for review of the case by an allergist to help clarify the reaction and identify the culprit medication. This could help to prevent medications from being unnecessarily listed as allergies when there is another explanation for the symptoms.
CONCLUSIONS
The use of validated billing codes can identify allergic drug reactions in the inpatient setting and provide a valuable resource for the study of drug allergy epidemiology, allowing for a more accurate estimate of reaction rates. The accuracy of this estimate may be further enhanced by using multiple criteria for case identification including NLP. Understanding the clinical epidemiology of drug allergy is a crucial step in the prevention and management of these reactions.
What is already known about this topic?
Identifying cases of allergic drug reactions using billing codes provides valuable information for studying drug allergy epidemiology, but the accuracy of the coding and the variation between sites of health care delivery are not well established.
What does this article add to our knowledge?
We used chart review to validate specific International Classification of Diseases, Ninth Revision, Clinical Modification codes and E codes to identify patients with allergic drug reactions in the inpatient setting at a large academic medical center and describe the most common causative agents.
How does this study impact current management guidelines?
This study identifies the highest yield billing codes for allergic drug reactions in the inpatient setting, providing a platform for assembling larger drug allergy cohorts for epidemiological study.
Abbreviations used
- ACE
angiotensin-converting enzyme
- ADR
adverse drug reaction
- DRESS
drug reaction with eosinophilia and systemic symptoms
- ED
emergency department
- ICD
International Classification of Diseases
- ICD-9-CM
International Classification of Diseases, Ninth Revision, Clinical Modification
- NLP
natural language processing
- SJS/TEN
Stevens-Johnson syndrome/toxic epidermal necrolysis
ONLINE REPOSITORY
TABLE E1.
Characteristics of inpatients in 2005 and 2010
| 2005 | 2010 | |||||
|---|---|---|---|---|---|---|
| Characteristic | Visits with allergic drug reactions (n = 158) | Visits without allergic drug reactions (n = 388) | P value | Visits with allergic drug reactions (n = 222) | Visits without allergic drug reactions (n = 507) | P value |
| Age (y), median (IQR) | 56.4 (40.6–68.0) | 60.1 (42.3–73.1) | .06 | 61.9 (43.3–72.1) | 60.2 (45.3–72.6) | .94 |
| Sex: female, n (%) | 83 (53) | 95 (47) | .61 | 121 (55) | 267 (53) | .65 |
| Language, n (%) | .39 | |||||
| English | 148 (94) | 357 (92) | .79 | 200 (90) | 466 (92) | |
| Non-English | 7 (4) | 21 (5) | 20 (9) | 33 (7) | ||
| Unknown | 3 (2) | 10 (3) | 2 (1) | 8 (2) | ||
| Race/ethnicity, n (%) | .82 | .77 | ||||
| White | 133 (84) | 318 (82) | 178 (80) | 404 (80) | ||
| Black | 8 (5) | 16 (4) | 10 (5) | 31 (6) | ||
| Hispanic | 6 (4) | 25 (6) | 14 (6) | 28 (6) | ||
| Asian | 4 (3) | 9 (2) | 4 (2) | 11 (2) | ||
| Other | 3 (2) | 6 (2) | 4 (2) | 14 (3) | ||
| Unknown | 4 (3) | 14 (4) | 12 (5) | 18 (4) | ||
IQR, Interquartile range.
Footnotes
Conflicts of interest: The authors declare that they have no relevant conflicts of interest.
REFERENCES
- 1.Thong BY, Tan TC. Epidemiology and risk factors for drug allergy. Br J Clin Pharmacol 2011;71:684–700. [DOI] [PMC free article] [PubMed] [Google Scholar]
- 2.Strom BL. Data validity issues in using claims data. Pharmacoepidemiol Drug Saf 2001;10:389–92. [DOI] [PubMed] [Google Scholar]
- 3.West SL, D’Aloisio AA, Ringel-Kulka T, Waller AE, Clayton Bordley W. Population-based drug-related anaphylaxis in children and adolescents captured by South Carolina Emergency Room Hospital Discharge Database (SCERHDD) (2000–2002). Pharmacoepidemiol Drug Saf 2007;16:1255–67. [DOI] [PubMed] [Google Scholar]
- 4.Clark S, Gaeta TJ, Kamarthi GS, Camargo CA. ICD-9-CM coding of emergency department visits for food and insect sting allergy. Ann Epidemiol 2006; 16:696–700. [DOI] [PubMed] [Google Scholar]
- 5.Saff RR, Camargo CA, Clark S, Rudders SA, Long AA, Banerji A. Utility of ICD-9-CM codes for identification of allergic drug reactions. J Allergy Clin Immunol Pract 2016;4:114–119.e1. [DOI] [PubMed] [Google Scholar]
- 6.Joint Task Force on Practice Parameters; American Academy of Allergy, Asthma and Immunology; American College of Allergy, Asthma and Immunology; Joint Council of Allergy, Asthma and Immunology. Drug allergy: an updated practice parameter. Ann Allergy Asthma Immunol 2010; 105:259–73. [DOI] [PubMed] [Google Scholar]
- 7.Bose S, Guyer A, Long A, Banerji A. Evaluation and management of hypersensitivity to proton pump inhibitors. Ann Allergy Asthma Immunol 2013;111:452–7. [DOI] [PubMed] [Google Scholar]
- 8.Cherepanov D, Raimundo K, Chang E, Eagan M, Zazzali JL, Solari PG, et al. Validation of an ICD-9-based claims algorithm for identifying patients with chronic idiopathic/spontaneous urticaria. Ann Allergy Asthma Immunol 2015; 114:393–8. [DOI] [PubMed] [Google Scholar]
- 9.Banerji A, Blumenthal KG, Lai KH, Zhou L. Epidemiology of ACE inhibitor angioedema utilizing a large electronic health record. J Allergy Clin Immunol Pract 2017;5:744–9. [DOI] [PMC free article] [PubMed] [Google Scholar]
- 10.Moellman JJ, Bernstein JA, Lindsell C, Banerji A, Busse PJ, Camargo CA, et al. A consensus parameter for the evaluation and management of angioedema in the emergency department. Acad Emerg Med 2014;21:469–84. [DOI] [PMC free article] [PubMed] [Google Scholar]
- 11.Smith A, Ray M, Jain N, Zhang H, Sebelik M. The burden of angioedema on United States emergency departments: 2006–2010. Laryngoscope 2017;127: 828–34. [DOI] [PubMed] [Google Scholar]
- 12.Marcum ZA, Amuan ME, Hanlon JT, Aspinall SL, Handler SM, Ruby CM, et al. Prevalence of unplanned hospitalizations caused by adverse drug reactions in older veterans. J Am Geriatr Soc 2012;60:34–41. [DOI] [PMC free article] [PubMed] [Google Scholar]
- 13.Goldberg RM, Mabee J, Chan L, Wong S. Drug-drug and drug-disease interactions in the ED: analysis of a high-risk population. Am J Emerg Med 1996; 14:447–50. [DOI] [PubMed] [Google Scholar]
- 14.White KD, Abe R, Ardern-Jones M, Beachkofsky T, Bouchard C, Carleton B, et al. SJS/TEN 2017: building multidisciplinary networks to drive science and translation. J Allergy Clin Immunol Pract 2018;6:38–69. [DOI] [PMC free article] [PubMed] [Google Scholar]
- 15.Dodiuk-Gad RP, Chung WH, Valeyrie-Allanore L, Shear NH. Stevens-Johnson syndrome and toxic epidermal necrolysis: an update. Am J Clin Dermatol 2015; 16:475–93. [DOI] [PubMed] [Google Scholar]
- 16.Dodiuk-Gad RP, Laws PM, Shear NH. Epidemiology of severe drug hypersensitivity. Semin Cutan Med Surg 2014;33:2–9. [DOI] [PubMed] [Google Scholar]
- 17.Davis RL, Gallagher MA, Asgari MM, Eide MJ, Margolis DJ, Macy E, et al. Identification of Stevens-Johnson syndrome and toxic epidermal necrolysis in electronic health record databases. Pharmacoepidemiol Drug Saf 2015;24: 684–92. [DOI] [PMC free article] [PubMed] [Google Scholar]
- 18.Hohl CM, Karpov A, Reddekopp L, Doyle-Waters M, Stausberg J. ICD-10 codes used to identify adverse drug events in administrative data: a systematic review. J Am Med Inform Assoc 2014;21:547–57. [DOI] [PMC free article] [PubMed] [Google Scholar]
- 19.World Health Organization. International statistical classification of diseases and related health problems. 10th revision, 5th ed Geneva, Switzerland: World Health Organization; 2016. [Google Scholar]
- 20.Kreimeyer K, Foster M, Pandey A, Arya N, Halford G, Jones SF, et al. Natural language processing systems for capturing and standardizing unstructured clinical information: a systematic review. J Biomed Inform 2017;73:14–29. [DOI] [PMC free article] [PubMed] [Google Scholar]
- 21.Wi CI, Sohn S, Ali M, Krusemark E, Ryu E, Liu H, et al. Natural language processing for asthma ascertainment in different practice settings. J Allergy Clin Immunol Pract 2018;6:126–31. [DOI] [PMC free article] [PubMed] [Google Scholar]
- 22.Castro VM, Dligach D, Finan S, Yu S, Can A, Abd-El-Barr M, et al. Large-scale identification of patients with cerebral aneurysms using natural language processing. Neurology 2017;88:164–8. [DOI] [PMC free article] [PubMed] [Google Scholar]
- 23.Doan S, Maehara CK, Chaparro JD, Lu S, Liu R, Graham A, et al. Building a natural language processing tool to identify patients with high clinical suspicion for Kawasaki disease from emergency department notes. Acad Emerg Med 2016;23:628–36. [DOI] [PMC free article] [PubMed] [Google Scholar]
- 24.Chang EK, Yu CY, Clarke R, Hackbarth A, Sanders T, Esrailian E, et al. Defining a patient population with cirrhosis: an automated algorithm with natural language processing. J Clin Gastroenterol 2016;50:889–94. [DOI] [PubMed] [Google Scholar]
- 25.Sada Y, Hou J, Richardson P, El-Serag H, Davila J. Validation of case finding algorithms for hepatocellular cancer from administrative data and electronic health records using natural language processing. Med Care 2016;54:e9–14. [DOI] [PMC free article] [PubMed] [Google Scholar]
- 26.Fong A, Harriott N, Walters DM, Foley H, Morrissey R, Ratwani RR. Integrating natural language processing expertise with patient safety event review committees to improve the analysis of medication events. Int J Med Inform 2017;104:120–5. [DOI] [PubMed] [Google Scholar]