Abstract
Cyclic nucleotide second messengers are increasingly implicated in prokaryotic anti-viral defence systems. Type III CRISPR systems synthesise cyclic oligoadenylate (cOA) upon detecting foreign RNA, activating ancillary nucleases that can be toxic to cells, necessitating mechanisms to remove cOA in systems that operate via immunity rather than abortive infection. Previously, we demonstrated that the Sulfolobus solfataricus type III-D CRISPR complex generates cyclic tetra-adenylate (cA4), activating the ribonuclease Csx1, and showed that subsequent RNA cleavage and dissociation acts as an ‘off-switch’ for the cyclase activity. Subsequently, we identified the cellular ring nuclease Crn1, which slowly degrades cA4 to reset the system (Rouillon et al., 2018), and demonstrated that viruses can subvert type III CRISPR immunity by means of a potent anti-CRISPR ring nuclease variant AcrIII-1. Here, we present a comprehensive analysis of the dynamic interplay between these enzymes, governing cyclic nucleotide levels and infection outcomes in virus-host conflict.
Research organism: E. coli
Introduction
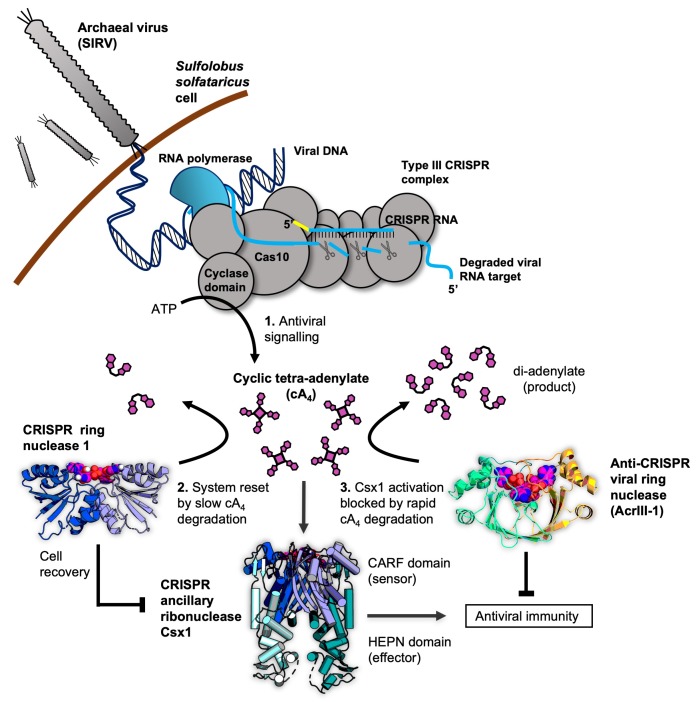
CRISPR systems are widespread in archaea and bacteria, providing adaptive immunity against invading mobile genetic elements (MGE) (Sorek et al., 2013; Makarova et al., 2020). Type III CRISPR systems (Figure 1) are multi-functional effector proteins that have specialised in the detection of foreign RNA (Tamulaitis et al., 2017; Zhu et al., 2018). The large subunit, Cas10, harbours two enzyme active sites that are activated by target RNA binding: a DNA-cleaving HD nuclease domain (Samai et al., 2015; Elmore et al., 2016; Estrella et al., 2016; Kazlauskiene et al., 2016) and a cyclase domain for cyclic oligoadenylate (cOA) synthesis (Kazlauskiene et al., 2017; Niewoehner et al., 2017; Rouillon et al., 2018). The third enzymatic activity of type III systems is situated in the Cas7 subunit of the complex, which cleaves bound RNA targets and in turn regulates Cas10 enzymatic activities (Tamulaitis et al., 2014; Rouillon et al., 2018; Johnson et al., 2019; Nasef et al., 2019). The cyclase domain polymerises ATP into cOA species consisting of between 3 and 6 AMP subunits (denoted cA3, cA4 etc.), in varying proportions (Kazlauskiene et al., 2017; Niewoehner et al., 2017; Rouillon et al., 2018; Grüschow et al., 2019; Nasef et al., 2019). cOA second messengers activate CRISPR ancillary nucleases of the Csx1/Csm6, Can1 (CRISPR associated nuclease 1) and NucC families, which drive the immune response against MGEs (Kazlauskiene et al., 2017; Niewoehner et al., 2017; Rouillon et al., 2018; Grüschow et al., 2019; Lau et al., 2020; McMahon et al., 2020). To date, cA4 appears to be the most widely used signalling molecule by type III CRISPR systems (Grüschow et al., 2019). The ribonuclease activity of Csx1/Csm6 is crucial for the clearance of MGEs (Hatoum-Aslan et al., 2014; Foster et al., 2019; Grüschow et al., 2019), particularly when viral genes are transcribed late in infection, at low levels or mutated (Hatoum-Aslan et al., 2014; Jiang et al., 2016; Rostøl and Marraffini, 2019).
Figure 1. Cartoon of type III CRISPR cyclic nucleotide signalling and defence in Sulfolobus solfataricus.
The Cas10 subunit of the type III CRISPR complex synthesises cyclic tetra-adenylate (cA4) when viral RNA transcripts are detected. Target RNA cleavage shuts-off cA4 synthesis. cA4 binds to the CARF (CRISPR associated Rossmann Fold) domain of CRISPR ancillary nuclease Csx1 and allosterically activates its HEPN (Higher Eukaryotes and Prokaryotes Nucleotide binding) domain, which degrades RNA non-specifically within the cell. Extant cA4 is degraded slowly by CRISPR ring nucleases (Crn1 family) which likely facilitate cell recovery after clearing the virus. Viral anti-CRISPR ring nucleases (AcrIII-1 family) degrade cA4 rapidly to stop activation of ancillary defence enzymes such as Csx1 and supress antiviral immunity.
In our previous study, we demonstrated that the type III-D system from Sulfolobus solfataricus synthesises predominantly cA4, which activates the CRISPR ancillary ribonuclease Csx1. We examined the first regulatory step in cOA synthesis in detail and demonstrated that target RNA cleavage and dissociation from the complex shut-off cOA synthesis (Rouillon et al., 2018). Since CRISPR ancillary nucleases degrade nucleic acids non-specifically, cellular as well as viral targets are destroyed. Collateral cleavage of self-transcripts by a Csm6 enzyme has previously been shown to result in cell growth arrest (Rostøl and Marraffini, 2019). Therefore, in addition to regulating the synthesis of cOA, cells need a mechanism to remove extant cOA if they are to return to normal growth. To solve this problem, S. solfataricus encodes CRISPR-associated ring nuclease 1 (Crn1) family enzymes (Athukoralage et al., 2018). Crn1 enzymes slowly degrade cA4 to yield di-adenylate products incapable of activating Csx1. In other species Csm6 proteins have evolved catalytic CARF domains capable of degrading cA4, thereby acting as their own ‘off-switches’ to their RNase activity (Athukoralage et al., 2019; Jia et al., 2019). Unsurprisingly, archaeal viruses and bacteriophage have co-opted this regulatory strategy in order to subvert type III CRISPR defence. Many archaeal viruses and bacteriophage encode a ring nuclease anti-CRISPR (AcrIII-1), unrelated to Crn1, which neutralises the type III response by rapidly degrading cA4 to prevent ancillary nuclease activation (Athukoralage et al., 2020).
It is clear that the cA4 antiviral second messenger is at the centre of a network of interactions that are crucial for effective type III CRISPR defence against MGE. Here, we show that detection of even a single molecule of invading RNA has the potential to generate a large signal amplification via synthesis of cA4 that in turn activates the non-specific degradative ribonuclease Csx1. We explore how a cellular ring nuclease can return the cell to a basal state and how viruses can subvert the system. By quantifying and modelling the equilibria and reactions that take place in the arena of type III CRISPR defence, we build a comprehensive model of this dynamic, life or death process.
Results
While the control of cOA synthesis by target RNA binding and cleavage is now understood reasonably well, the full implications of cOA generation in a virally-infected cell are not. This requires a detailed knowledge of the levels of cOA produced, consequences for antiviral defence enzymes and the effects of cOA degrading enzymes from cellular and viral sources. These were the aims of our study.
Signal amplification on cA4 production
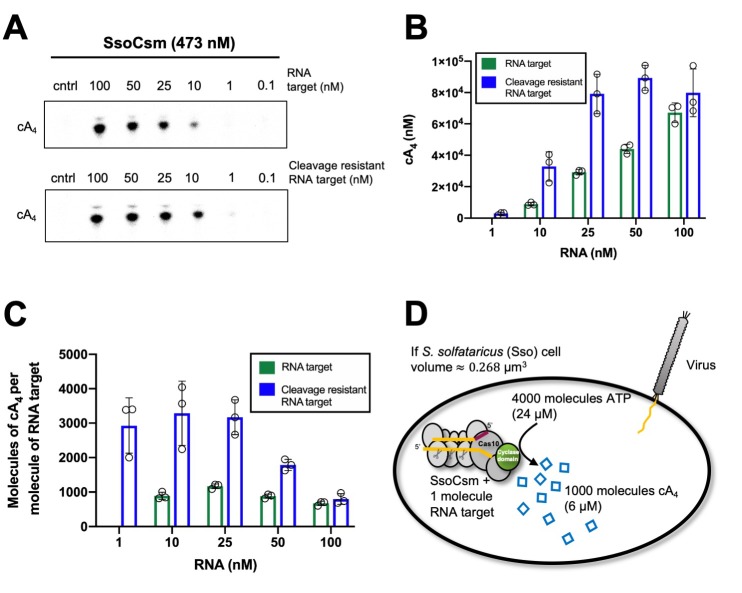
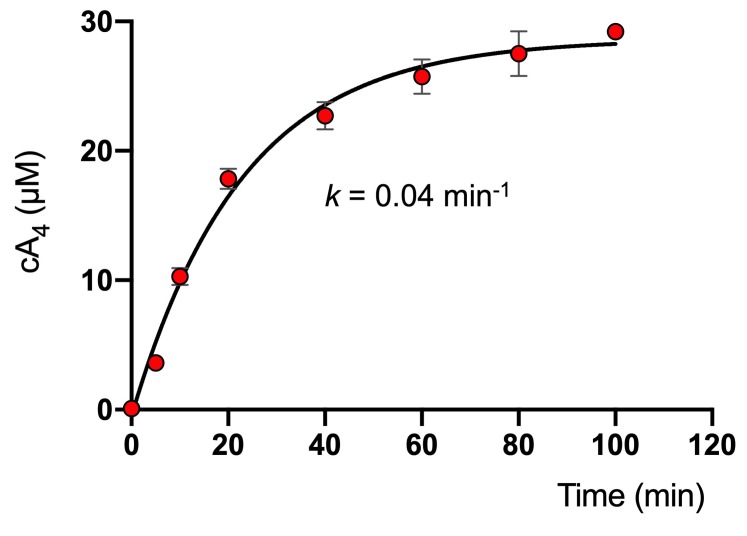
We first investigated the extent of signal amplification that occurs in a cell from detection of a single viral RNA and generation of the cA4 second messenger. Using the S. solfataricus type III-D CRISPR effector, we varied the concentration of target RNA and quantified the resultant cA4 production. As previously observed (Rouillon et al., 2018), increasing the target RNA concentration resulted in increased cA4 production (Figure 2). Quantification of the concentration of cA4 generated was accomplished by using α-32P-ATP and quantification of products using a phosphorimager in comparison to standards (Figure 2—figure supplement 1). We observed that approximately 1000 molecules (980 ± 24) of cA4 were generated per molecule of RNA, over a range of 10–100 nM target RNA (Figure 2). When a poorly-cleavable target RNA species containing phosphorothioates was used as the substrate, the amount of cA4 generated increased approximately 3-fold (3100 ± 750, Figure 2), confirming the important role of RNA cleavage for deactivation of the cyclase domain (Rouillon et al., 2018; Nasef et al., 2019). Additionally, analysis of previously published data enabled us to determine the catalytic rate constant (k) of cA4 synthesis by the S. solfataricus type III effector as 0.04 ± 0.01 min−1 at 70°C (Figure 2—figure supplement 2).
Figure 2. Approximately 1000 molecules cA4 are made per molecule of RNA target.
(A) Upper panel shows phosphorimages of thin-layer chromatography of cyclic tetra-adenylate (cA4) made by S. solfataricus (Sso) Csm complex (470 nM carrying the CRISPR RNA A26) across a range of RNA target concentrations (0.1, 1, 10, 25,100 nM) complementary to the A26 CRISPR RNA at 70°C. Lower panel shows cA4 synthesised with a cleavage resistant (phosphorothioate) form of the RNA target. (B) Bar graph of the concentration of cA4 generated with increasing cleavable and cleavage-resistant RNA target generated by quantifying the densiometric signals from A, with an α-32P-ATP standard curve (Figure 2—figure supplement 1). Error bars indicate the standard deviation of the mean of three technical replicates, with individual data points shown as clear circles. No data are shown for 1 nM cleavable RNA target as cA4 generated was below detection limits. (C) Bar chart quantifying the number of molecules of cA4 generated per molecule of cleavable or cleavage resistant target RNA across a range of RNA target concentrations. On average SsoCsm synthesised 980 ± 24 and 3100 ± 750 molecules of cA4 per molecule of cleavable and cleavage resistant target RNA, respectively. (D) Cartoon depicting the cellular implications of ~1000 molecules of cA4 generated per molecule of RNA target, which in S. solfataricus would equate to ~6 µM cA4 within the cell.
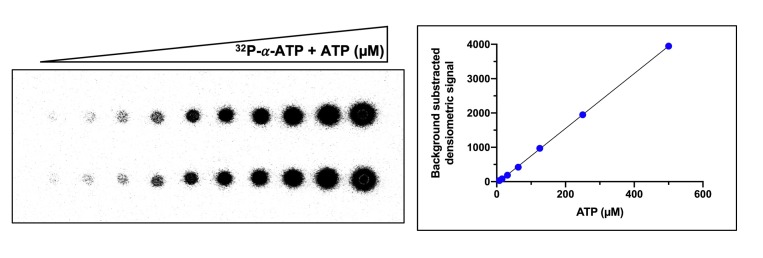
Figure 2—figure supplement 1. Example of ATP standard curve used to determine the concentration of ATP converted to cyclic tetra-adenylate (cA4).
Figure 2—figure supplement 2. Rate of cA4 synthesis by S. solfataricus type III-D effector complex.
Given that S. solfataricus cells are cocci with a diameter of approximately 0.7 µm, the volume of an average cell can be calculated as approximately 0.3 fL (by comparison, E. coli has a cell volume of 1 fL [Kubitschek and Friske, 1986]). Using Avogadro’s number, 1000 molecules equates to an intracellular concentration of 6 µM cA4 in S. solfataricus. Thus, detection of one viral RNA in the cell could result in the synthesis of 6 µM cA4, 10 RNAs – 60 µM, etc. The upper limits of cA4 generation could be defined by the number of viral target RNAs present, the number of type III effectors carrying a crRNA matching that target, or even conceivably the amount of ATP available for cA4 generation.
Kinetic parameters of the Csx1 ribonuclease
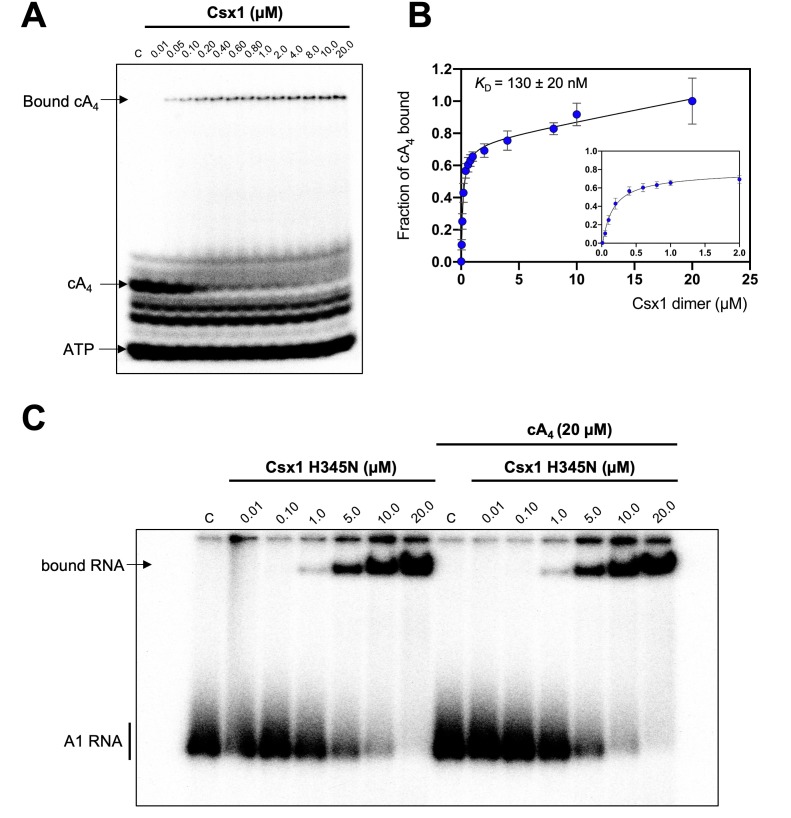
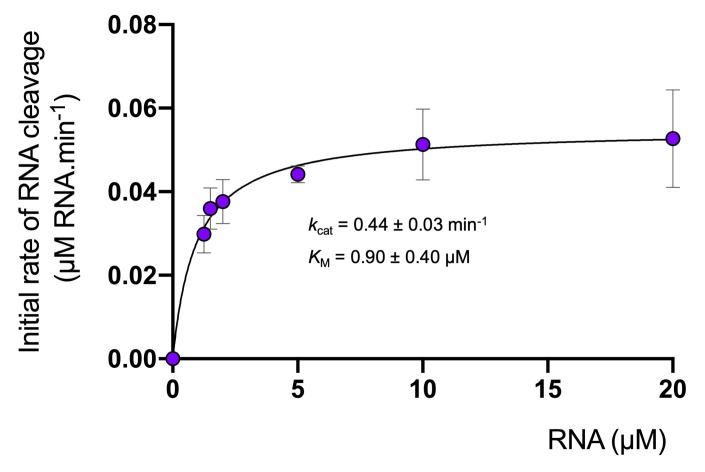
The cA4 second messenger binds to CARF family proteins to elicit an immune response. To understand the concentration of cA4 required to activate an antiviral response, we determined the dissociation constant of the major ancillary ribonuclease Csx1 for the cA4 activator. Using radioactive cA4, we titrated an increasing concentration of Csx1 protein and subjected the mixture to native gel electrophoresis (Figure 3A,B). cA4 was bound by Csx1 with a dissociation constant (KD) of 130 ± 20 nM. Thus, even one viral target RNA detected by the type III CRISPR system should generate enough cA4 (6 µM) to fully activate the Csx1 ribonuclease for defence. We proceeded to estimate the binding affinity of a ribonuclease-deficient Csx1 variant for its RNA target, yielding an apparent dissociation constant of approximately 5 µM (Figure 3C). Finally, we measured the initial velocity of RNA degradation at a variety of RNA concentrations under steady state conditions and determined the multiple-turnover kinetic constant (kcat) for cA4-activated RNA cleavage by Csx1 as 0.44 ± 0.03 min−1 at 70°C (Figure 4).
Figure 3. Csx1 binds cA4 with high affinity and RNA with relatively low affinity.
(A) Phosphorimage of native gel electrophoresis visualising cA4 (20 nM) binding by Csx1 (concentrations as indicated in the figure). The other bands visible are due to unreacted ATP and other linear nucleotide products. (B) Plot of fraction of cA4 bound by Csx1. Error bars indicate the standard deviation of the mean of four technical replicates and the data were fitted to a quadratic equation incorporating a term for non-specific binding. The inset plot is a magnification of cA4 binding between 0.01 and 5 µM Csx1 dimer concentrations. (C) Phosphorimage of native gel electrophoresis visualising A1 substrate RNA binding by Csx1 H345N protein dimer in the absence (left hand-side) or presence (right hand-side) of unlabelled cA4 (20 µM). The image shown is representative of three technical replicates. Control c – RNA alone.
Figure 4. Degradation of RNA by Csx1.
Analysis of multiple-turnover, steady state kinetics of A1 RNA cleavage by Csx1 (125 nM dimer) at 70°C. The data were fitted to the Michaelis-Menten equation and error bars show the standard deviation of the mean of three technical replicates.
Kinetic and equilibrium constants of the ring nucleases Crn1 and AcrIII-1
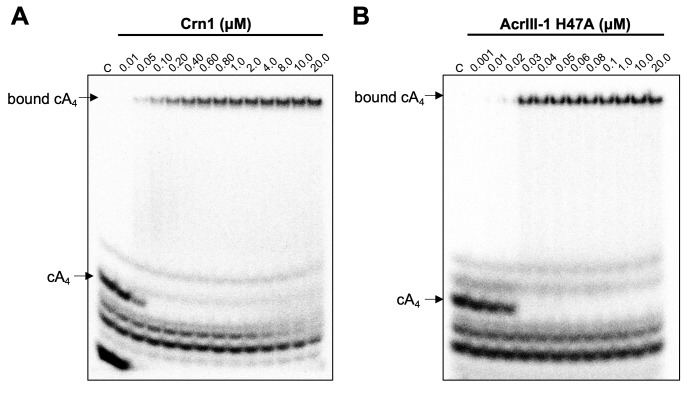
We have previously established that Crn1 cleaved cA4 at a rate of 0.089 ± 0.003 min−1 at 50°C, while AcrIII-1 cleaved cA4 at a rate of 5.4 ± 0.38 min−1, about 60-fold faster (Athukoralage et al., 2020). The difference in reaction rates probably reflects the different roles of the two enzymes, with Crn1 working in conjunction with the type III CRISPR defence and AcrIII-1 opposing it. To quantify the interaction between ring nucleases and cA4, we titrated radioactively labelled cA4 with either Crn1 or AcrIII-1 and visualised cA4 binding by phosphorimaging following native gel electrophoresis. Crn1 bound cA4 with an apparent KD of ~50 nM, while the inactive H47A variant of AcrIII-1 bound cA4 with an apparent KD of ~25 nM (Figure 5). Thus, both ring nucleases bound cA4 three to four-fold more tightly than Csx1.
Figure 5. Crn1 and AcrIII-1 bind cA4 with high affinity.
Phosphorimages of native gel electrophoresis visualising radiolabelled cyclic oligoadenylate (cOA) binding by (A) Crn1 (B) and catalytically inactive AcrIII-1 (SIRV1 gp29 H47A). Crn1 binds cA4 (10 nM) with an apparent dissociation constant (KD) of ~50 nM, whereas AcrIII-1 binds cA4 with an apparent KD of ~25 nM. The images shown are representative of three technical replicates. Control c – cOA alone. The other bands near the bottom of the gel are caused by unreacted ATP and other linear products.
Kinetic modelling of the antiviral signalling pathway and its regulation by cA4 degrading enzymes
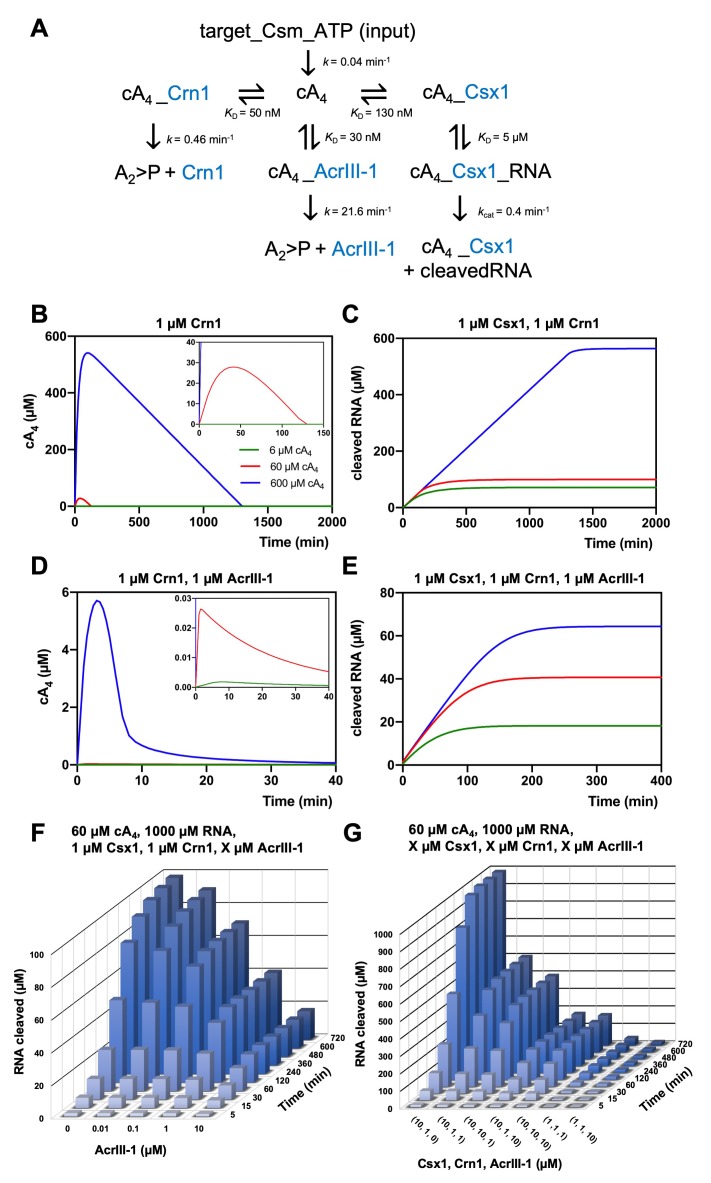
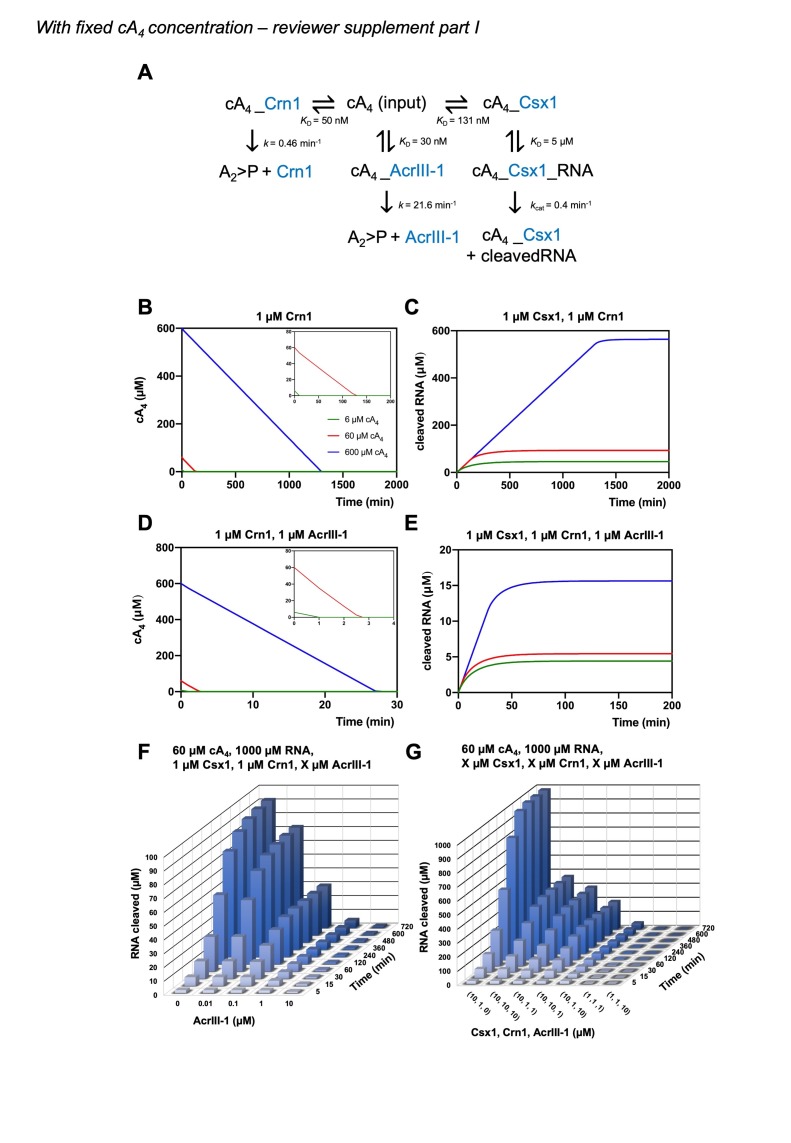
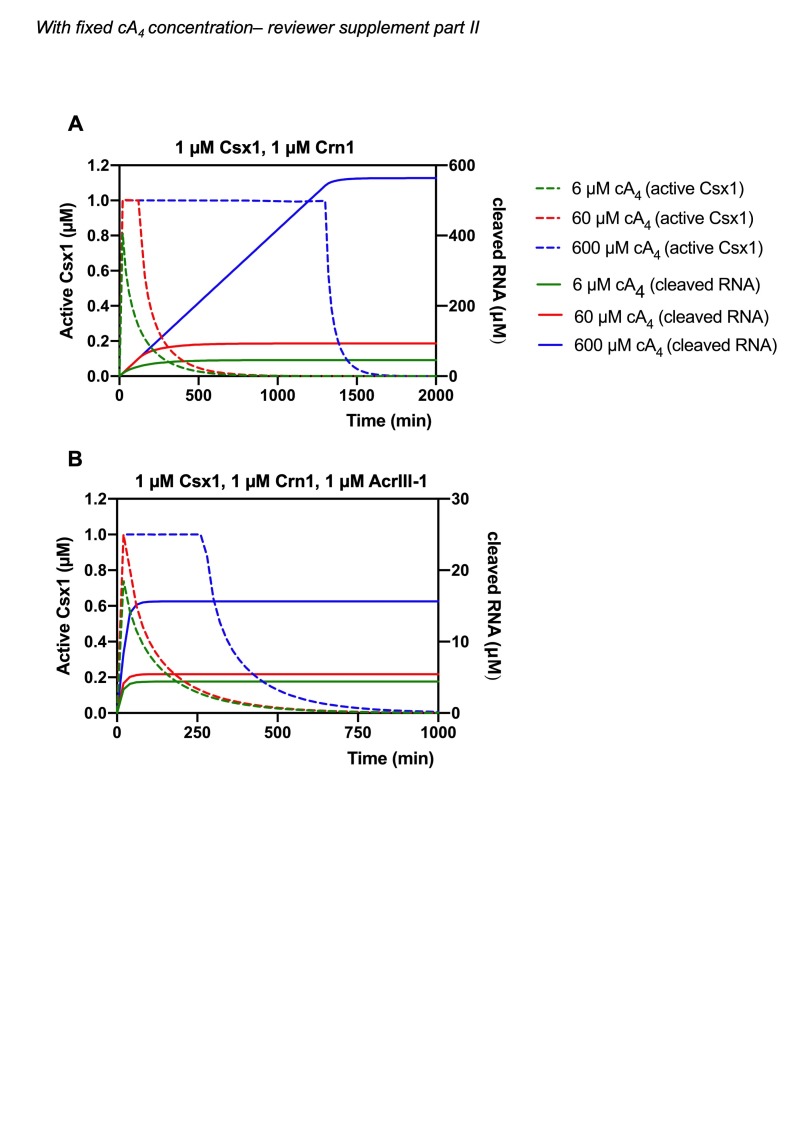
We entered the experimentally determined kinetic and equilibria parameters into the KinTek Global Kinetic Explorer software package and generated a model to simulate RNA degradation by Csx1 and the effects of ring nucleases over time (Figure 6A). Enzyme concentrations were set initially at 1 µM, based on published studies of transcript levels (Ortmann et al., 2008; Wurtzel et al., 2010), but were varied during modelling to assess the influence of enzyme concentration on RNA cleavage. We standardised the reaction temperature at 70°C, close to the growth temperature of S. solfataricus. This necessitated an estimation of the rate constants of Crn1 and AcrIII-1, which were measured at lower temperatures, based on a 2-fold increase in activity for each 10°C rise in temperature, in line with our previous studies of these enzymes (Athukoralage et al., 2018; Athukoralage et al., 2020). To model the generation of cA4 by the Csm:target RNA complex, we set the concentration of that complex at 6, 60 or 600 µM (equivalent to low, medium and high levels of infection), allowing the generation of the equivalent concentration of cA4 with the measured rate constant of 0.04 min−1 (Figure 6A). Henceforth, this will be referred to as 6, 60 or 600 µM cA4 for simplicity.
Figure 6. Modelling of S. solfataricus antiviral signalling.
(A) Schematic showing kinetic and equilibrium parameters inserted into the KinTek Global Kinetic Explorer software for modelling the type III CRISPR defence illustrated in Figure 1. Parameters have been determined in this study with the following exceptions: Crn1 rate constant of 0.46 min−1 at 70°C estimated from rate of 0.23 min−1 measured at 60°C and AcrIII-1 rate constant of 21.6 min−1 at 70°C estimated from rate of 5.4 min−1 measured at 50°C (Athukoralage et al., 2020). The parameter ‘target-Csm-ATP’ was set at 6, 60 or 600 µM in simulations. Underscores connecting two variables indicate their relationship in a complex. cA4, cyclic tetra-adenylate; Crn1, CRISPR ring nuclease 1; AcrIII-1, viral ring nuclease anti-CRISPR SIRV1 gp29; Csx1, CRISPR ancillary ribonuclease; A2 >P, di-adenylate containing 2’,3’ cyclic phosphate (product of cA4 cleavage). (B) Free cA4 (600 µM, blue; 60 µM, red; 6 µM, green) concentration and (C), RNA cleavage in presence of 1 µM Crn1 and 1 µM Csx1. (D) and (E) show equivalent plots in the presence of 1 µM AcrIII-1. Insets where present show a magnified view of the start of each plot. (F) 3D plot visualising concentration of RNA (1000 µM at start) cleaved by Csx1 in response to 60 µM cA4 made by Csm complex, 1 µM Crn1 and varying amounts of AcrIII-1 across a range of doubling endpoints. (G) 3D plot visualising concentration of RNA (1000 µM at start) cleaved by Csx1 in response to 60 µM cA4 made by Csm complex, and varying concentrations of Csx1, Crn1 and AcrIII-1 enzymes.
Figure 6—figure supplement 1. Modelling of RNA cleavage by Csx1 stimulated by cA4 synthesised in response to varying target RNA concentrations.
Figure 6—figure supplement 2. Modelling of the relationship between Csx1 RNA cleavage and deactivation by ring nucleases with varying cA4 concentrations.
Figure 6—figure supplement 3. Modelling of the effect of varying AcrIII-1 concentration on RNA cleaved by Csx1 in response to cA4 generated by 600 µM target RNA.
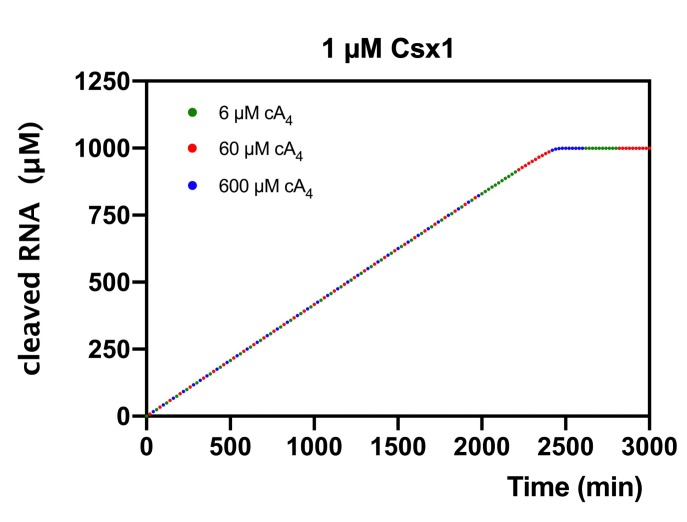
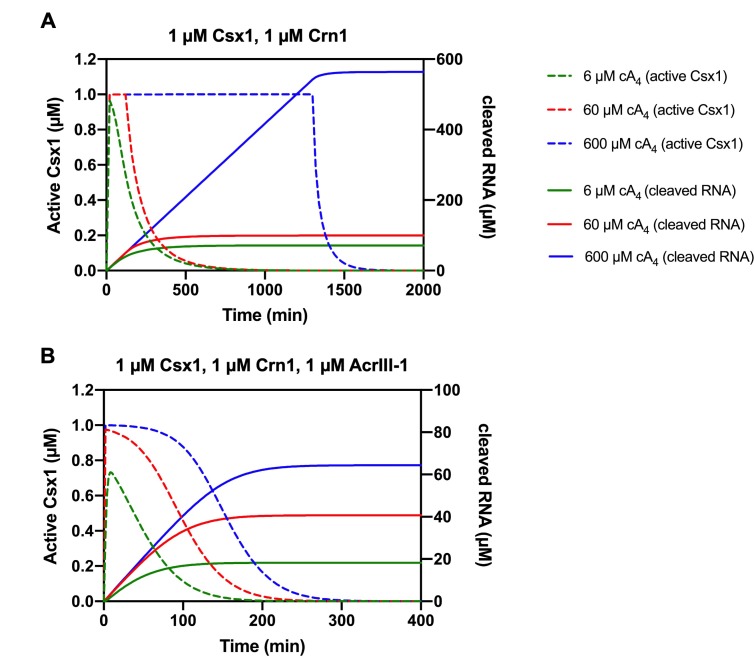
In the absence of any ring nuclease activity, 1 µM Csx1 was fully activated, degrading all 1000 µM RNA provided in the simulation within 2400 min, regardless of the simulated level of infection (Figure 6—figure supplement 1). The lack of titration of Csx1 activity observed here is due to its high affinity for cA4, resulting in full activation even at very low simulated infection levels. We observed a rapid initial increase in the levels of cA4 due to synthesis by the activated Csm complex (Figure 6B). In the simulations, 1 µM Crn1 degraded 60 µM cA4 within 120 min, but took over 1200 min to degrade 600 µM cA4 (Figure 6B). These differences were reflected in the levels of Csx1-mediated RNA degradation, which were much higher for 600 µM cA4 than for the lower concentrations (Figure 6C). Thus, the kinetic modelling demonstrated that addition of a ring nuclease activity allows the cell to respond differently to varied levels of infection, and therefore cA4 concentration, resulting in a range of RNA degradation levels.
We next introduced the AcrIII-1 enzyme to the simulation, to model the effect of the Acr on the host defence system. Strikingly, when AcrIII-1 was present at 1 µM, even 600 µM cA4 was degraded rapidly (the bulk within 10 min). As a result, Csx1 activity and therefore RNA degradation were strongly supressed (Figure 6D,E). The long tail of cA4 observed in these simulations represents cA4 bound to the Csx1 enzyme and thus unavailable for degradation by AcrIII-1, reflected in the persistence of active Csx1-cA4 complex in the simulations over an extended period (Figure 6—figure supplement 2). Notably, at the highest simulated infection level of 600 µM cA4, Csx1 persists in a 100% activated form for over 1200 min in the absence of AcrIII-1, but is reduced to 50% activated within 150 min in its presence, with similar effects seen at lower cA4 concentrations (Figure 6—figure supplement 2).
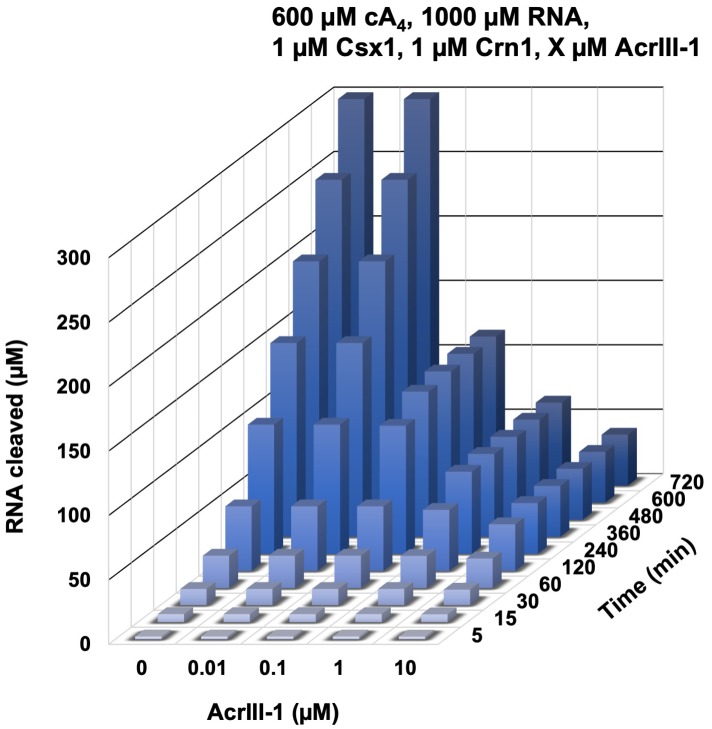
The concentration of AcrIII-1 within S. solfataricus cells during infection is not known. We therefore varied AcrIII-1 concentration in the model (with 60 µM cA4, 1 µM Csx1 and Crn1) and simulated RNA cleavage (Figure 6F). AcrIII-1 concentrations as low as 100 nM reduced RNA cleavage by about 30%, and higher levels reduced RNA cleavage by Csx1 markedly (Figure 6F). This relationship held in simulations with 600 µM cA4 (Figure 6F, Figure 6—figure supplement 3). During infection, a positive correlation between AcrIII-1 concentration and viral transcript levels would be required for continued escape from Csx1-mediated CRISPR defence – a reasonable assumption. Finally, we simulated the effects of increasing Csx1 on RNA cleavage in our infection model. Increasing Csx1 concentration 10-fold led to a significantly more robust immune response (reflected in high levels of RNA degradation) (Figure 6G) that could not be fully overcome by increasing the concentrations of Crn1 or AcrIII-1 in proportion (compare for example 10,10,10 with 1,1,1 µM in Figure 6G). Hence, increasing the expression levels of defence nucleases such as Csx1 in response to viral infection could provide an effective means for cells to combat viruses armed with Acrs such as AcrIII-1, but perhaps with the cost of increased toxicity.
Discussion
Signal amplification in type III CRISPR defence
In this study, we used biochemical data to build a kinetic model of the type III CRISPR antiviral signalling pathway within S. solfataricus cells and examined the capacity of CRISPR and anti-CRISPR ring nucleases for its regulation. Quantification of cA4 generated by the SsoCsm complex in vitro revealed that ~ 1000 molecules of cA4 are made per RNA target, amounting to a concentration of 6 µM in the cell if replicated in vivo. This large degree of signal amplification would ensure that detection of 1 RNA target could generate sufficient amounts of cA4 to fully activate the ribonuclease effector protein Csx1, which has a dissociation constant for cA4 of 0.13 µM. Given the large signal amplification observed here, it seems likely that some means of cOA degradation, either via self-limiting ribonucleases (Athukoralage et al., 2019; Jia et al., 2019) or dedicated ring nucleases (Athukoralage et al., 2018), will be essential for type III CRISPR systems to provide immunity rather than elicit abortive infection. Indeed, growth arrest has been observed for cOA activated Csm6 during bacteriophage infection (Rostøl and Marraffini, 2019). This life or death decision in response to genotoxic stress has also been observed in S. islandicus, which becomes dormant upon viral infection and subsequently dies if virus remains in culture (Bautista et al., 2015). In recent years, diverse CRISPR systems have been implicated in abortive infection or cell dormancy. The Type I-F CRISPR system of Pectobacterium atrosepticum was found to provide population protection by aborting infection when infected by virulent phage (Watson et al., 2019). Likewise, the in-trans collateral RNA cleavage of Listeria seeligeri Cas13a resulted in cell dormancy, providing herd immunity to the bacterial population (Meeske et al., 2019). Similarly, in ecological contexts, it is possible that different multiplicities of viral infection illicit different outcomes from the type III CRISPR response that benefit either the individual cell or the population.
Cellular and viral ring nucleases reset the system in fundamentally different ways
Biochemical comparison of Crn1 and AcrIII-1 revealed that both enzymes bind cA4 with dissociation constants around 40 nM, around 3-fold tighter than observed for Csx1. However, Crn1 is a much slower enzyme. Kinetic modelling of the antiviral signalling pathway confirms that Crn1 is effective only at low levels of viral gene expression, where it has the potential to neutralise the toxicity associated with cA4-activated ribonucleases to offer a route for cell recovery without abrogating immunity. In contrast, the much faster reaction kinetics of the anti-CRISPR ring nuclease means it can rapidly deactivate Csx1 and immunosuppress cells even under very high RNA target (and thus cA4) levels.
Our modelling suggests that the rapid turnover of cA4 by AcrIII-1 over a wide concentration range greatly limits RNA cleavage by deactivating defence enzymes. Therefore, the deployment of AcrIII-1 upon viral infection may not only promote viral propagation but also safeguard cellular integrity until viral release by lysis. Recent studies have uncovered that sequentially infecting phage evade CRISPR defences by exploiting the immunosuppression achieved by Acr enzymes from failed infections (Borges et al., 2018; Landsberger et al., 2018). Further, these immunosuppressed cells have been shown to be susceptible to Acr-negative phage infections, highlighting the complex ecological consequences of supressing CRISPR immunity (Chevallereau et al., 2020). In Sulfolobus Turreted Icosahedral virus (STIV), the AcrIII-1 gene B116 is expressed early in the viral life cycle (Ortmann et al., 2008). Therefore, AcrIII-1 accumulation in the cell, possibly from early expression by unsuccessful viruses may, as our models demonstrate, favour the success of latter viral infections. Type III CRISPR systems also conditionally tolerate prophage (Goldberg et al., 2014), and unsurprisingly, AcrIII-1 is found in a number of prophages and integrative and conjugative elements. In these cases, constitutively expressed AcrIII-1 may further immunocompromise cells, and sensitise them to infection by phage otherwise eradicated by type III CRISPR defence. In the ongoing virus-host conflict, while increasing Csx1 concentration may allow better immunity when faced with AcrIII-1, upregulating AcrIII-1 expression in cells will undoubtedly offer viruses an avenue for counter offence.
It should be noted that the type III CRISPR locus of S. solfataricus contains a number of CARF domain proteins and their contribution to immunity has not yet been studied. In particular, the CARF-family putative transcription factor Csa3 appears to be involved in transcriptional regulation of CRISPR loci, including the adaptation and type I-A effector genes, when activated by cA4 (Liu et al., 2015; Liu et al., 2017). These observations suggest that the cA4 signal may transcend type III CRISPR defence in some cell types by activating multiple defence systems. However, by degrading the second messenger, AcrIII-1 has the potential to neutralise all of these.
Cyclic nucleotides in prokaryotic defence systems
Cyclic nucleotide-based defence systems are emerging as powerful cellular sentinels against parasitic elements in prokaryotes. Mirroring the role of cyclic GMP-AMP synthase (cGAS) in eukaryotic defence against viruses as part of the cGAS-STING pathway, bacterial cGAS enzymes have recently been discovered that abort infection by activating phospholipases through cGAMP signaling (Cohen et al., 2019). Termed the cyclic-oligonucleotide-based antiphage signaling system (CBASS), a large number of additional cOA sensing effector proteins associated with CBASS loci remain uncharacterised, highlighting great diversity in the cellular arsenal used for defence (Burroughs et al., 2015; Cohen et al., 2019). Furthermore, diverse nucleotide cyclases have been identified that generate a range of cyclic nucleotides including cUMP-AMP, c-di-UMP and cAAG, which are also likely to function in novel antiviral signal transduction pathways (Whiteley et al., 2019). Type III systems also generate cyclic tri-adenylate (cA3) and cyclic penta-adenylate (cA5) molecules. Whereas no signalling role has yet been ascribed to cA5, cA3 has been demonstrated to activate a family of DNases termed NucC which abort infection by degrading the host genome prior to completion of the phage replication cycle (Lau et al., 2020).
The balance between immunity, abortive infection and successful pathogen replication is likely to be governed by enzymes that synthesise and degrade these cyclic nucleotide second messengers. Just as prokaryotes with type III CRISPR require a means to degrade cOA in appropriate circumstances, eukaryotic cells have enzymes that degrade cGAMP to regulate cGAS-STING mediated immunity (Li et al., 2014). Likewise, while prokaryotic viruses utilise AcrIII-1 to rapidly degrade cA4, eukaryotic poxviruses utilise Poxins to subvert host immunity by destroying cGAMP (Eaglesham et al., 2019), and pathogenic Group B Streptococci degrade host c-di-AMP using the CndP enzyme to circumvent innate immunity (Andrade et al., 2016). The rate of discovery of new defence pathways and cyclic nucleotide signals is breath-taking. Analysis of the dynamic interplay between enzymes that leads to fluctuations in the levels of these second messengers is therefore of crucial importance if we are to achieve an understanding of these processes.
Materials and methods
Key resources table.
| Reagent type (species) or resource |
Designation | Source or reference | Identifiers | Additional information |
|---|---|---|---|---|
| Gene (Sulfolobus solfataricus) | Csm complex (eight subunits) | PMID:24119402 | virus expression construct | |
| Gene (Sulfolobus solfataricus) |
Csx1 | PMID:29963983 | UniProtKB - Q97YD5 | plasmid expression construct |
| Gene (Sulfolobus solfataricus) | Crn1 | PMID:30232454 | UniProtKB - Q7LYJ6 | plasmid expression construct |
| Gene (Sulfolobus islandicus rod-shaped virus 1) | AcrIII-1 | PMID:31942067 | UniProtKB - Q8QL27 | plasmid expression construct |
| Software, algorithm | KinTek Kinetic Explorer |
PMID:19897109 | model constructed for this paper |
Cyclic oligoadenylate (cOA) synthesis and visualisation
Cyclic tetra-adenylate (cA4) made per RNA target (0.01, 0.1, 1, 10, 25 or 50 nM) was investigated in a 20 μl reaction volume incubating A26 RNA target or A26 phosphorothioate RNA target (Table 1) with 13.5 μg Sulfolobus solfataricus (Sso)Csm complex (~470 nM carrying A26 CRISPR RNA) in Csx1 buffer containing 20 mM MES pH 5.5, 100 mM K-glutamate, 1 mM DTT and 3 units SUPERase•In Inhibitor supplemented with 1 mM ATP, 5 nM α-32P-ATP and 2 mM MgCl2 at 70°C for 2 hr. All samples were deproteinised by phenol-chloroform extraction (Ambion) followed by chloroform (Sigma-Aldrich) extraction prior to separating the cOA products by thin-layer chromatography (TLC). TLC was carried out as previously described (Rouillon et al., 2019). In brief, 1 μl of radiolabelled cOA product was spotted 1 cm from the bottom of a 20 × 20 cm silica gel TLC plate (Supelco Sigma-Aldrich). The TLC plate was placed in a sealed glass chamber pre-warmed at 37°C containing 0.5 cm of a running buffer composed of 30% H2O, 70% ethanol and 0.2 M ammonium bicarbonate, pH 9.2. After TLC the plate was air dried and sample migration visualised by phosphor imaging. For analysis, densiometric signals corresponding to cA4 was quantified as previously described (Rouillon et al., 2019).
Table 1. Oligonucleotides.
CRISPR RNA A26 is shown 3’ to 5’. Phosphorothioate linkages are indicated with an asterisk. Regions complementary to CRISPR RNA A26 are italicized.
| Crispr rna a26 | 3’-GCAACAATTCTTGCTGCAACAATCTTCAACCCATACCAGAAAGUUA |
| Name | Sequence (5’−3’) |
|---|---|
| Target RNA A26 | AGGGUCGUUGUUAAGAACGACGUUGUUAGAAGUUGGGUAUGGUGGAGA |
| Phosphorothioate target RNA A26 | AGGGUCGUUGUUAAGAACGACGUUGU*U*A*GAAGUUGGGU*A*U*GGUGGAGA |
| A1 substrate RNA | AGGGUAUUAUUUGUUUGUUUCUUCUAAACUAUAAGCUAGUUCUGGAGA |
Generation of α-32P-ATP standard curves
cA4 synthesis was visualised by incorporation of 5 nM α-32P-ATP added together with 0.5 mM ATP at the start of the reaction. Therefore, to calculate the concentration of ATP used for cA4 synthesis, α-32P-ATP standard curves were generated in duplicate, starting with 5 nM α-32P-ATP within a 20 μl volume to represent the densiometric signal corresponding to the complete conversion of 0.5 mM ATP into cOA. Serial two-fold dilutions of 5 nM α-32P-ATP and 0.5 mM ATP starting from a 20 μl volume were made and 1 μl of each dilution was spotted on a silica plate and phosphorimaged alongside TLC separating cOA made with varying RNA target concentrations. After phosphorimaging, the densiometric signals of the serial dilutions were quantified, averaged and plotted against ATP concentration starting from 0.5 mM and halving with each two-fold dilution. A line of best fit was then drawn. The concentration of ATP used to synthesise cA4 was calculated by entering the densiometric signal of the cA4 product into to equation of the line of best fit for the α-32P-ATP standard curve. The concentration of cA4 generated was derived by dividing the concentration of ATP incorporated by four to account for polymerisation of four ATP molecules to generate one molecule of cA4. Finally, the molecules of cA4 made per RNA was calculated by dividing the cA4 concentration generated by the concentration A26 RNA target used for cOA synthesis.
Calculation determining the concentration of cA4 made when one RNA target is detected within a S. solfataricus cell of ≈ 0.8 µm (0.6–1.0 µm) diameter.
As ~1000 molecules of cA4 is made per 1 molecule of RNA
Concentration (M) = moles / Volume (L)
Electrophoretic mobility shift assays to determine cA4 equilibrium binding constants
~20 nM radioactively-labelled cA4 generated using the SsoCsm was incubated with increasing concentrations of Csx1 (0.01, 0.05, 0.10, 0.20, 0.40, 0.60, 0.80, 1,0, 2.0, 4.0, 8.0, 10.0, 20.0 μM protein dimer) in buffer containing 20 mM Tris-HCl pH 7.5, 150 mM NaCl, 2 mM MgCl2 supplemented with 2 µM Ultrapure Bovine Serum Albumin (Invitrogen) for 10 min at 25°C. A reaction volume equivalent of 20% (v/v) glycerol was then added prior to loading the samples on a 15% polyacrylamide, 1 X TBE gel. Electrophoresis was carried out at 28°C and 250 V. Gels were phosphor imaged overnight at −80°C. For investigating RNA binding, 50 nM 5’-end radiolabelled and gel purified A1 RNA was incubated with Csx1 variant H345N (0.01, 0.10, 1.0, 5.0, 10.0, 20.0 μM protein dimer) in the presence or absence of 20 µM cA4 for 15 min at 40°C. To examine cA4 binding by Crn1,~10 nM radiolabelled SsoCsm cA4 was incubated with Sso2081 (0.01, 0.05, 0.10, 0.20, 0.40, 0.60, 0.80, 1,0, 2.0, 4.0, 8.0, 10.0, 20.0 μM protein dimer) on ice for 15 min before gel electrophoresis as described above but at 300V and at 4°C. cA4 binding by AcrIII-1 was examined by incubating ~10 nM radiolabelled SsoCsm cA4 with SIRV1 gp49 H47A (0.001, 0.01, 0.02, 0.03, 0.04, 0.05, 0.06, 0.08, 0.10, 1.0, 10.0, 20.0 µM protein dimer) for 10 min at 25°C before gel electrophoresis at 30°C as described above. For analysis densiometric signal corresponding to cA4 bound protein was quantified. The densiometric count corresponding to cA4 bound to 20 µM Csx1 dimer was used to represent 100% binding and densiometric counts from other lanes were normalised to this value within each replicate. Error of the 100% bound (20 µM Csx1 dimer) densiometric count was derived by calculating the area adjusted count for each replicate and then the standard deviation of their mean, reporting the standard deviation as a fraction of the mean set as 100% bound. The data were fitted to a quadratic equation with an adjust for nonspecific binding (Y = (ymax-ymin)*((x + [ligand] + Kd) - ((x+[ligand]+Kd)^2–4*x*[ligand])^0.5)/(2*[ligand]) +a*x+b) using GraphPad Prism 8.
Multiple turnover kinetics of RNA cleavage by Csx1
Multiple turnover kinetic experiments were carried out by incubating Csx1 (0.125 µM dimer) with radiolabelled (50 nM) and unlabelled RNA A1 to a final concentration of 1.25, 1.5, 2.0, 5.0, 10.0, or 20.0 μM RNA in Csx1 buffer at 70°C. Control reactions with no protein and with protein and RNA in the absence of cA4 were included. 10 μl reaction aliquots were quenched by adding to phenol-chloroform and vortexing and the different time-points at which reactions were quenched for each RNA concentration is indicated in data transparency. Deproteinised products were run on a 7 M urea, 20% acrylamide, 1 X TBE gel at 45°C as previously described (Rouillon et al., 2019), and phosphorimaged overnight at −80°C. Each experiment was carried out in triplicate. Fraction of RNA cut was plotted against time and a linear regression was carried out on the linear portion of each plot to determine the initial rate of RNA cleavage at each RNA concentration. To determine the parameters kcat and KM, the average initial rate of RNA cleavage was plotted against RNA concentration and fitted to the Michaelis-Menten equation using GraphPad Prism 8.
Modelling antiviral signalling and its control by ring nucleases
Modelling was carried out using the KinTek Explorer eight software package (Johnson, 2009), which is available from (https://kintekcorp.com/software). Experiments were modelled and simulated using kinetic and equilibrium paramters detemined experimentally as described in Figure 6A. The following steps were inserted to generate the model:
target_Csm_ATP = target_Csm + cA4 (irreversible)
cA4 + Csx1 = cA4_Csx1
cA4_Csx1 + RNA = cA4_Csx1_RNA
cA4_Csx1_RNA = cA4_Csx1_cleavedRNA (irreversible)
cA4_Csx1_cleavedRNA = cA4_Csx1 + cleavedRNA
cA4 + Crn1 = cA4_Crn1
cA4_Crn1 = A2 + Crn1 (irreversible)
cA4 + Vrn = cA4_Vrn cA4_Vrn = A2 + Vrn (irreversible)
Simulations were carried out varying target_Csm_ATP concentration (6, 60 and 600 µM) while Csx1, Crn1 (Sso2081) and AcrIII-1 concentrations were fixed at 1 µM dimer, or varied depending on the simulation, with total substrate RNA in the cell fixed at 1000 µM.
Acknowledgements
This work was supported by a grant from the Biotechnology and Biological Sciences Research Council (Grant REF BB/S000313/1 to MFW) and the Wellcome Trust (Grant 210486/Z/18/Z to CMC)
Funding Statement
The funders had no role in study design, data collection and interpretation, or the decision to submit the work for publication.
Contributor Information
Malcolm F White, Email: mfw2@st-and.ac.uk.
Blake Wiedenheft, Montana State University, United States.
Gisela Storz, National Institute of Child Health and Human Development, United States.
Funding Information
This paper was supported by the following grants:
Biotechnology and Biological Sciences Research Council BB/S000313/1 to Malcolm F White.
Wellcome 210486/Z/18/Z to Clarissa M Czekster.
Additional information
Competing interests
No competing interests declared.
Author contributions
Formal analysis, Investigation, Visualization, Methodology, Writing - original draft, Writing - review and editing.
Methodology, Writing - review and editing.
Methodology, Writing - review and editing.
Methodology, Writing - review and editing.
Visualization, Methodology, Writing - review and editing.
Conceptualization, Formal analysis, Supervision, Funding acquisition, Writing - original draft, Project administration, Writing - review and editing.
Additional files
Data availability
All data generated or analysed during this study are included in the manuscript and supporting files. Source data files have been provided for Figures 2, 3, 4 and 6.
References
- Andrade WA, Firon A, Schmidt T, Hornung V, Fitzgerald KA, Kurt-Jones EA, Trieu-Cuot P, Golenbock DT, Kaminski PA. Group B Streptococcus degrades Cyclic-di-AMP to modulate STING-Dependent type I interferon production. Cell Host & Microbe. 2016;20:49–59. doi: 10.1016/j.chom.2016.06.003. [DOI] [PMC free article] [PubMed] [Google Scholar]
- Athukoralage JS, Rouillon C, Graham S, Grüschow S, White MF. Ring nucleases deactivate type III CRISPR ribonucleases by degrading cyclic oligoadenylate. Nature. 2018;562:277–280. doi: 10.1038/s41586-018-0557-5. [DOI] [PMC free article] [PubMed] [Google Scholar]
- Athukoralage JS, Graham S, Grüschow S, Rouillon C, White MF. A type III CRISPR ancillary ribonuclease degrades its cyclic oligoadenylate activator. Journal of Molecular Biology. 2019;431:2894–2899. doi: 10.1016/j.jmb.2019.04.041. [DOI] [PMC free article] [PubMed] [Google Scholar]
- Athukoralage JS, McMahon SA, Zhang C, Grüschow S, Graham S, Krupovic M, Whitaker RJ, Gloster TM, White MF. An anti-CRISPR viral ring nuclease subverts type III CRISPR immunity. Nature. 2020;577:572–575. doi: 10.1038/s41586-019-1909-5. [DOI] [PMC free article] [PubMed] [Google Scholar]
- Bautista MA, Zhang C, Whitaker RJ. Virus-induced dormancy in the archaeon Sulfolobus islandicus. mBio. 2015;6:e02565. doi: 10.1128/mBio.02565-14. [DOI] [PMC free article] [PubMed] [Google Scholar]
- Borges AL, Zhang JY, Rollins MF, Osuna BA, Wiedenheft B, Bondy-Denomy J. Bacteriophage cooperation suppresses CRISPR-Cas3 and Cas9 immunity. Cell. 2018;174:917–925. doi: 10.1016/j.cell.2018.06.013. [DOI] [PMC free article] [PubMed] [Google Scholar]
- Burroughs AM, Zhang D, Schäffer DE, Iyer LM, Aravind L. Comparative genomic analyses reveal a vast, novel network of nucleotide-centric systems in biological conflicts, immunity and signaling. Nucleic Acids Research. 2015;43:10633–10654. doi: 10.1093/nar/gkv1267. [DOI] [PMC free article] [PubMed] [Google Scholar]
- Chevallereau A, Meaden S, Fradet O, Landsberger M, Maestri A, Biswas A, Gandon S, van Houte S, Westra ER. Exploitation of the cooperative behaviors of Anti-CRISPR phages. Cell Host & Microbe. 2020;27:189–198. doi: 10.1016/j.chom.2019.12.004. [DOI] [PMC free article] [PubMed] [Google Scholar]
- Cohen D, Melamed S, Millman A, Shulman G, Oppenheimer-Shaanan Y, Kacen A, Doron S, Amitai G, Sorek R. Cyclic GMP-AMP signalling protects Bacteria against viral infection. Nature. 2019;574:691–695. doi: 10.1038/s41586-019-1605-5. [DOI] [PubMed] [Google Scholar]
- Eaglesham JB, Pan Y, Kupper TS, Kranzusch PJ. Viral and metazoan poxins are cGAMP-specific nucleases that restrict cGAS-STING signalling. Nature. 2019;566:259–263. doi: 10.1038/s41586-019-0928-6. [DOI] [PMC free article] [PubMed] [Google Scholar]
- Elmore JR, Sheppard NF, Ramia N, Deighan T, Li H, Terns RM, Terns MP. Bipartite recognition of target RNAs activates DNA cleavage by the type III-B CRISPR-Cas system. Genes & Development. 2016;30:447–459. doi: 10.1101/gad.272153.115. [DOI] [PMC free article] [PubMed] [Google Scholar]
- Estrella MA, Kuo FT, Bailey S. RNA-activated DNA cleavage by the type III-B CRISPR-Cas effector complex. Genes & Development. 2016;30:460–470. doi: 10.1101/gad.273722.115. [DOI] [PMC free article] [PubMed] [Google Scholar]
- Foster K, Kalter J, Woodside W, Terns RM, Terns MP. The ribonuclease activity of Csm6 is required for anti-plasmid immunity by type III-A CRISPR-Cas systems. RNA Biology. 2019;16:449–460. doi: 10.1080/15476286.2018.1493334. [DOI] [PMC free article] [PubMed] [Google Scholar]
- Goldberg GW, Jiang W, Bikard D, Marraffini LA. Conditional tolerance of temperate phages via transcription-dependent CRISPR-Cas targeting. Nature. 2014;514:633–637. doi: 10.1038/nature13637. [DOI] [PMC free article] [PubMed] [Google Scholar]
- Grüschow S, Athukoralage JS, Graham S, Hoogeboom T, White MF. Cyclic oligoadenylate signalling mediates Mycobacterium tuberculosis CRISPR defence. Nucleic Acids Research. 2019;47:9259–9270. doi: 10.1093/nar/gkz676. [DOI] [PMC free article] [PubMed] [Google Scholar]
- Hatoum-Aslan A, Maniv I, Samai P, Marraffini LA. Genetic characterization of antiplasmid immunity through a type III-A CRISPR-Cas system. Journal of Bacteriology. 2014;196:310–317. doi: 10.1128/JB.01130-13. [DOI] [PMC free article] [PubMed] [Google Scholar]
- Jia N, Jones R, Yang G, Ouerfelli O, Patel DJ. CRISPR-Cas III-A Csm6 CARF domain is a ring nuclease triggering stepwise cA4 cleavage with ApA>p formation terminating RNase activity. Molecular Cell. 2019;75:933–943. doi: 10.1016/j.molcel.2019.06.014. [DOI] [PMC free article] [PubMed] [Google Scholar]
- Jiang W, Samai P, Marraffini LA. Degradation of phage transcripts by CRISPR-Associated RNases enables type III CRISPR-Cas immunity. Cell. 2016;164:710–721. doi: 10.1016/j.cell.2015.12.053. [DOI] [PMC free article] [PubMed] [Google Scholar]
- Johnson KA. Fitting enzyme kinetic data with KinTek global kinetic explorer. Methods in Enzymology. 2009;467:601–626. doi: 10.1016/S0076-6879(09)67023-3. [DOI] [PubMed] [Google Scholar]
- Johnson K, Learn BA, Estrella MA, Bailey S. Target sequence requirements of a type III-B CRISPR-Cas immune system. Journal of Biological Chemistry. 2019;294:10290–10299. doi: 10.1074/jbc.RA119.008728. [DOI] [PMC free article] [PubMed] [Google Scholar]
- Kazlauskiene M, Tamulaitis G, Kostiuk G, Venclovas Č, Siksnys V. Spatiotemporal control of type III-A CRISPR-Cas immunity: coupling DNA degradation with the target RNA recognition. Molecular Cell. 2016;62:295–306. doi: 10.1016/j.molcel.2016.03.024. [DOI] [PubMed] [Google Scholar]
- Kazlauskiene M, Kostiuk G, Venclovas Č, Tamulaitis G, Siksnys V. A cyclic oligonucleotide signaling pathway in type III CRISPR-Cas systems. Science. 2017;357:605–609. doi: 10.1126/science.aao0100. [DOI] [PubMed] [Google Scholar]
- Kubitschek HE, Friske JA. Determination of bacterial cell volume with the Coulter counter. Journal of Bacteriology. 1986;168:1466–1467. doi: 10.1128/JB.168.3.1466-1467.1986. [DOI] [PMC free article] [PubMed] [Google Scholar]
- Landsberger M, Gandon S, Meaden S, Rollie C, Chevallereau A, Chabas H, Buckling A, Westra ER, van Houte S. Anti-CRISPR phages cooperate to overcome CRISPR-Cas immunity. Cell. 2018;174:908–916. doi: 10.1016/j.cell.2018.05.058. [DOI] [PMC free article] [PubMed] [Google Scholar]
- Lau RK, Ye Q, Birkholz EA, Berg KR, Patel L, Mathews IT, Watrous JD, Ego K, Whiteley AT, Lowey B, Mekalanos JJ, Kranzusch PJ, Jain M, Pogliano J, Corbett KD. Structure and mechanism of a cyclic Trinucleotide-Activated bacterial endonuclease mediating bacteriophage immunity. Molecular Cell. 2020;77:723–733. doi: 10.1016/j.molcel.2019.12.010. [DOI] [PMC free article] [PubMed] [Google Scholar]
- Li L, Yin Q, Kuss P, Maliga Z, Millán JL, Wu H, Mitchison TJ. Hydrolysis of 2'3'-cGAMP by ENPP1 and design of nonhydrolyzable analogs. Nature Chemical Biology. 2014;10:1043–1048. doi: 10.1038/nchembio.1661. [DOI] [PMC free article] [PubMed] [Google Scholar]
- Liu T, Li Y, Wang X, Ye Q, Li H, Liang Y, She Q, Peng N. Transcriptional regulator-mediated activation of adaptation genes triggers CRISPR de novo spacer acquisition. Nucleic Acids Research. 2015;43:1044–1055. doi: 10.1093/nar/gku1383. [DOI] [PMC free article] [PubMed] [Google Scholar]
- Liu T, Liu Z, Ye Q, Pan S, Wang X, Li Y, Peng W, Liang Y, She Q, Peng N. Coupling transcriptional activation of CRISPR-Cas system and DNA repair genes by Csa3a in Sulfolobus islandicus. Nucleic Acids Research. 2017;45:8978–8992. doi: 10.1093/nar/gkx612. [DOI] [PMC free article] [PubMed] [Google Scholar]
- Makarova KS, Wolf YI, Iranzo J, Shmakov SA, Alkhnbashi OS, Brouns SJJ, Charpentier E, Cheng D, Haft DH, Horvath P, Moineau S, Mojica FJM, Scott D, Shah SA, Siksnys V, Terns MP, Venclovas Č, White MF, Yakunin AF, Yan W, Zhang F, Garrett RA, Backofen R, van der Oost J, Barrangou R, Koonin EV. Evolutionary classification of CRISPR-Cas systems: a burst of class 2 and derived variants. Nature Reviews Microbiology. 2020;18:67–83. doi: 10.1038/s41579-019-0299-x. [DOI] [PMC free article] [PubMed] [Google Scholar]
- McMahon SA, Zhu W, Graham S, Rambo R, White MF, Gloster TM. Structure and mechanism of a type III CRISPR defence DNA nuclease activated by cyclic oligoadenylate. Nature Communications. 2020;11:500. doi: 10.1038/s41467-019-14222-x. [DOI] [PMC free article] [PubMed] [Google Scholar]
- Meeske AJ, Nakandakari-Higa S, Marraffini LA. Cas13-induced cellular dormancy prevents the rise of CRISPR-resistant bacteriophage. Nature. 2019;570:241–245. doi: 10.1038/s41586-019-1257-5. [DOI] [PMC free article] [PubMed] [Google Scholar]
- Nasef M, Muffly MC, Beckman AB, Rowe SJ, Walker FC, Hatoum-Aslan A, Dunkle JA. Regulation of cyclic oligoadenylate synthesis by the Staphylococcus epidermidis Cas10-Csm complex. RNA. 2019;25:948–962. doi: 10.1261/rna.070417.119. [DOI] [PMC free article] [PubMed] [Google Scholar]
- Niewoehner O, Garcia-Doval C, Rostøl JT, Berk C, Schwede F, Bigler L, Hall J, Marraffini LA, Jinek M. Type III CRISPR-Cas systems produce cyclic oligoadenylate second messengers. Nature. 2017;548:543–548. doi: 10.1038/nature23467. [DOI] [PubMed] [Google Scholar]
- Ortmann AC, Brumfield SK, Walther J, McInnerney K, Brouns SJ, van de Werken HJ, Bothner B, Douglas T, van de Oost J, Young MJ. Transcriptome analysis of infection of the archaeon Sulfolobus solfataricus with Sulfolobus turreted icosahedral virus. Journal of Virology. 2008;82:4874–4883. doi: 10.1128/JVI.02583-07. [DOI] [PMC free article] [PubMed] [Google Scholar]
- Rostøl JT, Marraffini LA. Non-specific degradation of transcripts promotes plasmid clearance during type III-A CRISPR-Cas immunity. Nature Microbiology. 2019;4:656–662. doi: 10.1038/s41564-018-0353-x. [DOI] [PMC free article] [PubMed] [Google Scholar]
- Rouillon C, Athukoralage JS, Graham S, Grüschow S, White MF. Control of cyclic oligoadenylate synthesis in a type III CRISPR system. eLife. 2018;7:e36734. doi: 10.7554/eLife.36734. [DOI] [PMC free article] [PubMed] [Google Scholar]
- Rouillon C, Athukoralage JS, Graham S, Grüschow S, White MF. Investigation of the cyclic oligoadenylate signaling pathway of type III CRISPR systems. Methods in Enzymology. 2019;616:191–218. doi: 10.1016/bs.mie.2018.10.020. [DOI] [PubMed] [Google Scholar]
- Samai P, Pyenson N, Jiang W, Goldberg GW, Hatoum-Aslan A, Marraffini LA. Co-transcriptional DNA and RNA cleavage during type III CRISPR-Cas immunity. Cell. 2015;161:1164–1174. doi: 10.1016/j.cell.2015.04.027. [DOI] [PMC free article] [PubMed] [Google Scholar]
- Sorek R, Lawrence CM, Wiedenheft B. CRISPR-mediated adaptive immune systems in Bacteria and archaea. Annual Review of Biochemistry. 2013;82:237–266. doi: 10.1146/annurev-biochem-072911-172315. [DOI] [PubMed] [Google Scholar]
- Tamulaitis G, Kazlauskiene M, Manakova E, Venclovas Č, Nwokeoji AO, Dickman MJ, Horvath P, Siksnys V. Programmable RNA shredding by the type III-A CRISPR-Cas system of Streptococcus thermophilus. Molecular Cell. 2014;56:506–517. doi: 10.1016/j.molcel.2014.09.027. [DOI] [PubMed] [Google Scholar]
- Tamulaitis G, Venclovas Č, Siksnys V. Type III CRISPR-Cas immunity: major differences brushed aside. Trends in Microbiology. 2017;25:49–61. doi: 10.1016/j.tim.2016.09.012. [DOI] [PubMed] [Google Scholar]
- Watson BNJ, Vercoe RB, Salmond GPC, Westra ER, Staals RHJ, Fineran PC. Type I-F CRISPR-Cas resistance against virulent phages results in abortive infection and provides population-level immunity. Nature Communications. 2019;10:5526. doi: 10.1038/s41467-019-13445-2. [DOI] [PMC free article] [PubMed] [Google Scholar]
- Whiteley AT, Eaglesham JB, de Oliveira Mann CC, Morehouse BR, Lowey B, Nieminen EA, Danilchanka O, King DS, Lee ASY, Mekalanos JJ, Kranzusch PJ. Bacterial cGAS-like enzymes synthesize diverse nucleotide signals. Nature. 2019;567:194–199. doi: 10.1038/s41586-019-0953-5. [DOI] [PMC free article] [PubMed] [Google Scholar]
- Wurtzel O, Sapra R, Chen F, Zhu Y, Simmons BA, Sorek R. A single-base resolution map of an archaeal transcriptome. Genome Research. 2010;20:133–141. doi: 10.1101/gr.100396.109. [DOI] [PMC free article] [PubMed] [Google Scholar]
- Zhu Y, Klompe SE, Vlot M, van der Oost J, Staals RHJ. Shooting the messenger: rna-targetting CRISPR-Cas systems. Bioscience Reports. 2018;38:BSR20170788. doi: 10.1042/BSR20170788. [DOI] [PMC free article] [PubMed] [Google Scholar]


