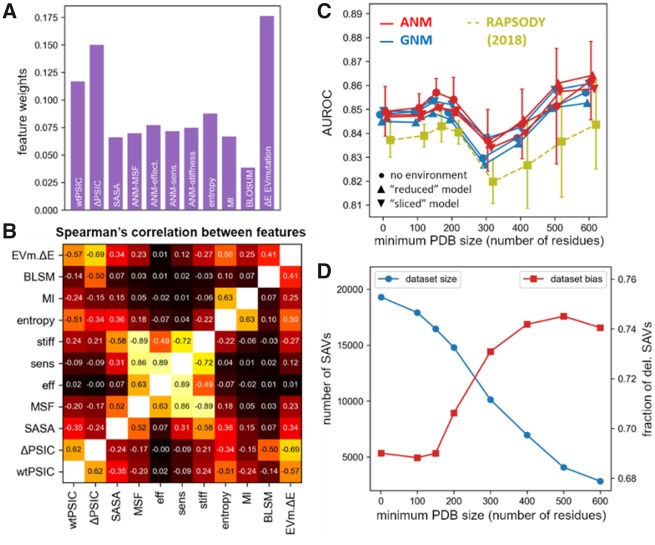
Fig. 2.
Analysis of the Rhapsody classifier. (A) Weights of features in the Rhapsody classifier integrated with EVmutation. See also Supplementary Figure S4. (B) Spearman’s correlations between all pairs of features. (C) Accuracy of the full Rhapsody algorithm (repeated using either GNM- or ANM-predicted DYN features, with and without environmental effects) on different subsets of the OPTIDS obtained by setting a minimum PDB structure size (i.e. number N of resolved residues). In yellow, we show the performance of the original algorithm (Ponzoni and Bahar, 2018). Error bars represent the SD computed during cross-validations. See also Supplementary Figure S5 for similar results with other accuracy metrics. (D) Training dataset size (SAVs successfully processed by ‘full’ classifier, in blue) and fraction of positive training examples (i.e. deleterious SAVs, in red) as a function of the minimum number of residues used to filter PDB structures based on their size

