
Fig. 2.
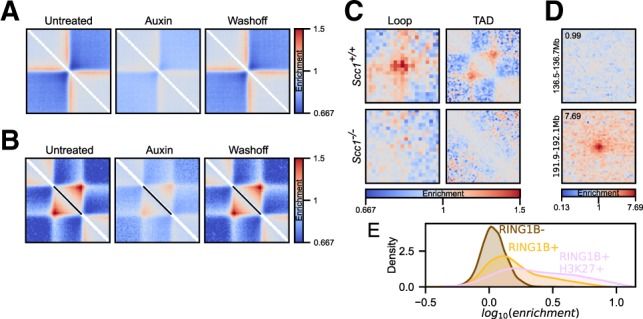
Pile-up variations. (A) Local pile-ups of high-insulating regions in ES cells across untreated, auxin-treated and wash-off conditions in CTCF-AID Hi-C data (Nora et al., 2017). Twenty-five kbp resolution data with 1000 kbp padding around the central pixel. (B) Local rescaled pile-ups of TADs (defined based on high-insulating regions) across same data as in (A) from 5 kbp resolution data. (C) Loop and rescaled TAD pile-ups for pooled single-cell Hi-C data showing loss of structures in Scc1−/− zygotes (Gassler et al., 2017). (D) Two examples of anchored pile-ups from RING1B+/H3K27me3+ CpG islands on chr1, with no visible enrichment (top), or with very prominent enrichment (bottom). The anchored region is on the left side of the pile-up, and its coordinates (including the padding) are shown on the left. The value of the central pixel (‘loopability’) shown in top left corner. (E) Distribution of ‘loopability’ values of CpG islands not bound by RING1B, CpG islands bound by RING1B, and CpG islands bound by RING1B and also marked by H3K27me3