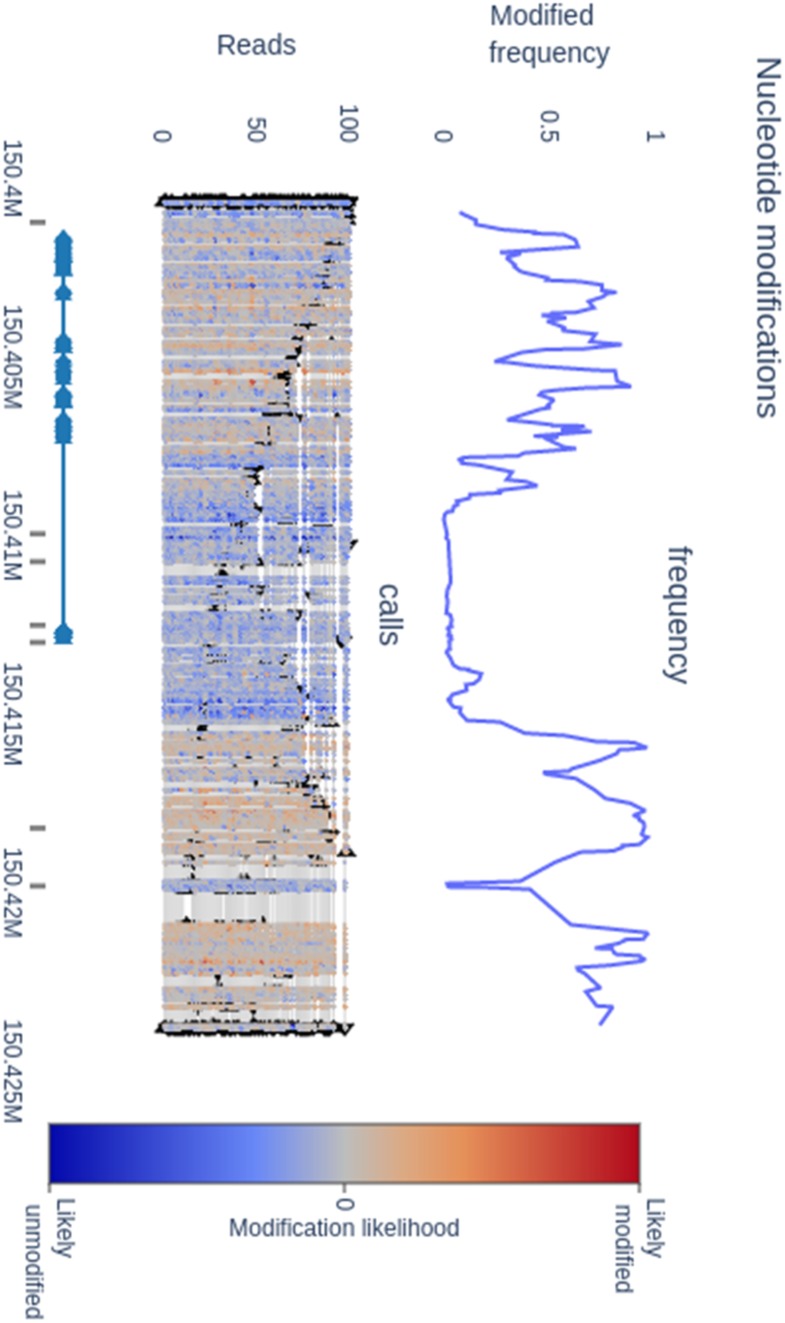
Fig. 1.
CpG methylation around the highly expressed CD74 gene. The top panel shows per position the frequency of methylated nucleotides, the middle panel shows per read per position the likelihood of a modified nucleotide with a color gradient and the bottom panel contains gene structure annotation and DNase hypersensitive regions. Regulatory regions show lower frequency of methylation

