

Abstract
At present, the overall genetic and epigenetic effects of Krüppel‐like factors (KLFs) on prostate cancer (PCa) remain unclear. Therefore, we systematically investigated the molecular differences in KLFs of transcription expression, promoter methylation and genetic alteration. Univariate and multivariate Cox proportional hazard regression was used to analyse the effect on RFS and establish the prognostic signature in the TCGA cohort, MSKCC and GSE116918 cohorts employed to validate the signature. Biological pathway enrichment and the potential response to immunotherapy and chemotherapy were inferred. The transcription levels of most KLFs are associated with the clinical outcome of PCa. Gleason score (P = .009), pathology T stage (P = .006), KLF3 (P = .034), KLF5 (P = .002) and KLF7 (P = .035) were independent prognostic factors. A prognostic signature was established in the TCGA cohort (P < .001) and validated in the MSKCC (P < .001) and GSE116918 cohorts (P = .006). Demethylation of KLF5 by 5‐azacytidine led to increased protein levels, whereas knockdown of KLF5 promoted cell proliferation. Patients in KLF‐F were more likely to respond to immunotherapy (P < .001) and bicalutamide (P < .001). In summary, we found that the KLFs and clinical feature‐based signatures may improve prognosis prediction in PCa and further promote patient stratification and disease management.
Keywords: chemotherapy, genetic alteration, immunotherapy, Krüppel‐like factor, promoter methylation, prostate cancer, recurrent‐free survival, transcription expression
1. INTRODUCTION
Prostate cancer (PCa) is a common malignant carcinoma among males worldwide, and accounts for the second greatest prevalence and a fifth of cancer‐specific deaths. More than 300 000 deaths are caused by PCa annually, accounting for approximately 6.6% of cancer‐specific mortality in males. 1 , 2 , 3 Additionally, PCa is the second most frequent cancer (13%) in the oldest‐old males, of whom older than 85 years old, and is the primary cause of mortality in the United States (20%). 4 In China, the incidence of PCa has risen sharply from 10% to 20% over the last two decades due to the widespread use of prostate biopsies for diagnosis. 5 , 6 , 7 The overall survival rate for patients with PCa is not poor compared with that of other malignancies, with more than 80% survival during the first five years after diagnosis. 8 , 9 , 10 However, the recurrence rate of PCa is high, and most patients will enter the advanced castration‐resistant PCa (CRPC) stage, which increases the risk of PCa‐specific death. 11 , 12 , 13 , 14
Krüppel‐like factors (KLFs) are zinc finger proteins that bind to the DNA transcriptional region and act as transcriptional activators or repressors. Numerous biological processes are affected by KLFs, such as cell proliferation and differentiation as well as the development of mammalian tissues and organs by maintaining the homeostasis of both tissues and systemics. 15 , 16 There are 18 KLF family members, and each consists of three common conserved Cys2/His2 zinc fingers. KLF family members bind to similar promoter regions in the C‐terminal domains of genes, such as CACCC‐, GC or GT‐box. 17 The features of KLFs are both exclusive and overlapping. For example, KLF2, KLF4 and KLF6 are involved in the activation of macrophages, and KLF4 induces the M2 phenotype macrophage through IL‐4, while KLF2 can inhibit NF‐κB‐dependent proinflammatory activation and promote M2 polarization. 18 , 19 In contrast, KLF6 promotes the polarization of M1‐type macrophages through the inhibition of the NF‐κB pathway. 20 , 21 Moreover, KLF2, KLF4 and KLF5 have been linked to the pluripotency of stem cells. 22
In past decades, KLFs have been found to play pivotal roles in tumorigenesis. Kim et al found that KLF12 promotes tumour growth by directly activating EGFR and serves as a prognostic marker in colorectal cancer. 23 Tsompana et al 24 found that KLF4 targeted super‐enhancers and sustained the oncogenic state in head and neck squamous cell carcinoma. Jia et al found that the oncogenic role of KLF5‐regulated RP1 was accomplished through the suppression of p27kip1. However, the overall genetic and epigenetic effects of KLFs on PCa have not been investigated, until now. Therefore, in this study, we evaluated the prognostic values of KLF family members from different levels, including transcriptional expression, genetic alteration, DNA methylation and the likelihood of responding to immunotherapy or chemotherapy. The flow chart for the current study is depicted in Figure 1.
Figure 1.
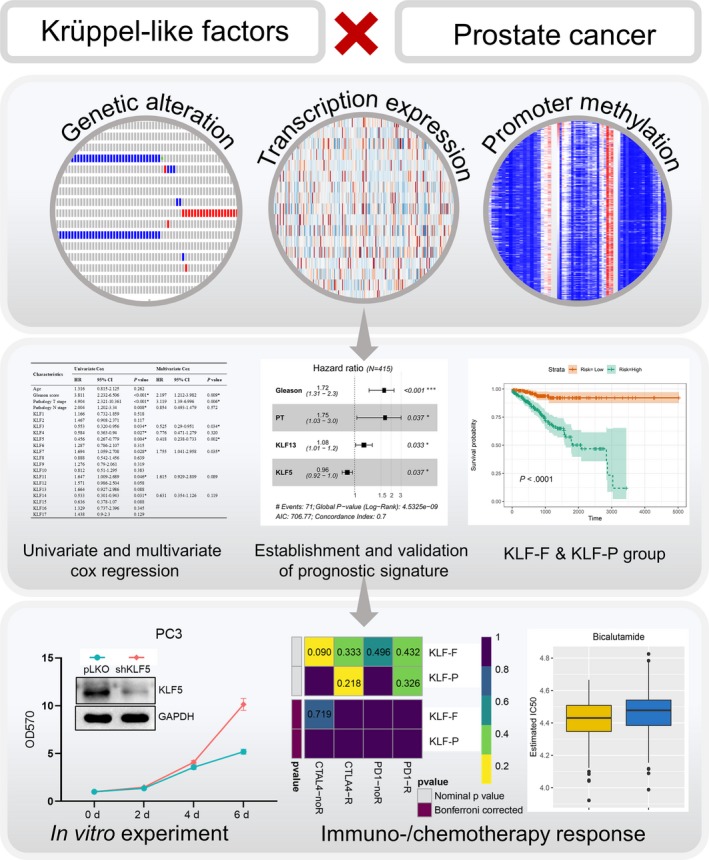
Flow chart illustrating the current study
2. MATERIALS AND METHODS
2.1. Study population
We obtained the molecular data of PCa patients from The Cancer Genome Atlas Project (TCGA). The transcriptional expression data were acquired from the public data hub UCSC Xena (https://xenabrowser.net/), and consisted of 499 PCa samples and 52 normal samples. The transcriptomic profiles of the KLFs were extracted from the whole gene transcription data under the archive of the PRAD project. The MSKCC and GSE116918 cohorts were also enrolled as validation cohorts to evaluate the prognostic value of KLFs plus clinical feature signatures. The clinicopathological information for the enrolled cohorts is summarized in Table S1.
2.2. DNA methylation of KLFs
The β value ranges from 0 (unmethylated) to 1 (fully methylated), which indicates that the overall methylation level of the promoter region of KLFs was retrieved from MethHC (http://methhc.mbc.nctu.edu.tw/php/index.php). 25 The correlation between the promoter methylation β value and KLFs expression level was evaluated via linear regression using GraphPad Prism 8.
2.3. Genetic alterations in KLFs
The genetic alterations of KLFs in patients with PCa were illustrated via the cBioPortal platform (http://www.cbioportal.org/), 26 , 27 which recorded the missense and truncating mutations as well as amplification and deep deletion. The RFS between patients with or without alterations was also conducted to evaluate the prognostic value of genetic alterations in KLFs. The expression of KLFs with gene amplification was depicted by GraphPad Prism 8.
2.4. Cell culture and reagents
The PC3, 22RV1, and HEK293T cell lines were purchased from the American Type Culture Collection (ATCC, Manassas, VA). HEK293T cells were cultured in DMEM medium, while PC3 and 22RV1 cells were cultured in RPMI 1640 medium. To prepare the media, 10% foetal bovine serum and 1% penicillin and streptomycin solution were added before use. The cell incubators were maintained at 37°C and 5% CO2. Bicalutamide (Sigma, #90357‐06‐5, ≥98%) was used at 10 μM for the treatment of 22RV1 cells.
2.5. Knockdown KLF5 plasmid design, lentivirus packaging and cell transfection
The primers used to generate the knockdown sequence of KLF5 were as follows: shKLF5‐forward: CCGGCCTATAATTCCAGAGCATAAAGGATCCTTTATGCTCTGGAATTATAGGTTTTTG, shKLF5‐reverse: AATTCAAAAACCTATAATTCCAGAGCATAAAGGATCCTTTATGCTCTGGAATTATAGG. After annealing and amplification, the newly generated ~60 bp sequence was inserted into the pLKP.1 plasmid to obtain the pLKO.1‐shKLF5 plasmid.
To obtain the knockdown KLF5 and control lentivirus, the psPAX2 packaging plasmid and pMD2.G envelope plasmid were cotransfected with the pLKO.1‐shKLF5 or plKO.1 plasmid into HEK293T cells. After 48 hours of incubation, the medium with excreted lentivirus was collected and stored at −80°C for infecting PCa cells.
2.6. MTT assay for cell growth and bicalutamide sensitivity
MTT assays were employed to evaluate cell proliferation. Pre‐prepared pLKO or shKLF5 PCa cells were digested and resuspended in medium, then seeded in 24‐well plates with 5000 cells in each well. The results were collected after 0, 2, 4 and 6 days. To evaluate bicalutamide sensitivity, 10 000 cells were seeded in several 24‐well plates and treated with or without 10 μM bicalutamide in pLKO or shKLF5 groups for four days. After collecting the results, 50 μL of MTT reagent (Amresco Inc, Solon) was added to the medium and incubated at 37°C for 2 hours. Afterwards, the medium was removed and 200 μL of dissolving reagent DMSO (Amresco Inc) was added to dissolve the formazan crystals. The optical density value was determined at a wavelength of 570 nm on a microplate reader.
2.7. Colony formation assay
pLKO and shKLF5 PCa cells (PC3 and 22RV1) were seeded in six‐well plates containing 800 cells per well and allowed to grow for an additional 12 days. Then, the culture solution was discarded, and the cells were rinsed twice with cold PBS. They were then fixed using 4% paraformaldehyde for 20 min and subsequently stained with 0.5% crystal violet staining solution for 20 min. The colonies were photographed and counted under a microscope.
2.8. Western blot
Cells were washed twice with cold PBS and lysed in RIPA lysis buffer, and proteins (40‐50 μg) were separated on 6%‐10% SDS/PAGE gels then transferred onto PVDF membranes (Millipore). After PVDF membranes were blocked, they were sequentially incubated with primary antibodies, HRP‐conjugated secondary antibodies, and visualized using an ECL system (Thermo Fisher Scientific). The primary antibodies used in the Western blot study included KLF5 (ABclonal, #A12403), E‐cadherin (ABclonal, #A11492), vimentin (ABclonal, #A2666) and GAPDH (Santa Cruz, #sc‐166574). The following day, anti‐rabbit, antimouse or anti‐goat IgG secondary antibody was used for 1 hour at a concentration of 1:5000 at 16°C and rinsed for 5 minutes with TBST three times.
2.9. Identification of risk‐associated differentially expressed genes (DEGs) and genome enrichment
The R package ‘edgeR’ was utilized to perform differential expression analysis with the standard comparison mode. DEGs were identified as genes that passed the threshold of P < .05 and absolute log2 fold‐change >0.5. The expression levels of the top DEGs for each patient were displayed with a heatmap, and GEPIA (http://gepia.cancer-pku.cn) was used to investigate their association with patient RFS. 28 The DEGs were enrolled to generate the gene ontology (GO) and Kyoto Encyclopedia of Genes and Genomes (KEGGs) enrichment analysis using Metascape (http://metascape.org) 29 with a threshold of false discovery rate <0.05. GSEA was used to identify pathways enriched in high‐ and low‐risk patient groups.
2.10. Immune infiltration, immunotherapy and chemotherapy response prediction
The infiltration of 22 subtypes of tumour‐infiltrating immune cells (TIICs) was retrieved from our previous study, which was calculated by CIBERSORT, an algorithm that quantifies the proportion of TIICs with 547 signature genes. 30 , 31 To evaluate the individual likelihood of responding to immunotherapy (eg immune checkpoint blockade), the Tumour Immune Dysfunction and Exclusion (TIDE) algorithm was employed. 32 , 33 , 34 As immune checkpoint inhibitors have not yet been approved as routine drugs for PCa, subclass analysis was performed in response to anti‐CTAL‐4 or anti‐PD‐1 therapy based on the treatment results of 47 patients with melanomas who underwent immunotherapy. 35
We also evaluated the chemotherapy response of each patient using the public pharmacogenomics database Genomics of Drug Sensitivity in Cancer (GDSC; https://www.cancerrxgene.org). Chemotherapy drugs cisplatin, docetaxel and bicalutamide that are normally used to treat patients with PCa were selected for evaluation. Based on the GDSC data, the half‐maximal inhibitory concentration (IC50) was estimated and represented the response of the drug. Therefore, the R package ‘pRRophetic’ was used with 10‐fold cross‐validation and other parameters by default. 36
2.11. Statistics
To obtain the normalized expression data of KLFs, we converted the raw count data to the number of fragments per kilobase of non‐overlapped exon per million fragments mapped (FPKM). Survival analysis was performed using the R package ‘survival’. A Kaplan‐Meier (K‐M) curve was generated for survival rates of patients with different detections of the log‐rank test. The best cut‐off values were selected to divide the different survival groups, which were determined by algorithms embedded in the R package. The final prognostic K‐M plots are presented with a hazard ratio (HR), 95% confidence interval (CI) and log‐rank P value.
Univariate and multivariate Cox hazard proportional regression analyses of KLF members and clinical features were performed in RFS with a HR and 95% CI. The KLFs and clinical features based on the RFS predicting signature were constructed using the co‐efficient value derived from the Cox hazard proportional regression model. The risk score (ie signature) of each patient with PCa was calculated using a linear combination of mRNA expression of KLFs and clinical features, weighted by the corresponding coefficients and divided into favourable (KLF‐F) and poor (KFL‐P) RFS groups by the mean value of the signature. K‐M plots present the different RFS in the two groups, and the receiver operating characteristic (ROC) curve was plotted to illustrate the predictive performance of the signature. For all statistical analyses, P < .05 was considered statistically significant.
3. RESULTS
3.1. KLF expression and related RFS in patients with PCa
We obtained and calculated the mRNA expression of 17 KLFs from the TCGA‐PRAD database, which contains 52 normal prostate tissues and 499 PCa tissues, while the mRNA level of KLF18 was not detectable and, thus, excluded from this study. As shown in Figure 2A, the mRNA expressions of the KLFs were polarized; most KLF levels decreased in PCa tissue compared with in normal tissue, including KLF3, KLF4, KLF5, KLF6, KLF7, KLF8, KLF9, KLF10, KLF11, KLF12, KLF13 and KLF17 (P < .05). In contrast, KLF1, KLF15 and KLF16 levels increased in tumour tissue (P < .05) and no significant difference was observed between the normal and tumour tissues with either KLF2 or KLF14 (Table S2). Furthermore, we evaluated the prognostic value of each KLF and found that the high expression of KLF7 (P = .035, Figure S1D), KLF11 (P = .024, Figure S1E) and KLF17 (P = .020, Figure S1H) indicated a poor prognosis with RFS, while the lower expression of KLF3 (P = .015, Figure S1A), KLF4 (P = .007, Figure S1B), KLF5 (P = .002, Figure S1C), KLF14 (P = .023, Figure 2F) and KLF15 (P = .033, Figure S1G) was associated with a favourable RFS. Prognostic analyses of other KLFs were also conducted using the K‐M curve, as shown in Figure S2.
Figure 2.
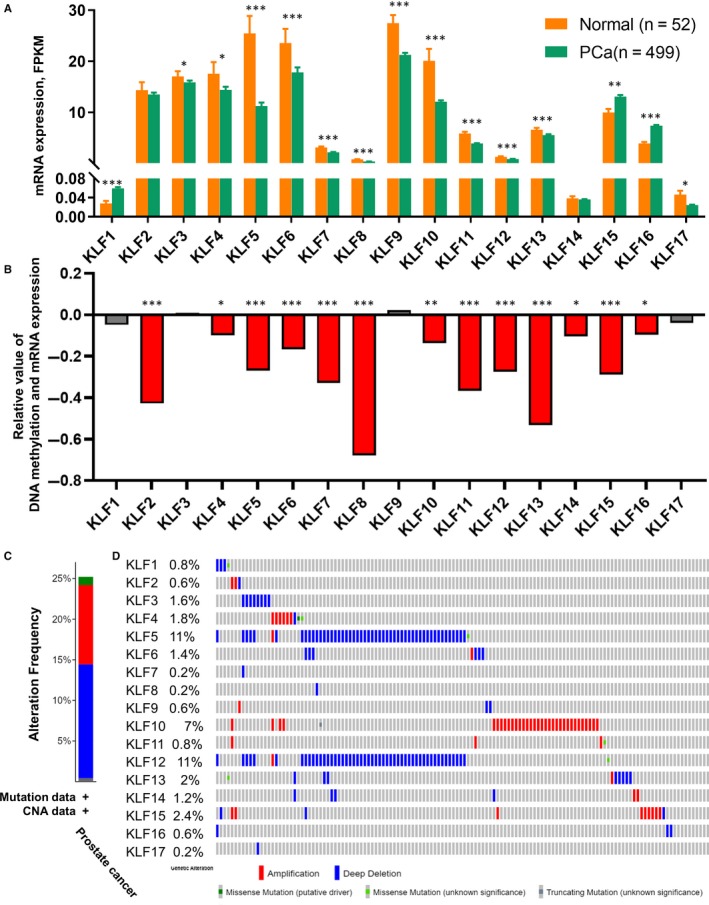
Transcriptional expression, DNA promoter methylation and genetic alteration of KLFs. A, The mRNA expression (FPKM) of KLFs between normal and PCa groups; B, the correlation between promoter methylation and mRNA expression of KLFs, R value indicates the linear relationship between DNA methylation and mRNA expression; C, the proportion of different types of genetic alteration to overall KLFs; D, the frequency and distribution of genetic alteration to each KLF; *P < .05, **P < .01, ***P < .001
3.2. KLF promoter methylation and genetic alteration
mRNA expression is affected by promoter methylation in cells; thus, we evaluated the promoter methylation levels of KLFs. We found that increased promoter methylation in the tumour tissues of KLF3, KLF6, KLF7, KLF8, KLF10, KLF11, KLF12 and KLF13 resulted in decreased mRNA expression as compared with normal tissues (P < .05; Table S3). We also evaluated the association between DNA methylation and mRNA expression of KLFs in PCa tumour tissues and found that the mRNA expression of most KLFs was negatively associated with its DNA methylation at the promoter region (P < .05), except for KLF3, KLF9 and KLF17 (Figure 2B).
Genetic alteration is another critical factor that affects the mRNA expression of genomic genes. Appropriately, 15% deep deletion occurred among TCGA‐PRAD patients to all KLFs, while amplification accounted for approximately 10%, and the genetic mutation fraction was less than 5% (Figure 2C). What is more, we identified a profound deep deletion rate in KLF5 (11%) and KLF12 (11%), while KLF10 had the highest amplification rate among all KLFs (7%; Figure 2D). Furthermore, this study revealed that the deletion of KLF5 (heterozygous deletion vs. homozygous deletion: P = .0103; Diploid vs. homozygous deletion: P = .0085; Diploid vs. heterozygous deletion: P = .0001; Figure S3A) and KLF12 (heterozygous deletion vs. homozygous deletion: P = .0377; Figure S3B) affected their mRNA levels. As the mRNA levels of KLFs are associated with a poor prognosis, genetic alteration and DNA methylation might be involved.
3.3. Univariate and multivariate analyses of KLFs and prognostic value
To evaluate the effect of KLFs and clinical features on the prognosis of PCa and to identify the positively associated factors, we conducted univariate and multivariate Cox regression analyses; the results are summarized in Table 1. In the univariate cox regression, we found that the Gleason score (HR = 1.977, 95% CI: 1.537‐2.541, P < .001), pathology T stage (HR = 2.597, 95% CI: 1.641‐4.109, P < .001), N stage (HR = 2.005, 95% CI: 1.203‐3.341, P = .008), KLF5 (HR = 0.957, 95% CI: 0.921‐0.995, P = .027) and KLF13 (HR = 1.089, 95% CI: 1.016‐1.167, P = .016) are associated with the RFS of patients with PCa. Due to low expression levels, we excluded KLF1, KLF14 and KLF17 when conducting univariate Cox regression analysis. Subsequently, we adopted multivariate Cox proportional hazard regression analysis based on the nine positive factors, and demonstrated that the Gleason score (HR = 1.723, 95% CI: 1.301‐2.282, P < .001), pathological T stage (HR = 1.754, 95% CI: 1.03‐2.985, P = .038), KLF5 (HR = 0.96, 95% CI: 0.925‐0.998, P = .038) and KLF13 (HR = 1.08, 95% CI: 1.006‐1.159, P = .033) are independent prognostic factors of PCa (Table 1).
Table 1.
The univariate and multivariate analysis of RFS to KLFs and clinical‐pathological data from TCGA‐PRAD cohort
| Characteristics | Univariate Cox | Multivariate Cox | ||||
|---|---|---|---|---|---|---|
| HR | 95% CI | P value | HR | 95% CI | P value | |
| Age | 1.316 | 0.815‐2.126 | .261 | |||
| Gleason score | 1.977 | 1.537‐2.541 | <.001* | 1.723 | 1.301‐2.282 | <.001* |
| Pathological T stage | 2.597 | 1.641‐4.109 | <.001* | 1.754 | 1.03‐2.985 | .038* |
| Pathological N stage | 2.005 | 1.203‐3.341 | .008* | 0.983 | 0.567‐1.707 | .952 |
| KLF2 | 1.013 | 0.992‐1.034 | .226 | |||
| KLF3 | 0.975 | 0.937‐1.015 | .217 | |||
| KLF4 | 0.973 | 0.944‐1.002 | .065 | |||
| KLF5 | 0.957 | 0.921‐0.995 | .027* | 0.96 | 0.925‐0.998 | .038* |
| KLF6 | 0.987 | 0.968‐1.007 | .206 | |||
| KLF7 | 1.144 | 0.903‐1.45 | .265 | |||
| KLF8 | 1.277 | 0.44‐3.707 | .653 | |||
| KLF9 | 1.003 | 0.977‐1.029 | .846 | |||
| KLF10 | 0.986 | 0.961‐1.012 | .296 | |||
| KLF11 | 1.12 | 0.978‐1.282 | .103 | |||
| KLF12 | 1.098 | 0.668‐1.806 | .712 | |||
| KLF13 | 1.089 | 1.016‐1.167 | .016* | 1.08 | 1.006‐1.159 | .033* |
| KLF15 | 0.988 | 0.951‐1.026 | .522 | |||
| KLF16 | 1.012 | 0.942‐1.088 | .737 | |||
P < .05.
3.4. Establishment and validation of KLF‐related prognostic signature
To further explore whether and how KLFs impact the process and prognosis of PCa, we calculated the risk score for each patient based on the following formula: risk score = 0.542*Gleason score + 0.559*pathology T stage −0.040*KLF5 + 0.077*KLF13 (Figure 3A, Table S4; see Section 2). In this formula, the Gleason score was divided into five groups with different scores. The pathological T stage included four groups: T1, T2, T3 and T4. With the risk score, patients were divided into KLF‐F (low‐risk, n = 208) and KLF‐P (high‐risk, n = 207) groups. The recurrence rate was high at 26.09% in the KLF‐P group, while only 8.17% of patients met the recurrence rate in the KLF‐F group (Figure 3B). We also evaluated the expression of KLF5 and KLF13 and identified the decreased expression of KLF5 in the KLF‐P group, along with an increased level of KLF13 (Figure 3C). Subsequently, the K‐M plot was employed to test the discrimination value of the risk score, as shown in Figure 3D. RFS was significantly different between the KLF‐P and KLF‐F groups (P < .001), and the ROC curve also demonstrated a favourable value of the risk score for predicting recurrence in the TCGA‐PRAD cohort (1‐year AUC = 0.735; 3‐year AUC = 0.696; 5‐year AUC = 0.785, Figure 3G).
Figure 3.
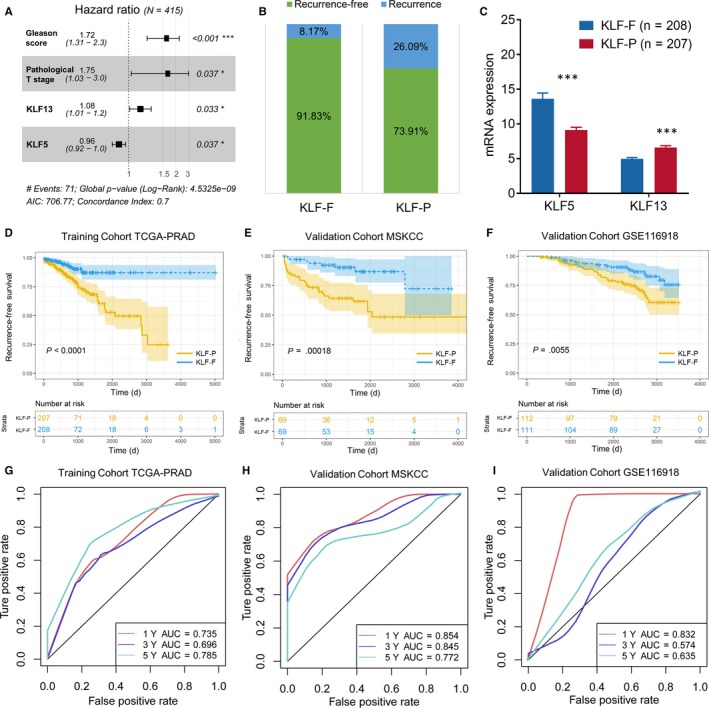
Establishment and validation of the prognostic signature of KLFs. (A) The hazard ratio of each independent risk factor to RFS; (B) the different distribution of biochemical recurrence in KLF‐F and KLF‐P groups; (C) mRNA expression of KLF5 and KLF13 between KLF‐F and KLF‐P groups, ***P < .001; K‐M plot to depict the different RFS in the TCGA‐PRAD training cohort (D), external validation MSKCC cohort (E) and GSE116918 cohort (F). The ROC curve and AUC value to assess the predictive value of the risk signature in the TCGA‐PRAD training cohort (G), external validation MSKCC cohort (H) and GSE116918 cohort (I)
To appraise the availability and stability of the KLF‐related prognostic signature, we used the same formula mentioned above to generate the risk score of each patient in the MSKCC and GSE116918 cohorts. The K‐M plot based on the MSKCC cohort showed poor RFS in the KLF‐P group (P = .00018, Figure 3E), and the AUC value illustrated a good quality of distinguishability in 1 year (AUC = 0.854), 3 years (AUC = 0.845) and 5 years (AUC = 0.772, Figure 3H). Results from the GSE116918 cohort also indicated a good application of the prognostic signature with a dramatic RFS difference between KLF‐F and KLF‐P groups (P = .0055, Figure 3F) as well as a high AUC value (1‐year AUC = 0.832; 3‐year AUC = 0.574; 5‐year AUC = 0.635, Figure 3I).
3.5. KLF5 expression affected by 5‐azacytidine and knockdown of KLF5 promoted cell proliferation of PCa
We first detected the baseline KLF5 protein levels in several PCa cell lines and found that KLF5 is highly expressed in PC3 and 22RV1 cells and is lower in C4‐2 and C4‐2B cells (Figure 4A). Therefore, we selected PC3 and 22RV1 cell lines for the next validation. Based on the analysis between KLF expression and DNA methylation, we found that KLF5 is negatively associated with the methylation of its upstream promoter region (Figure 2B). Therefore, we detected the protein level of KLF5 after treatment with 5‐azacytidine, a commonly used inhibitor of DNA methylation. 37 As shown in Figure 4B, after treatment with 5‐azacytidine, the protein levels of KLF5 increased in PC3 and 22RV1 cell lines. Subsequently, we used the shKLF5 lentivirus to knockdown KLF5 and found that cell proliferation significantly increased after knockdown of KLF5 in PC3 and 22RV1 cells (Figure 4C,D), and the same tendency was also observed in the colony formation assay (Figure 4E,F).
Figure 4.
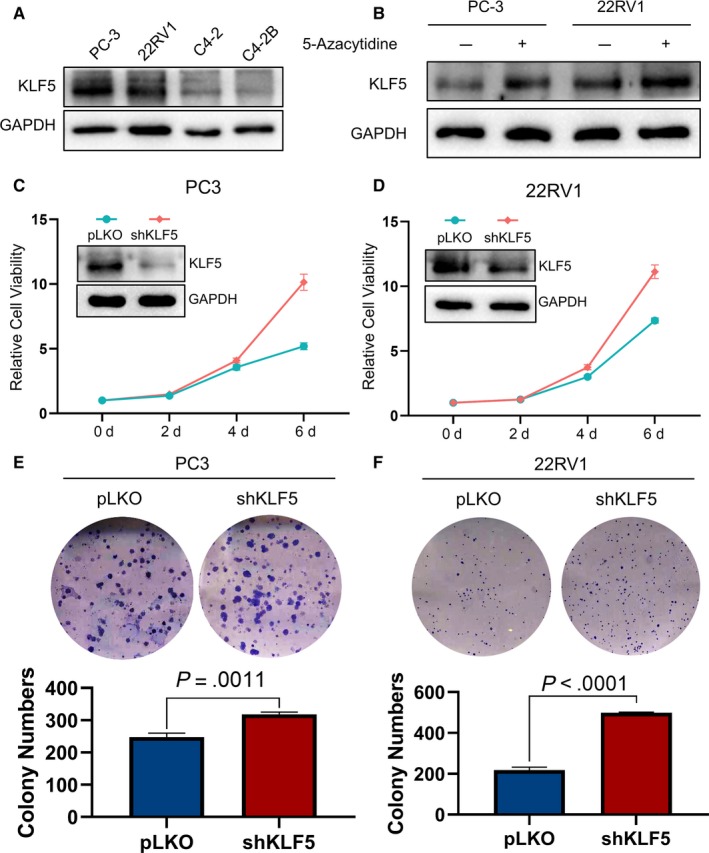
Knockdown of KLF5 promotes the cell proliferation of PCa. (A) Baseline protein levels of KLF5 in four PCa cell lines; (B) 5‐azacytidine inhibited DNA methylation and promoted the expression of KLF5 in PC‐3 and 22RV1 cells; KLF5 promotes cell proliferation in PC‐3 (C) and 22RV1 (D) cells, as assessed by MTT assay. Knockdown of KLF5 promotes cell proliferation in PC‐3 (E) and 22RV1 (F) cells, as assessed by the colony formation assay
3.6. Identification of DEGs between KFL‐F and KLF‐P groups and pathway enrichment
The DEGs in the KFL‐F and KLF‐P groups were obtained using ‘edgeR’ R packages with log2 fold‐change >0.5 or <−0.5 and P value <0.05. The red dot represents the highly expressed gene in KLF‐P, while the blue dot represents the highly expressed gene in KLF‐F (Figure 5A). The top 10 highly expressed genes in the KFL‐F and KLF‐P groups are shown in Figure 5B. The highly expressed ARHGDIG in the KLF‐P group leads to a poor prognosis of PCa (P = .00028, Figure 5C), and the expression of ARHGDIG in tumours is negatively associated with the KLF5 levels (R = −0.34, P < .001, Figure 5F), confirming the prognostic value of KLF5 in PCa. Meanwhile, the high levels of the KLF‐F group highly expressed LCN2 and CD38 linked to a better RFS (P < .05, Figure 5D,E), and both were positively correlated with increased levels of KLF5 (LCN2: R = 0.56, P < .001; CD38: R = 0.21, P < .001, Figure 5G,H).
Figure 5.
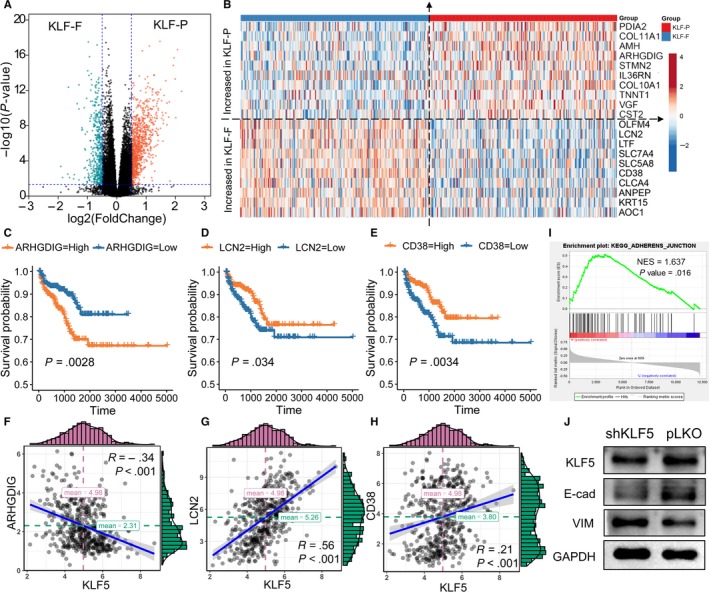
Potential biological pathways affected by KLFs. (A) The DEGs between the KLF‐F and KLF‐P groups; (B) top 10 increased and decreased genes among the KLF‐F and KLF‐P groups. Highly expressed ARHGDIG from the KLF‐P group predicted a poor prognosis (C) and its expression was negatively associated with KLF5 (F). Highly expressed LCN2 and CD38 from the KLF‐F group was linked with a favourable prognosis (D,E) and their expressions were positively associated with KLF5 (G,H). (I) The GSEA results showed that KEGG_ADHERENS_JUNCTION is activated in the KLF‐P group; (J) the EMT pathway is activated after knockdown of KLF5
To obtain an in‐depth understanding of the association between and the prognosis of PCa, we performed functional enrichment analyses among the DEGs. We first used GSEA to analyse the different pathways enrolled in the KLF‐F and KLF‐P groups, and the results showed that the KEGG _ADEHERENS_JUNCTION pathway was highly activated in the KLF‐P group (NES = 1.637, P = .016, Figure 5I). The epithelial‐mesenchymal transition pathway is the pivotal pathway in the cell adherens junction; therefore, we evaluated the alteration of the EMT pathway and found that after the knockdown of KLF5 (simulating KLF‐P status), the protein levels of E‐cadherin decreased, while vimentin increased considerably. These WB results showed that the EMT pathway was activated after the knockdown of KLF5 (Figure 5J). We also used Metascape to generate the overall function of the different genes in the KLF‐F and KLF‐P groups in GO biological processes, reactome gene sets, KEGG pathways and canonical pathways. Figure S4A displays the pathway enrichment of highly expressed genes in KLF‐P. Enrichment is primarily related to nuclear division (red and green dots) and the cell cycle of mitotic cells (blue dot). For KLF‐F‐related enrichment, the NABA matrisome‐associated pathway (red dot) was mostly enriched, which affects the extracellular matrix. We found that the chemotaxis, tissue morphogenesis and second‐messenger‐mediated signalling pathways were also annotated in the KLF‐F‐associated gene group (Figure S4B).
3.7. Different immune infiltration between KFL‐F and KLF‐P groups
The infiltration of TIICs in tumours plays a key role in the tumour environment and affects prognosis. In the present study, we found that KLKs distinguished patients with PCa with poor a prognosis (KLF‐P) or favourable prognosis (KLF‐F); thus, we further investigated the different TIIC infiltrations in tumours with different prognoses. We found that the distributions of plasma cells (P = .020) and resting mast cells (P = .024) were higher in KLF‐F, while M2 macrophage (P < .001) infiltration was higher in the KLF‐P than the KFL‐F group (Figure 6A, Table S5). Then, we evaluated the association between KLF5 expression and the above three immune cell infiltrations and found that plasma cells and M2 macrophages were negatively associated with KLF5 expression (Figure 6B). In our previous study, we revealed that the high infiltration of M2 macrophages is linked with the poor prognosis of patients with PCa, and this study revealed that KLF5 is the key gene against the progression of PCa in databases and in vitro. Therefore, we analysed the combined effect of KLF5 and M2 macrophages and found that patients with low KLF5 and high M2 macrophage infiltration had the worst prognosis (HR = 4.67, P < .001, Figure 6C).
Figure 6.
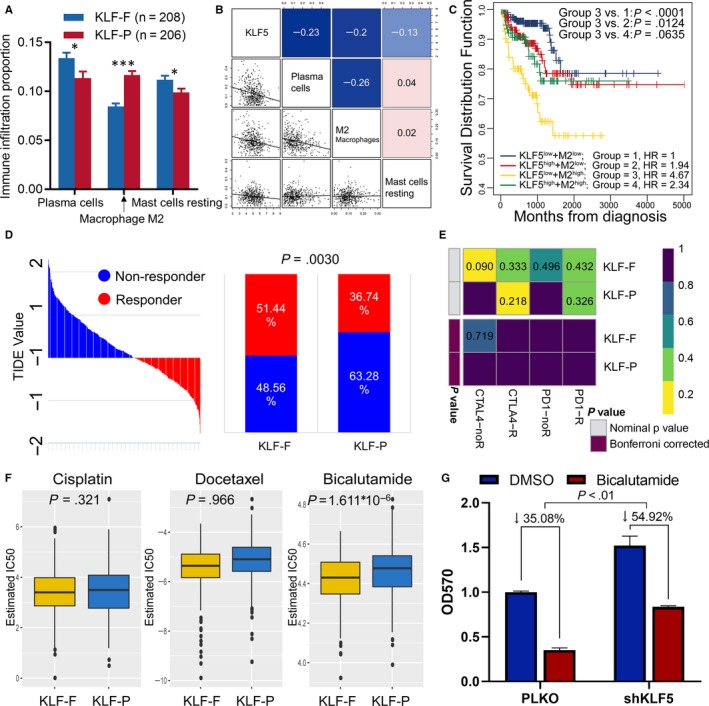
Immune infiltration and immunotherapy and chemotherapy among KLF‐F and KLF‐P subgroups. A, Immune infiltration proportion of TIICs between normal and PCa groups, *P < .05, ***P < .001; B, the correlation between KLF5 and the infiltration of plasma cells, M2 macrophages, and resting mast cells; C, K‐M plot showing the different RFS outcomes in KLF5 and M2 macrophage‐determined subgroups; D, the TIDE value and response results to immunotherapy of patients with PCa; E, Submap analysis showed no difference in response to CTAL‐4 and anti‐PD‐1 therapy; F, estimated IC50 indicates the efficiency of chemotherapy to KLF‐F and KLF‐P groups by cisplatin, docetaxel and bicalutamide; G, knockdown of KLF5 increased bicalutamide resistance to 22RV1 cells
3.8. Immunotherapy and chemotherapy are more practical for KLF‐F patients
We further assessed the potential response to immunotherapy in each patient using the TIDE algorithm (Table S6), and observed that patients in the KLF‐F group (51.92%, 108/208) were more likely to respond to immunotherapy than those in the KLF‐P group (36.23%, 75/207; P = .0015; Figure 6D). Subsequently, we analysed the response of anti‐CTLA‐4 and anti‐PD‐1 therapy; however, we could not conclude the different responses between the KLF‐F and KLF‐P groups regarding both immunotherapies (Figure 6E).
Chemotherapy is another method of treating advanced PCa in a clinical setting. Therefore, we focused on the different responses to chemotherapy of KLF‐associated KFL‐F and KLF‐P groups. The cell line data obtained from the GDSC database were employed to train the predictive model based on the satisfied predictive accuracy evaluated by 10‐fold cross‐validation. The IC50 values for cisplatin, docetaxel and bicalutamide of each patient with PCa were estimated by the predictive model. Finally, we recognized a dramatic difference in the estimated IC50 among KLF‐determined risk groups, of which the KLF‐F group showed a better response to bicalutamide (P < .001; Figure 6F) treatments.
4. DISCUSSION
PCa is a considerable worldwide burden on public health. The symptoms of urination discomfort, bone metastasis pain and castration treatment failure, and the high rates of recurrence make it an urgent public health event. 38 , 39 To identify the prognoses of patients with PCa, several studies have focused on establishing a prognostic signature. Zhao et al 40 focused on the immune landscape and revealed that macrophages and T cells conferred the worse RFS, and suggested that PD‐L2 might be a potential therapeutic target for patients with PCa. Shao et al 41 revealed a seven‐lncRNA signature to predict the RFS in PCa, which showed an AUC of 0.718 to three‐year RFS after adjustment for other major clinical features. Alshalalfa et al 42 reported a 212 gene‐based SCGScore to identify the phenotype of neuroendocrine prostate carcinoma, which always produced an unfavourable prognosis.
KLF family members are a series of DNA transcriptional regions that bind zinc finger proteins and promote or suppress the transcriptional levels of downstream genes. KLFs are widely reported in the initial stages of tumorigenesis. Wang et al 43 reported that KLF2 directly regulated the expression of PTEN in gastric cancer and served as a downstream target of miR‐32‐5p, and that the decrease in KLF2 could promote gastric cancer development. Mao et al 44 also illustrated the poor survival impact of KLF8 in gastric cancer, which regulated glycolysis by affecting GLUT4. Sun et al 45 found that a low level of KLF3 is associated with the poor prognosis of lung cancer, and KLF3 could alter the epithelial‐mesenchymal transition by controlling STAT3, ultimately affecting metastasis. Hu et al 46 investigated the effect of KLF13 in glioma, and found that the antibiotic clofoctol could suppress the proliferation of glioma stem cells by activating the expression of KLF13. Regarding PCa, Luo et al 47 reported that KLF14 could regulate the antioxidant response and subsequent pathogenesis of CRPC through an HO‐1 adaptive mechanism. Shen et al 48 and Wang et al 49 reported that KLF9 and KLF13 could both suppress the growth of PCa by inhibiting the activation of AKT signalling. He et al 50 obtained an optative view that KLF8 was overexpressed in PCa and promoted the proliferation of PCa cells by co‐activating the androgen receptor.
In the present study, we depicted a landscape of the prognostic value of KLFs from multiple aspects, including transcription, methylation, genetic alteration, potential signalling pathways and specific therapeutic methods. To leverage the complementary molecular and clinical characteristics, we integrated the molecular characteristics and clinical factors to build a composite prognostic signature consisting of KLF5, KLF13, Gleason score and pathology T stage from the TCGA cohort, and validated it in the MSKCC and GSE116918 cohorts. DNA methylation plays an important role in tumorigenesis. Yang et al 51 reported that complex SUV39H1/CRL4B/HP1/DNMT3A promoted DNA methylation‐based epigenetic silencing, while Spyropoulou et al 52 also showed that histone lysine N‐methyltransferases, especially SUV39H1, led to malignancy in gliomas and is a potential biomarker. In this study, the in vitro experiment confirmed the tumour suppression function of KLF5 in PC‐3 and 22RV1 cell lines, and the DNA methylation inhibitor demethylated and caused re‐expression of KLF5. Furthermore, we evaluated the different signalling pathways in KLF‐F and KLF‐P patients. GSEV analysis was employed and revealed that the KEGG_ADHERENS_JUNCTION pathway was activated in the KLF‐P group, and we validated the new funding in 22RV1 cells and the EMT pathway was significantly activated after the knockdown of KLF5.
Immunotherapy and chemotherapy are now widely used to treat different tumours. Recently, personalized treatment of cancer has been a focus of clinicians and scientists. For example, in a phase III trial of nivolumab for advanced non‐small cell lung cancer, patients with a high tumour mutation burden (TMB) had significantly improved PFS in the nivolumab group compared with the chemotherapy group, which means that patients with high TMB may benefit more from the treatment of nivolumab. 53 Kijima et al 54 also reported that patients with colorectal cancer who have a low expression of miR‐6826 may have a better response after vaccination, as well as miR‐6875. In the current study, we found that the critical KLFs along with clinical features divided patients into KLF‐F and KLF‐P, thus, we also appraised the distinctive response to immunotherapy and chemotherapy. Finally, we determined that KLF‐F patients had a better response to bicalutamide based on the results of database analysis and in vitro experiments, while immunotherapy showed no difference in KLF‐F and KLF‐P subgroups.
There are some advantages that should not be neglect in the current study. We established and validated a novel KLF‐associated prognostic signature to help predict outcomes among almost 776 patients with PCa. Therefore, clinicians could use the signature to predict underlying recurrence and carry out effective treatment. In addition, the molecular function of KLF5 was confirmed in PCa cell lines, which could affect the proliferation and treatment sensitivity of bicalutamide through the EMT pathway. Meanwhile, some limitations should also be addressed and modified in future studies. First, more clinical samples should be used to confirm the effectiveness of the KLF‐associated prognostic signature. Second, although we found that the KLF‐F patients could benefit more from immunotherapy, there is no difference between KLF‐F and KLF‐P patients in CAR‐T and PD‐1/PD‐L1 therapy; thus, the potential novel immunotherapy should be investigated in future. Third, the potential mechanism by which KLF5 promotes cell proliferation and affects bicalutamide sensitivity should be studied.
In summary, KLF family members are essential prognostic factors for PCa. The KLFs and clinical feature‐based signatures identified the unfavourable prognosis precisely, while Bicalutamide is an effective medicine to treat KLF‐F patients.
CONFLICT OF INTEREST
The authors declare that they have no conflict of interest.
AUTHORS' CONTRIBUTIONS
Jialin Meng, Xiaofan Lu and Shenglin Gao conceived and designed the research; Yujie Zhou and Meng Zhang performed the date record and collection; Jialin Meng, Lei Gao and Yujie Zhou conducted the data analysis and visualization; Fangrong Yan, Chaozhao Liang and Shenglin Gao wrote and review the manuscript. All authors read and approved the final manuscript.
Supporting information
Supplementary materials
ACKNOWLEDGEMENTS
This manuscript was supported by National Natural Science Foundation of China (81630019, 81870519), the National Science Foundation for Young Scientists (81802827), the Natural Science Foundation of Guangdong Province, China (2017A030313800), Team of Leading Talents in Education Department of Anhui Province, Academic and Technological Leader in Anhui Province. The results in this study are in whole or part based upon data generated by the TCGA Research Network: https://www.cancer.gov/tcga.
Meng J, Lu X, Zhou Y, et al. Characterization of the prognostic values and response to immunotherapy/chemotherapy of Krüppel‐like factors in prostate cancer. J Cell Mol Med. 2020;24:5797–5810. 10.1111/jcmm.15242
Meng, Lu and Zhou contributed equally to this work.
Contributor Information
Shenglin Gao, Email: gsl_cmu@163.com.
Fangrong Yan, Email: f.r.yan@163.com.
Chaozhao Liang, Email: liang_chaozhao@ahmu.edu.cn.
DATA AVAILABILITY STATEMENT
The data sets used and/or analysed during the current study are available from the corresponding author on reasonable request.
REFERENCES
- 1. Ferlay J, Soerjomataram I, Dikshit R, et al. Cancer incidence and mortality worldwide: sources, methods and major patterns in GLOBOCAN 2012. Int J Cancer. 2015;136:E359‐E386. [DOI] [PubMed] [Google Scholar]
- 2. Center MM, Jemal A, Lortet‐Tieulent J, et al. International variation in prostate cancer incidence and mortality rates. Eur Urol. 2012;61:1079‐1092. [DOI] [PubMed] [Google Scholar]
- 3. Bray F, Ferlay J, Soerjomataram I, Siegel RL, Torre LA, Jemal A. Global cancer statistics 2018: GLOBOCAN estimates of incidence and mortality worldwide for 36 cancers in 185 countries. CA Cancer J Clin. 2018;68:394‐424. [DOI] [PubMed] [Google Scholar]
- 4. DeSantis CE, Miller KD, Dale W, et al. Cancer statistics for adults aged 85 years and older, 2019. CA Cancer J Clin. 2019;69:452‐467. [DOI] [PubMed] [Google Scholar]
- 5. Qi D, Wu C, Liu F, et al. Trends of prostate cancer incidence and mortality in Shanghai, China from 1973 to 2009. Prostate. 2015;75:1662‐1668. [DOI] [PubMed] [Google Scholar]
- 6. Wong MC, Goggins WB, Wang HH, et al. Global incidence and mortality for prostate cancer: analysis of temporal patterns and trends in 36 countries. Eur Urol. 2016;70:862‐874. [DOI] [PubMed] [Google Scholar]
- 7. Bray FCM, Mery L, Piñeros M, Znaor A, Zanetti R, Ferlay J, editors. Cancer Incidence in Five Continents, Vol. XI (ELECTRONIC Version). Lyon: IARC Scientific Publications; 2017. [Google Scholar]
- 8. De Angelis R, Sant M, Coleman MP, et al. Cancer survival in Europe 1999–2007 by country and age: results of EUROCARE–5‐a population‐based study. Lancet Oncol. 2014;15:23‐34. [DOI] [PubMed] [Google Scholar]
- 9. Johansson JE, Adami HO, Andersson SO, Bergstrom R, Holmberg L, Krusemo UB. High 10‐year survival rate in patients with early, untreated prostatic cancer. JAMA. 1992;267:2191‐2196. [PubMed] [Google Scholar]
- 10. Jung KW, Park S, Kong HJ, et al. Cancer statistics in Korea: incidence, mortality, survival, and prevalence in 2009. Cancer Res Treat. 2012;44:11‐24. [DOI] [PMC free article] [PubMed] [Google Scholar]
- 11. Halabi S, Lin CY, Kelly WK, et al. Updated prognostic model for predicting overall survival in first‐line chemotherapy for patients with metastatic castration‐resistant prostate cancer. J Clin Oncol. 2014;32:671‐677. [DOI] [PMC free article] [PubMed] [Google Scholar]
- 12. Kirby M, Hirst C, Crawford ED. Characterising the castration‐resistant prostate cancer population: a systematic review. Int J Clin Pract. 2011;65:1180‐1192. [DOI] [PubMed] [Google Scholar]
- 13. Howard N, Clementino M, Kim D, et al. New developments in mechanisms of prostate cancer progression. Semin Cancer Biol. 2019;57:111‐116. [DOI] [PubMed] [Google Scholar]
- 14. Virgo KS, Basch E, Loblaw DA, et al. Second‐line hormonal therapy for men with chemotherapy‐naive, castration‐resistant prostate cancer: American Society of Clinical Oncology Provisional Clinical Opinion. J Clin Oncol. 2017;35:1952‐1964. [DOI] [PubMed] [Google Scholar]
- 15. Prosdocimo DA, Sabeh MK, Jain MK. Kruppel‐like factors in muscle health and disease. Trends Cardiovasc Med. 2015;25:278‐287. [DOI] [PMC free article] [PubMed] [Google Scholar]
- 16. McConnell BB, Yang VW. Mammalian Kruppel‐like factors in health and diseases. Physiol Rev. 2010;90:1337‐1381. [DOI] [PMC free article] [PubMed] [Google Scholar]
- 17. Oishi Y, Manabe I. Kruppel‐Like factors in metabolic homeostasis and cardiometabolic disease. Front Cardiovasc Med. 2018;5:69. [DOI] [PMC free article] [PubMed] [Google Scholar]
- 18. Li Z, Martin M, Zhang J, et al. Kruppel‐Like Factor 4 regulation of cholesterol‐25‐hydroxylase and liver X receptor mitigates atherosclerosis susceptibility. Circulation. 2017;136:1315‐1330. [DOI] [PMC free article] [PubMed] [Google Scholar]
- 19. Manoharan P, Basford JE, Pilcher‐Roberts R, Neumann J, Hui DY, Lingrel JB. Reduced levels of microRNAs miR‐124a and miR‐150 are associated with increased proinflammatory mediator expression in Kruppel‐like factor 2 (KLF2)‐deficient macrophages. J Biol Chem. 2014;289:31638‐31646. [DOI] [PMC free article] [PubMed] [Google Scholar]
- 20. Zhang Y, Lei CQ, Hu YH, et al. Kruppel‐like factor 6 is a co‐activator of NF‐kappaB that mediates p65‐dependent transcription of selected downstream genes. J Biol Chem. 2014;289:12876‐12885. [DOI] [PMC free article] [PubMed] [Google Scholar]
- 21. Date D, Das R, Narla G, Simon DI, Jain MK, Mahabeleshwar GH. Kruppel‐like transcription factor 6 regulates inflammatory macrophage polarization. J Biol Chem. 2014;289:10318‐10329. [DOI] [PMC free article] [PubMed] [Google Scholar]
- 22. Nichols J, Smith A. Pluripotency in the embryo and in culture. Cold Spring Harb Perspect Biol. 2012;4:a008128. [DOI] [PMC free article] [PubMed] [Google Scholar]
- 23. Kim SH, Park YY, Cho SN, Margalit O, Wang D, DuBois RN. Kruppel‐Like Factor 12 promotes colorectal cancer growth through early growth response protein 1. PLoS ONE. 2016;11:e0159899. [DOI] [PMC free article] [PubMed] [Google Scholar]
- 24. Tsompana M, Gluck C, Sethi I, et al. Reactivation of super‐enhancers by KLF4 in human head and neck squamous cell carcinoma. Oncogene. 2020;39(2):262‐277. [DOI] [PubMed] [Google Scholar]
- 25. Huang WY, Hsu SD, Huang HY, et al. MethHC: a database of DNA methylation and gene expression in human cancer. Nucleic Acids Res. 2015;43:D856‐D861. [DOI] [PMC free article] [PubMed] [Google Scholar]
- 26. Cerami E, Gao J, Dogrusoz U, et al. The cBio cancer genomics portal: an open platform for exploring multidimensional cancer genomics data. Cancer Discov. 2012;2:401‐404. [DOI] [PMC free article] [PubMed] [Google Scholar]
- 27. Gao J, Aksoy BA, Dogrusoz U, et al. Integrative analysis of complex cancer genomics and clinical profiles using the cBioPortal. Sci Signal. 2013;6:pl1. [DOI] [PMC free article] [PubMed] [Google Scholar]
- 28. Tang Z, Li C, Kang B, Gao G, Li C, Zhang Z. GEPIA: a web server for cancer and normal gene expression profiling and interactive analyses. Nucleic Acids Res. 2017;45:W98‐W102. [DOI] [PMC free article] [PubMed] [Google Scholar]
- 29. Zhou Y, Zhou B, Pache L, et al. Metascape provides a biologist‐oriented resource for the analysis of systems‐level datasets. Nat Commun. 2019;10:1523. [DOI] [PMC free article] [PubMed] [Google Scholar]
- 30. Newman AM, Liu CL, Green MR, et al. Robust enumeration of cell subsets from tissue expression profiles. Nat Methods. 2015;12:453‐457. [DOI] [PMC free article] [PubMed] [Google Scholar]
- 31. Meng J, Liu Y, Guan S, et al. The establishment of immune infiltration based novel recurrence predicting nomogram in prostate cancer. Cancer Med. 2019;8:5202‐5213. [DOI] [PMC free article] [PubMed] [Google Scholar]
- 32. Hoshida Y, Brunet JP, Tamayo P, Golub TR, Mesirov JP. Subclass mapping: identifying common subtypes in independent disease data sets. PLoS ONE. 2007;2:e1195. [DOI] [PMC free article] [PubMed] [Google Scholar]
- 33. Jiang P, Gu S, Pan D, et al. Signatures of T cell dysfunction and exclusion predict cancer immunotherapy response. Nat Med. 2018;24:1550‐1558. [DOI] [PMC free article] [PubMed] [Google Scholar]
- 34. Lu X, Jiang L, Zhang L, et al. Immune signature‐based subtypes of cervical squamous cell carcinoma tightly associated with human papillomavirus type 16 expression, molecular features, and clinical outcome. Neoplasia. 2019;21:591‐601. [DOI] [PMC free article] [PubMed] [Google Scholar]
- 35. Roh W, Chen PL, Reuben A, et al. Integrated molecular analysis of tumor biopsies on sequential CTLA‐4 and PD‐1 blockade reveals markers of response and resistance. Sci Transl Med. 2017;9:eaah3560. [DOI] [PMC free article] [PubMed] [Google Scholar]
- 36. Geeleher P, Cox NJ, Huang RS. Clinical drug response can be predicted using baseline gene expression levels and in vitro drug sensitivity in cell lines. Genome Biol. 2014;15:R47. [DOI] [PMC free article] [PubMed] [Google Scholar]
- 37. Christman JK. 5‐Azacytidine and 5‐aza‐2'‐deoxycytidine as inhibitors of DNA methylation: mechanistic studies and their implications for cancer therapy. Oncogene. 2002;21:5483‐5495. [DOI] [PubMed] [Google Scholar]
- 38. Kim K, Kim JS. Intervention for patient reported urinary symptoms in prostate cancer survivors: systematic review. J Cancer Surviv. 2017;11:643‐654. [DOI] [PubMed] [Google Scholar]
- 39. Cheng Y, Zhuo L, Pan Y, et al. Treatment patterns of prostate cancer with bone metastasis in Beijing: a real‐world study using data from an administrative claims database. Pharmacoepidemiol Drug Saf. 2019;28(11):1501‐1509. [DOI] [PMC free article] [PubMed] [Google Scholar]
- 40. Zhao SG, Lehrer J, Chang SL, et al. The immune landscape of prostate cancer and nomination of PD‐L2 as a potential therapeutic target. J Natl Cancer Inst. 2019;111:301‐310. [DOI] [PubMed] [Google Scholar]
- 41. Shao N, Zhu Y, Wan FN, Ye DW. Identification of seven long noncoding RNAs signature for prediction of biochemical recurrence in prostate cancer. Asian J Androl. 2019;21:618‐622. [DOI] [PMC free article] [PubMed] [Google Scholar]
- 42. Alshalalfa M, Liu Y, Wyatt AW, et al. Characterization of transcriptomic signature of primary prostate cancer analogous to prostatic small cell neuroendocrine carcinoma. Int J Cancer. 2019;145(12):3453‐3461. [DOI] [PMC free article] [PubMed] [Google Scholar]
- 43. Wang Q, He Y, Kan W, et al. microRNA‐32‐5p targets KLF2 to promote gastric cancer by activating PI3K/AKT signaling pathway. Am J Transl Res. 2019;11:4895‐4908. [PMC free article] [PubMed] [Google Scholar]
- 44. Mao A, Zhou X, Liu Y, Ding J, Miao A, Pan G. KLF8 is associated with poor prognosis and regulates glycolysis by targeting GLUT4 in gastric cancer. J Cell Mol Med. 2019;23:5087‐5097. [DOI] [PMC free article] [PubMed] [Google Scholar]
- 45. Sun W, Hu S, Zu Y, Deng Y. KLF3 is a crucial regulator of metastasis by controlling STAT3 expression in lung cancer. Mol Carcinog. 2019;58(11):1933‐1945. [DOI] [PMC free article] [PubMed] [Google Scholar]
- 46. Hu Y, Zhang M, Tian N, et al. The antibiotic clofoctol suppresses glioma stem cell proliferation by activating KLF13. J Clin Invest. 2019;129:3072‐3085. [DOI] [PMC free article] [PubMed] [Google Scholar]
- 47. Luo XH, Liu JZ, Wang B, et al. KLF14 potentiates oxidative adaptation via modulating HO‐1 signaling in castrate‐resistant prostate cancer. Endocr Relat Cancer. 2019;26:181‐195. [DOI] [PubMed] [Google Scholar]
- 48. Shen P, Sun J, Xu G, et al. KLF9, a transcription factor induced in flutamide‐caused cell apoptosis, inhibits AKT activation and suppresses tumor growth of prostate cancer cells. Prostate. 2014;74:946‐958. [DOI] [PubMed] [Google Scholar]
- 49. Wang Q, Peng R, Wang B, et al. Transcription factor KLF13 inhibits AKT activation and suppresses the growth of prostate carcinoma cells. Cancer Biomark. 2018;22:533‐541. [DOI] [PMC free article] [PubMed] [Google Scholar]
- 50. He HJ, Gu XF, Xu WH, Yang DJ, Wang XM, Su Y. Kruppel‐like factor 8 is a novel androgen receptor co‐activator in human prostate cancer. Acta Pharmacol Sin. 2013;34:282‐288. [DOI] [PMC free article] [PubMed] [Google Scholar]
- 51. Yang Y, Liu R, Qiu R, et al. CRL4B promotes tumorigenesis by coordinating with SUV39H1/HP1/DNMT3A in DNA methylation‐based epigenetic silencing. Oncogene. 2015;34:104‐118. [DOI] [PubMed] [Google Scholar]
- 52. Spyropoulou A, Gargalionis A, Dalagiorgou G, et al. Role of histone lysine methyltransferases SUV39H1 and SETDB1 in gliomagenesis: modulation of cell proliferation, migration, and colony formation. Neuromolecular Med. 2014;16:70‐82. [DOI] [PubMed] [Google Scholar]
- 53. Carbone DP, Reck M, Paz‐Ares L, et al. First‐Line Nivolumab in Stage IV or recurrent non‐small‐cell lung cancer. N Engl J Med. 2017;376:2415‐2426. [DOI] [PMC free article] [PubMed] [Google Scholar]
- 54. Kijima T, Hazama S, Tsunedomi R, et al. MicroRNA‐6826 and ‐6875 in plasma are valuable noninvasive biomarkers that predict the efficacy of vaccine treatment against metastatic colorectal cancer. Oncol Rep. 2017;37:23‐30. [DOI] [PMC free article] [PubMed] [Google Scholar]
Associated Data
This section collects any data citations, data availability statements, or supplementary materials included in this article.
Supplementary Materials
Supplementary materials
Data Availability Statement
The data sets used and/or analysed during the current study are available from the corresponding author on reasonable request.