Abstract
PURPOSE
To demonstrate the proper use of the Phansalkar local thresholding method (Phansalkar method) in choriocapillaris (CC) quantification with optical coherence tomography angiography (OCTA).
DESIGN
Retrospective, observational case series.
METHODS
Swept source OCTA imaging was performed using 3×3 mm and 6×6 mm scanning patterns. The CC slab was extracted after semiautomatic segmentation of the retinal pigment epithelium/Bruch membrane complex. Retinal projection artifacts were removed before further analysis, and CC OCTA images from drusen eyes were compensated using a previously published strategy. CC flow deficits (FDs) were segmented with 2 previously published algorithms: the fuzzy C-means approach (FCM method) and the Phansalkar method. With the Phansalkar method, different parameters were tested and a local window radius of 1 to15 pixels was used. FD density, mean FD size, and FD number were calculated for comparison.
RESULTS
Six normal eyes from 6 subjects and 6 eyes with drusen secondary to age-related macular degeneration from 6 subjects were analyzed. With both 3×3 mm and 6×6 mm scans from all eyes, the FD metrics were highly dependent on the selection of the local window radius when using the Phansalkar method. Larger window radii resulted in higher FD density values. FD number increased with the increase in the window radius but then decreased, with an inflection point at about 1 to 2 intercapillary distances. Mean FD size decreased then increased with increasing window radii.
CONCLUSIONS
Multiple parameters, especially the local window radius, should be optimized before using the Phansalkar method for the quantification of CC FDs with OCTA imaging. It is recommended that the proper use of the Phansalkar method should include the selection of the window radius that is related to the expected intercapillary distance in normal eyes.
CHORIOCAPILLARIS (CC) IS A CAPILLARY LAYER located along the inner choroid adjacent to the Bruch membrane (BM). It plays an essential role in providing the vascular support for retinal pigment epithelium (RPE) and outer retina.1,2 Previous studies have reported correlations between abnormalities in the CC with multiple ocular diseases, such as age-related macular degeneration (AMD), diabetic retinopathy, uveitis, and glaucoma.3–7 Consequently, visualizing and quantifying changes in the CC in normal and diseased eyes have become an area of interest for many researchers. Optical coherence tomography angiography (OCTA)8 has become the preferred clinical imaging method for performing such tasks.9–21 OCTA is a noninvasive, safe, and easily performed imaging technology that uses repeated B-scans to contrast blood motion within static tissue. With common commercial configurations, OCTA generally provides depth-resolved imaging with resolutions of approximately 15 μm to 20 μm laterally and 5 μm to 6 μm axially. With the increasing use of OCTA by clinical investigators, it has become apparent that there is some confusion about the appropriate use of thresholding algorithms for quantifying CC.
First, the lateral resolution of OCTA is approximately the same as the macular intercapillary distance (ICD) within the human CC.22 This limitation makes it difficult for OCTA to fully resolve the detailed CC vasculature network, and it is often the case that neighboring capillaries cannot be resolved from one another.23 To circumvent this difficulty, many researchers have chosen to quantify flow deficits (FDs) rather than the actual CC vasculature with OCTA. Second, the CC lies beneath the RPE, a highly light scattering layer. Moreover, abnormalities of the RPE/BM complex, such as drusen and other RPE detachments, would result in signal attenuation and uneven illumination of the CC, which can produce artefactual shadows that could be erroneously misinterpreted as FDs. This uneven illumination can also lead to complications in the RPE/BM complex boundary segmentation when generating the CC layer.
In general, the segmentation of CC FDs is a process that requires binarization in which all pixels on the OCTA CC image are separated into 2 groups: one that represents the vasculature and another that represents FDs. A common approach is to use a global threshold technique where all the pixels with values higher than the threshold are identified as the vasculature group, otherwise the FD group. However, this approach might be problematic in the presence of RPE/BM abnormalities, where darker CC patches caused by uneven illumination could lead to false positive identification of FDs. To mitigate this difficulty, a signal compensation strategy13 was proposed, where the intensity of OCT CC structural slab image was used as a surrogate for any uneven illumination, and its reversed image was used to compensate the OCTA CC flow slab. This way, the OCTA signal intensity would be elevated in regions with low OCT signal intensity caused by the abnormal RPE/BM but the OCTA signal intensity would be kept the same in regions with a normal OCT signal intensity.
Another common strategy when binarizing an image with uneven illumination is known as local thresholding. Local thresholding uses a small window rather than the whole image to determine the threshold for binarization. Therefore, if the window is sufficiently small, then one could consider that the illumination is uniform within this small window. Theoretically, a smaller window size would lead to better results, as long as the window covers both the background and the objects of interest.24 A larger window could lead to poorer segmentation because it is more adversely affected by the uneven illumination. In addition, a larger window would take up more computational resources.25
In the published literature, local thresholding techniques have been the popular choices for quantifying CC FDs, with the most popular technique being the Phansalkar local thresholding method (Phansalkar method) in ImageJ software (National Institutes of Health, Bethesda, MD, USA).17–20,26–29 Phansalkar first introduced this local thresholding technique30 to segment cell nuclei in cytologic and histologic images, where the intensity of foreground and background could vary significantly because of uneven staining. Historically, this local method was modified from the Sauvola local thresholding method,31 and Phansalkar’s modifications specified some parameters that were more suitable for threshold calculation in low contrast images like cytologic images. In ImageJ, there are 3 parameters that can be changed to optimize the binarization results when using the Phansalkar method. However, when Spaide and associates20 first adopted the Phansalkar method for CC quantification, they used the default parameters and a window radius of 15 pixels on images of 304 × 304 pixels derived from 3×3 mm OCTA images. Later studies have all followed such conventions by using the default parameters that included a radius of 15 pixels even though the specific images size in both millimeters and pixels were different.18,19,27–29 In local thresholding, different choices of local window size could lead to different binarization results and the inconsistency of window radius choice (in microns) in the Phansalkar method could significantly compromise the ability to compare published CC studies.
In this study, we used clinically acquired OCTA data to explain the complications and consequences of using the Phansalkar method to image CC FDs. We also recommend a strategy for appropriately choosing between different window radii and other parameters when using the Phansalkar method and provide a rationale for when local thresholding is necessary for quantifying CC FDs.
METHODS
THIS RETROSPECTIVE, OBSERVATIONAL STUDY WAS performed at the University of Miami and the University of Washington. This study was approved by the Institutional Review Board of the University of Miami Miller School of Medicine and the Institutional Review Board of Medical Sciences Subcommittee at the University of Washington, Seattle. The tenets of the Declaration of Helsinki and the Health Insurance Portability and Accountability Act of 1996 regulations were followed. Informed consent was obtained from all subjects before participation in an ongoing prospective OCT study at the Bascom Palmer Eye Institute. Two groups of subjects were enrolled: subjects with normal eyes and unremarkable ocular history, no visual complains, and no identified optic disc, retinal, or choroidal pathologies; subjects with intermediate AMD had typical drusen with no evidence of nascent geographic atrophy. They were enrolled from January 2017 to February 2018.
IMAGING ACQUISITION
In all subjects, both eyes under-went swept source OCTA (SS-OCTA) scanning (PLEX Elite 9000; Carl Zeiss Meditec, Dublin, CA, USA) using an instrument with a 100 kHz light source that has a 1060 nm central wavelength and a 100 nm bandwidth. This system provides an axial resolution of ~5.5 μm and a lateral resolution of ~20 μm estimated at the retinal surface.32 Both 3×3 mm and 6×6 mm scanning patterns were performed on both eyes of each subject. The right eyes were selected for further analysis unless low signal strength (<7) or severe motion artifacts were present. The 3×3 mm scans have 300 A-lines per B-scan and 300 B-scans in each volume, yielding a digital resolution of 10 μm/pixel. The 6×6 mm scans have 500 A-lines per B-scan and 500 B-scans in each volume, yielding a digital resolution of 12 mm/pixel. When outputting OCTA images, both the 3×3 mm and 6×6 mm OCTA images were resized into images comprised of 1024 × 1024 pixels, which were the same as the default system settings on PLEX Elite 9000, and this resized image yielded a pixel size of 2.9 μm/pixel for the 3×3 mm images and a 5.8 μm/pixel for the 6×6 mm images.
IMAGE PROCESSING
After acquiring volumetric SS-OCTA data, a semiautomated algorithm33 was used to obtain accurate segmentation of the RPE/BM complex layer. The CC slab was defined as a 15 μm thick slab that started 16 μm below the RPE/BM complex.34 En face images were produced using a maximum projection method and both 3×3 mm and 6×6 mm images were resized into 1024 × 1024 pixels to be consistent with machine output images (Figure 1, A). Retinal projection artifacts were subsequently removed35 and the corresponding regions were excluded in further analyses.
FIGURE 1.
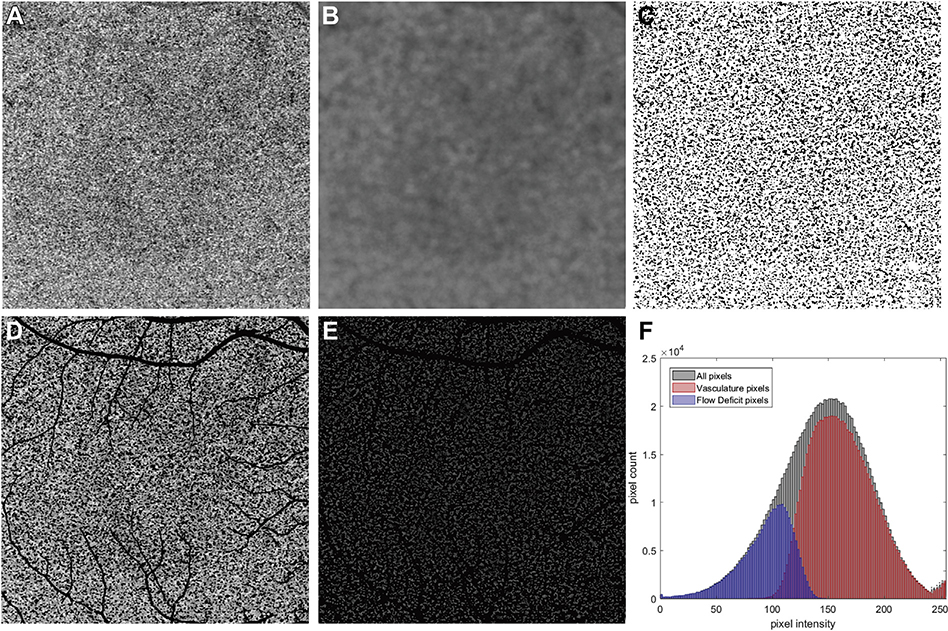
Example of the Phansalkar local thresholding method (Phansalkar method) applied to a 6×6 mm scan and the corresponding pixel value histogram analysis after binarization. (A) 6×6 mm choriocapillaris (CC) swept source optical coherence tomography angiography (SS-OCTA) image from a normal subject. (B) Calculated threshold image using the Phansalkar method with a radius of 15 pixels. (C) Binarized CC image with white pixels representing the vasculature and black pixels representing the flow deficits (FDs). This image was derived by examining all pixels in part A and determining if their intensities are above or below the threshold image in part B. If the intensity in part A is above the threshold image in part B, then that pixel would represent flow and is represented as white, and if the intensity in part A is below the threshold image in part B, then that pixel would represent a flow deficit and is represented as black. (D) All pixels from part A that are white in part C are shown with their original image intensities from panel A and projection artifacts are represented as black. (E) All pixels from A that are black in part C are shown with their original image intensities from part A and the projection artifacts are represented as black. These pixels representing FDs are not totally black in part A and have a gray appearance with variable intensities. (F) Histograms of all pixels from part A, the vasculature pixels (CC) from part D, and the FD pixels from part E. In part F, the histograms representing all pixels are in black, the histogram representing vasculature pixels is in red, and the histogram representing FD pixels is in blue. The x-axis represents the intensities of the pixels (range from 0 to 255) and the y-axis represents the number of pixels with the given intensity. The projection artifacts are not included when quantifying the vascular and FD pixels, and that is why some of the histograms for all pixels exceeds the combined number of pixels when summing the CC and FD numbers along the y-axis.
Two methods were used for CC FDs segmentation: a complex thresholding strategy36 using a fuzzy C-means algorithm (the FCM method) and the Phansalkar method provided in ImageJ, with window radii ranging from 1 to 15 pixels. For the Phansalkar method in ImageJ, a unique threshold for each individual pixel was calculated using the following equation30,37:
For each individual pixel (x,y), a circle with a radius of R is drawn centered at (x,y). M is the mean of all the pixels within the circle, and SD is the standard deviation of all the pixels within the window. In ImageJ, the local window is implemented as a circle centered at each pixel, meaning that the actual window diameter is:
In addition to the radius R, 4 other parameters: p, q, k, and r can be varied to optimize the calculation of the threshold. In ImageJ, p and q are fixed to be 2 and 10, respectively, and cannot be changed. The variable k corresponds to parameter 1 in ImageJ, while the variable r corresponds to parameter 2. They have default values of 0.25 and 0.5, respectively, in ImageJ, but they can be adjusted by the user. The term r is a normalization term for SD, which may be interpreted as the dynamic range of the SD.
In ImageJ, before calculating thresholds using the Phansalkar method, the grayscale images are automatically normalized to an intensity range of 0 to 1. The Phansalkar method finds a threshold value at each pixel, as shown in Figure 1, B, which is an example using a window radius of 115 pixels. For each pixel, if its value from the OCTA CC image (Figure 1, A) is higher than its threshold value on the threshold image (Figure 1, B), the pixel would appear as white on the binarized image (Figure 1, C) and categorized as the CC vasculature group (Figure 1, D), otherwise the CC FD group (Figure 1, E). The histogram for the whole image, as well as those for the CC vasculature group and the CC FD group, are shown in Figure 1, F. It should be noted that, in addition to these 2 groups, the whole image includes pixels corresponding to projection artifacts.
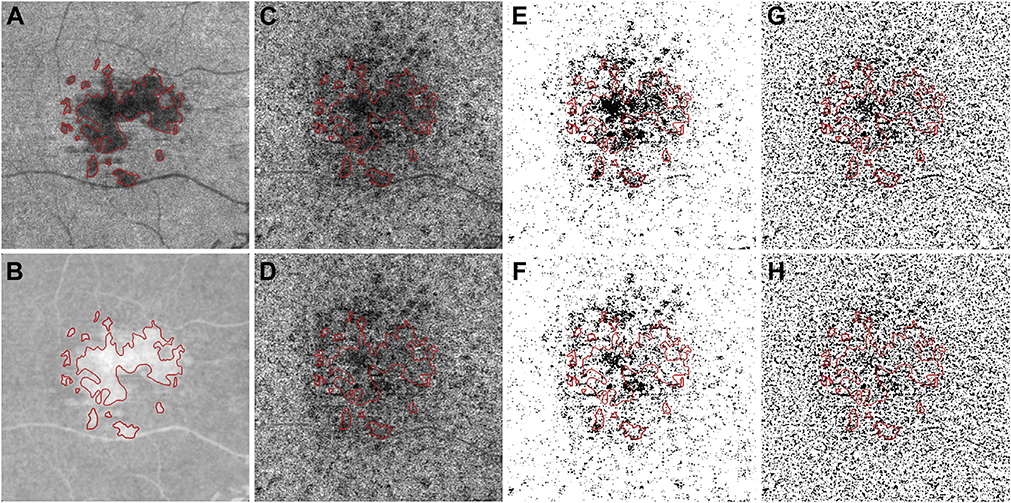
Drusen areas were manually drawn on the OCT enface RPE to RPE fit slab, using the corresponding B-scans to confirm RPE elevation. Drusen with greatest linear diameter smaller than 125 microns were excluded (Figure 2, A, red lines). All OCTA CC images were further compensated using the previously published signal attenuation compensation strategy.13 Briefly, the structural image from the OCT CC slab (Figure 2, A) was inverted (Figure 2, B) and used for signal attenuation compensation for OCTA CC slab (Figures 2, C and D). Both compensated drusen CC images (Figure 2, D) and uncompensated drusen CC images (Figure 2, C) were used for further quantification using the FCM method (Figure 2, E and F) and the Phansalkar method (Figure 2, G and H).
FIGURE 2.
Example of applying the compensation strategy when using a 6 × 6 mm image from an eye with drusen. (A) En face swept source optical coherence tomography (SS-OCT) structural image from the same slab used to image the choriocapillaris (CC). Red lines indicate the boundary of the drusen manually identified from the structural SS-OCT en face RPE to RPE fit slab; corresponding B-scans were also used to confirm the drusen-related RPE elevation. Drusen with greatest linear diameter < 125 μm were excluded. (B) The inverted en face CC SS-OCT image from part A that will be used to compensate for signal attenuation in the CC flow image. (C) En face SS-OCT angiography (SS-OCTA) image of the CC layer before compensation. (D) En face SS-OCTA image of the CC layer after compensation. (E) Binarized uncompensated CC image using the fuzzy C-means (FCM) method. (F) Binarized compensated CC image using the FCM method. (G) Binarized uncompensated CC image using the Phansalkar method with a radius of 15 pixels. (H) Binarized compensated CC image using the Phansalkar method with a radius of 15 pixels.
After binarization, the following quantitative CC measurements were calculated: FD density (FDD), FD number (FDN), and mean FD size the ratio of no flow area to the total image area, a unit-less value ranging from 0 to 1. FDD and CC vessel density would add up to 1. FDN was defined as the total number of individually detected CC FDs. MFDS was the average size of individual FDs, defined as the total CC FDs area divided by FDN, with a unit of μm2. Boxplots were used to display the CC metrics for all subjects (normal eyes, compensated drusen eyes, and uncompensated drusen eyes).
RESULTS
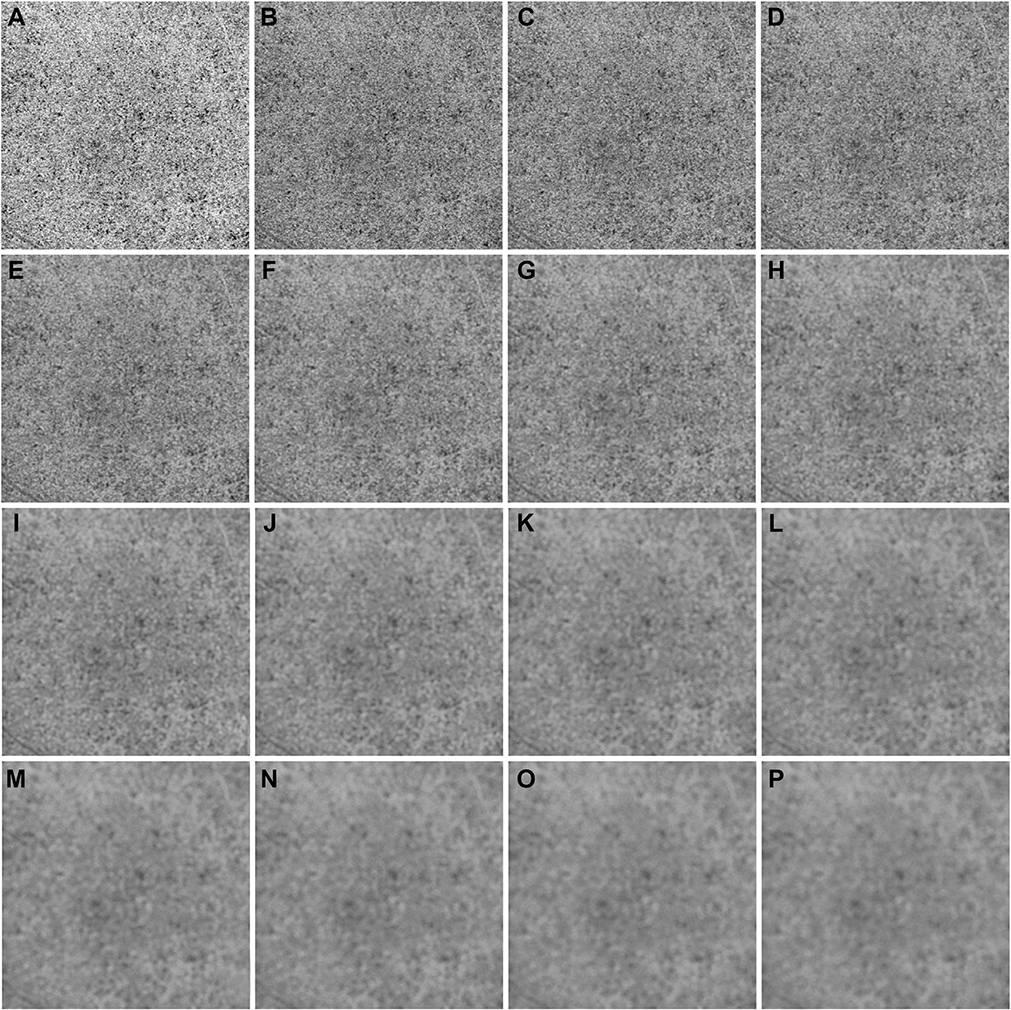
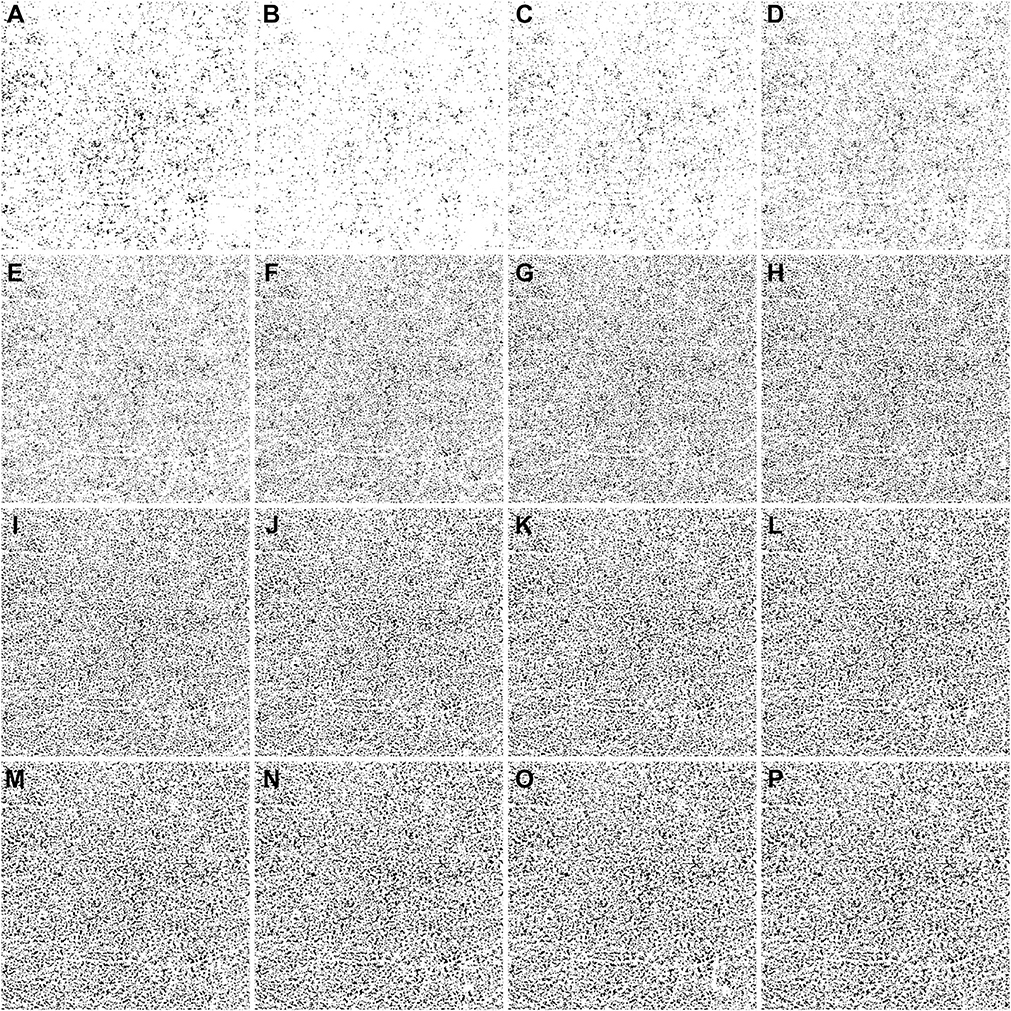
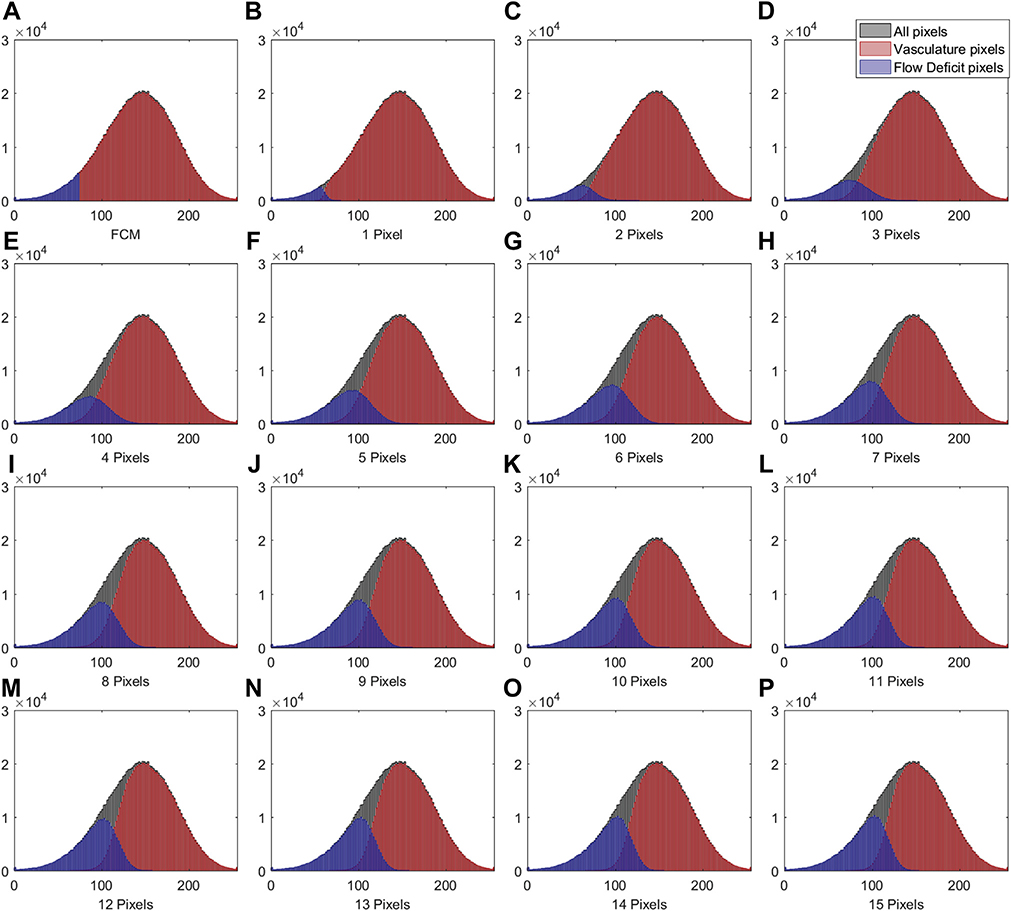
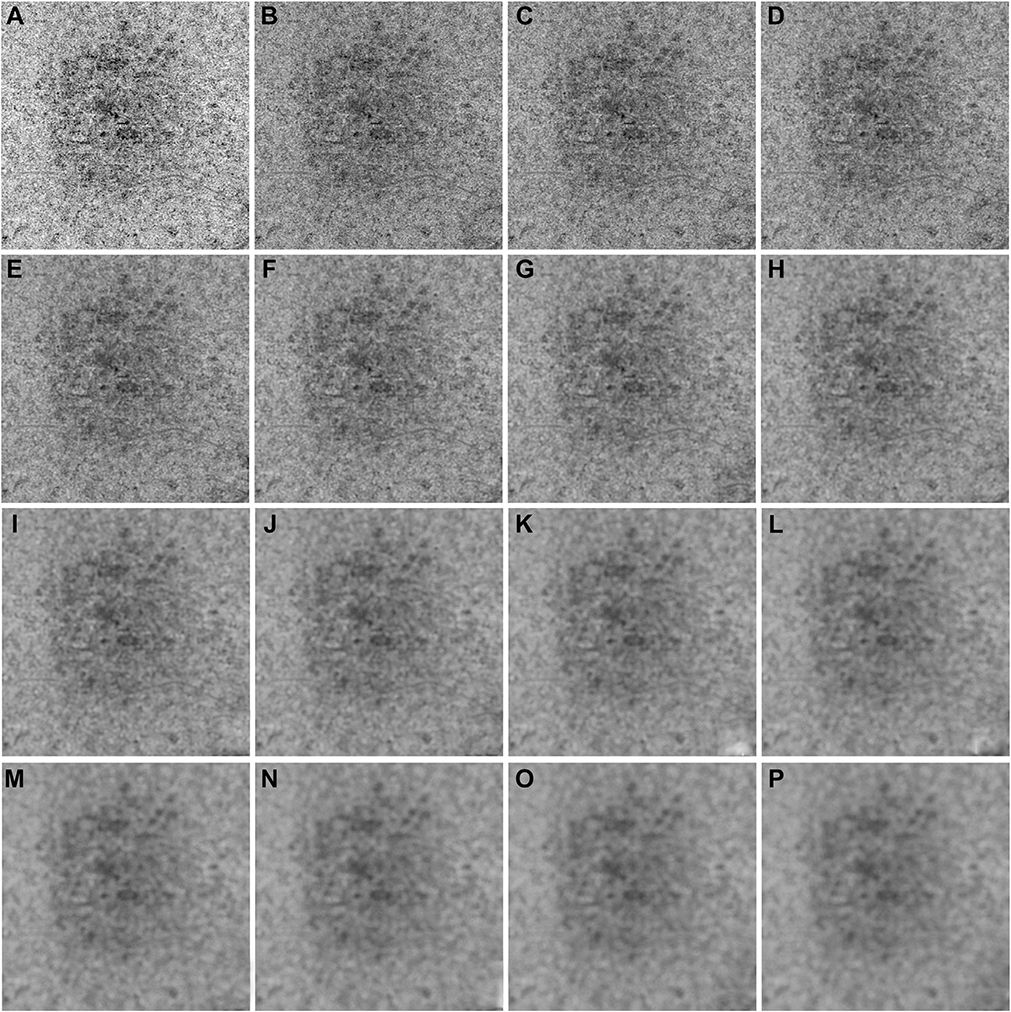
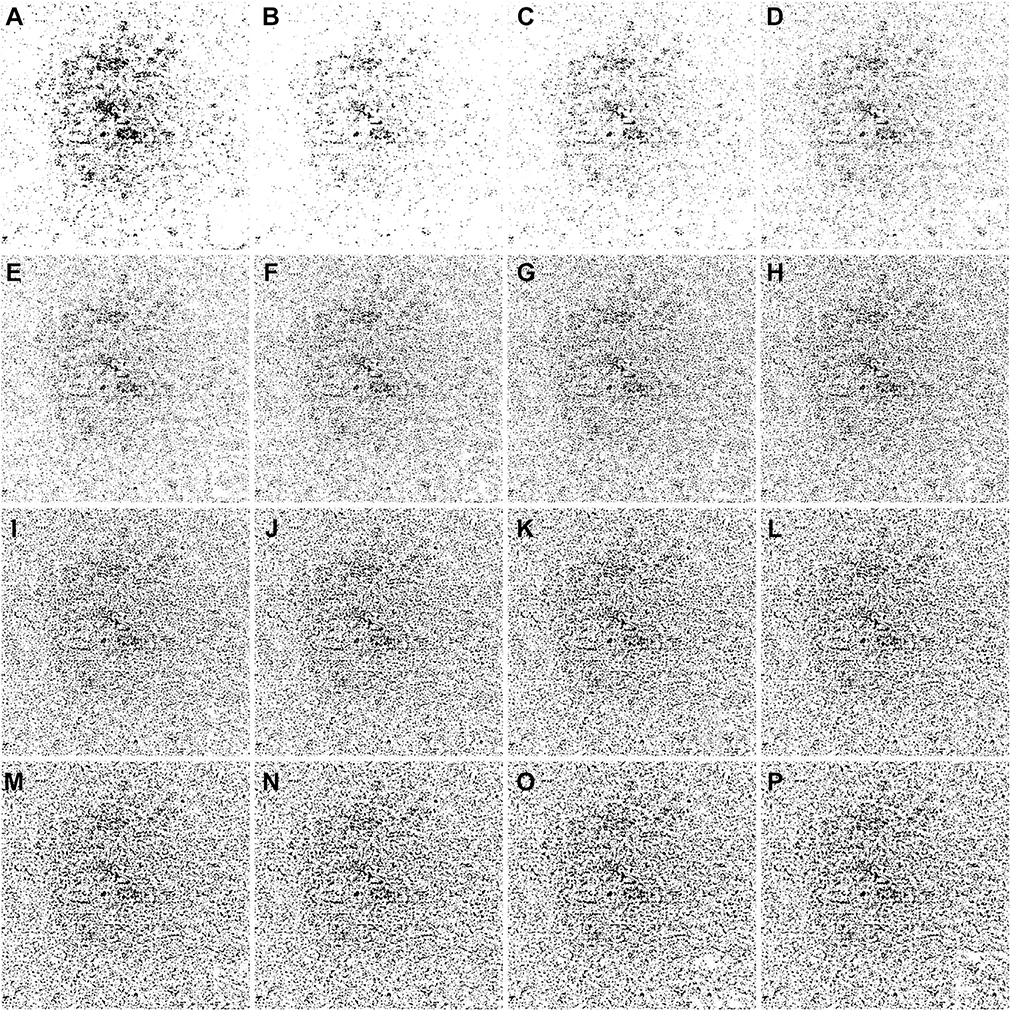
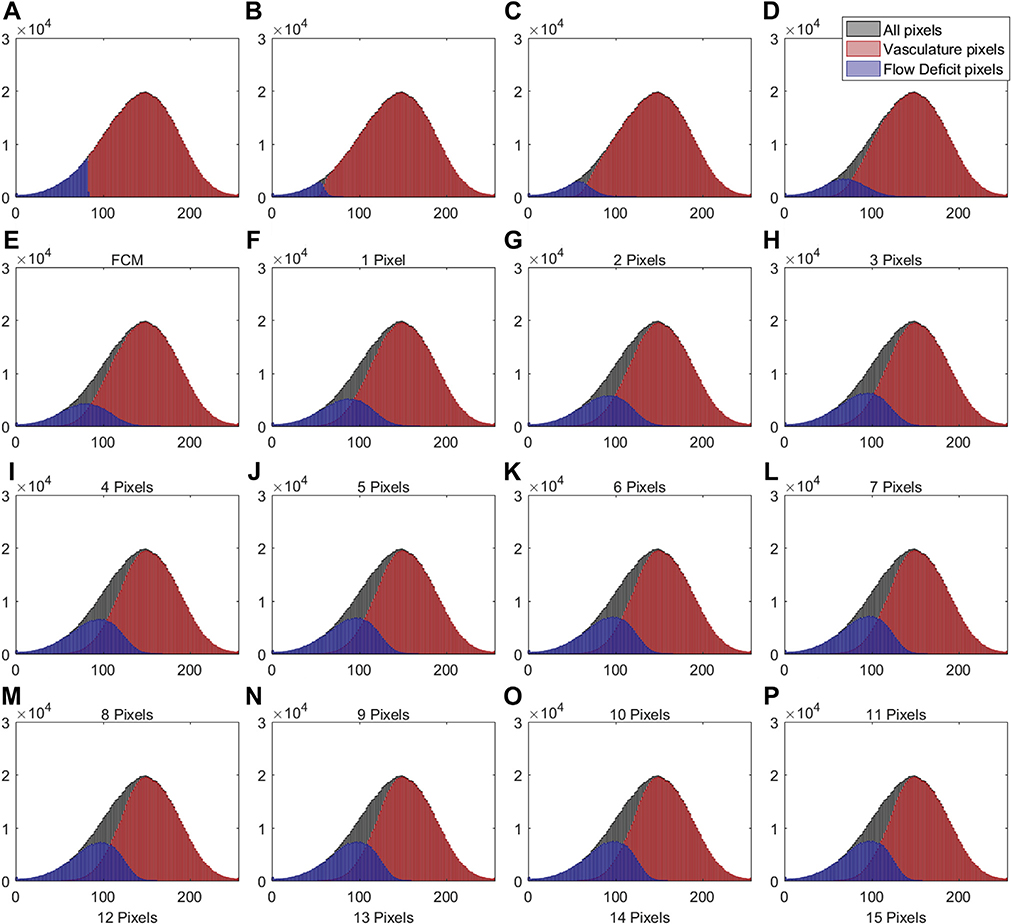
IN TOTAL, 6 SUBJECTS WITH A NORMAL OCULAR HISTORY, no visual complains, and no identified optic disc, retinal, or choroidal pathologies on examination and 6 subjects with drusen caused by intermediate AMD were enrolled in this study. Both 3×3 mm and 6×6 mm scans were performed. As described in the Methods section, when using the Phansalkar method, a threshold image (Figure 1, B) can be calculated to visualize the specific threshold for each pixel. Figure 3 shows examples of how the appearance of such threshold image changes as the pixel radius increases using a normal 6×6 mm scan. Panel A shows the en face CC OCTA image and panels B through P show the threshold images obtained by the Phansalkar method using window radii from 1 to 15 pixels. A trend of increasing blurriness can be visually observed with increasing window radii. Correspondingly, Figure 4 shows the binarized CC image obtained using the FCM method (Figure 4, A) and the Phansalkar method with window radii ranging from 1 to 15 pixels (Figure 4, B through P). The increased blurriness of the threshold images (Figure 3) with larger window radii correspond to more homogenous appearance of the CC FDs on the binarized image (Figure 4). Figure 5 demonstrates the histogram analyses for each pixel group (Figure 1, F) using different binarization methods. Here panel A represents the FCM method and panels B through P represent the Phansalkar method with window radii ranging from 1 to 15 pixels. The FCM is a global thresholding technique, and as a result, the vasculature group pixels and the FD group pixels are cleanly separated by the global threshold value (Figure 5, A). On the other hand, the Phansalkar method is a local thresholding technique, and as a result, the vasculature group pixels and the FD group pixels overlap. The overlap region appears purple on Figure 5, B through P. It should be noted that the overlap region increases as the window radii increase. Figures 6 through 8 show additional examples of the same threshold images (Figure 6), binarized images (Figure 7), and histogram analyses (Figure 8) for a 6×6 mm scan of an eye with drusen.
FIGURE 3.
Examples of using the Phansalkar local thresholding method (Phansalkar method) with window radii ranging from 1 to 15 pixels on a 6×6 mm scan from a normal eye. (A) En face choriocapillaris (CC) swept source optical coherence tomography angiography image that has been compensated by using the inverted CC structure slab. (B through P) Each panel represents an increase in the radius of 1 pixel when using the Phansalkar method to threshold the image shown in part A. Part B represents the image derived from using a radius of 1 pixel and part P represents the image derived from using a radius of 15 pixels. The value of each pixel in parts B through P is the threshold for corresponding pixel in part A.
FIGURE 4.
Examples of binarized choriocapillaris (CC) images using different strategies on the same 6×6 mm scan from the normal eye shown in Figure 3. (A) Binarized CC image using the fuzzy C-means method. (B through P) Binarized CC images using the Phansalkar local thresholding method with window radii ranging from 1 to 15 pixels.
FIGURE 5.
Histogram plots of different groups of pixels corresponding to the 6- × 6mm choriocapillaris images shown in Figures 3 and 4. (A) Histogram of different groups of pixels using the fuzzy C-means method. (B through P) Histograms of different groups of pixels using the Phansalkar local thresholding method with window radii ranging from 1 to 15 pixels. As in Figure 1, part F, the black color represents all pixels from the compensated swept source optical coherence tomography angiography choriocapillaris (CC) image, the red color represents the vasculature pixels corresponding to the CC, and the blue color represents the pixels corresponding to the CC flow deficits.
FIGURE 6.
Examples of a 6×6 mm image from an eye with drusen that has been thresholded using the Phansalkar local thresholding method (Phansalkar method) with a range of window radii from 1 through 15 pixels. (A) En face choriocapillaris (CC) swept source optical coherence tomography angiography (SS-OCTA) image that has been compensated by using the CC inverted structural slab. (B through P) Each panel represents an increase in the radius of 1 pixel when using the Phansalkar method to threshold the image shown in part A. Part B represents the threshold image derived from using a radius of 1 pixel and part P represents the threshold image derived from using a radius of 15 pixels. The value of each pixel in parts B through P is the threshold for corresponding pixel in part A.
FIGURE 7.
Examples of binarized choriocapillaris (CC) images using different strategies on the same 6×6 mm scan from an eye with drusen shown in Figure 6. (A) Binarized CC image using the fuzzy C-means method. (B through P) Binarized CC image using the Phansalkar local thresholding method with window radii ranging from 1 to 15 pixels.
FIGURE 8.
Histogram plots of different groups of pixels corresponding to the 6×6 mm choriocapillaris images shown in Figures 6 and 7. (A) Histogram of different groups of pixels using the fuzzy C-means method. (B through P) Histograms of different groups of pixels using the Phansalkar local thresholding method with window radii ranging from 1 to 15 pixels. As in Figure 1, part F, the black color represents all pixels from the compensated swept source optical coherence tomography angiography choriocapillaris (CC) image, the red color represents the vasculature pixels corresponding to the CC, and the blue color represents the pixels corresponding to the CC flow deficits.
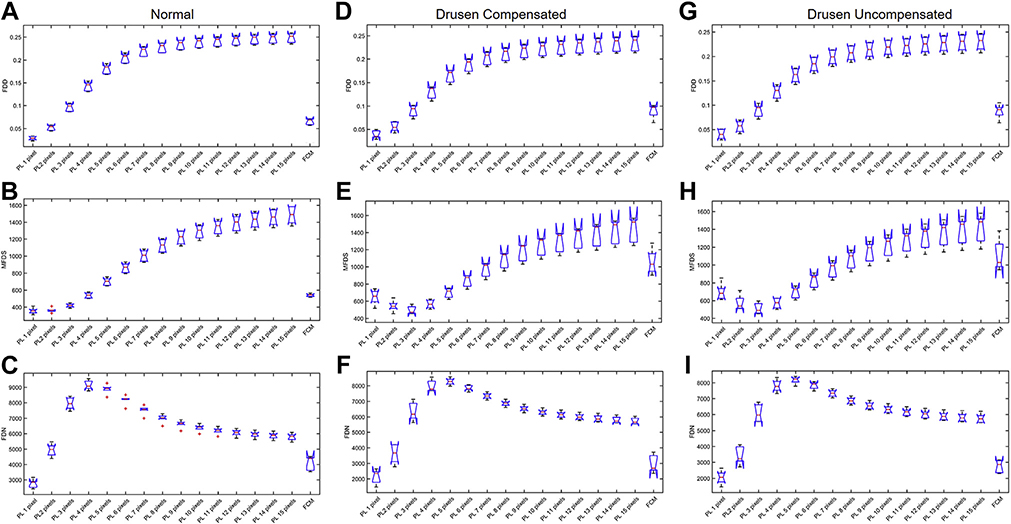
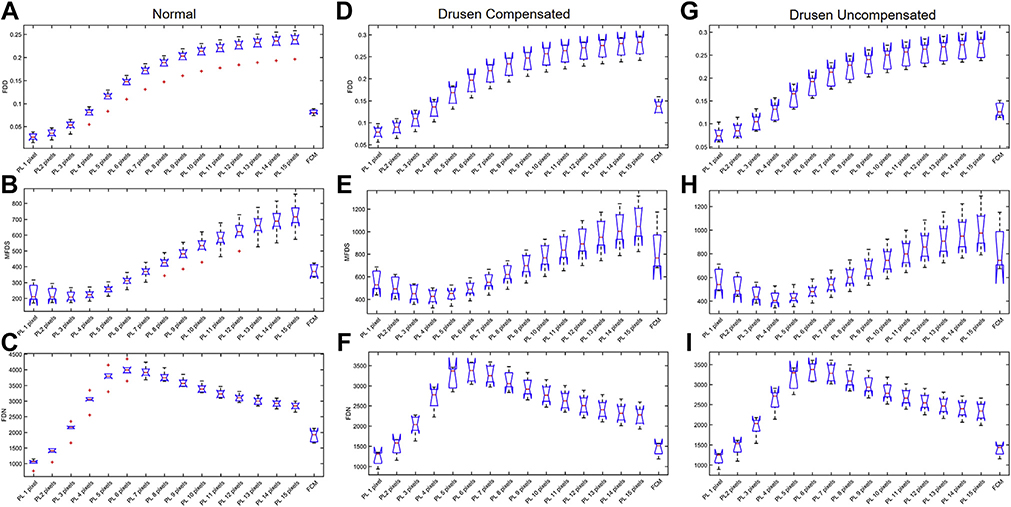
In total, 18 6×6 mm CC images (6 normal images, 6 compensated drusen images, and 6 uncompensated drusen images) and 18 3×3 mm CC images (6 normal images, 6 compensated drusen images, and 6 uncompensated drusen images) were quantitatively analyzed for FDD, FDN, and MFDS. Results from all cases are shown in Figure 9 (6×6 mm images) and Figure 10 (3×3 mm images). In Figure 9, panels A, B, and C are the boxplots of FDD, MFDS, and FDN of all normal subjects, respectively. Panels D, E, and F are the boxplots of FDD, MFDS, and FDN of all drusen subjects with compensation. Panels G, H, and I are the boxplots of FDD, MFDS, and FDN of all drusen subjects without compensation. In each panel, each boxplot represents a specific binarization method. From left to right, the methods are the Phansalkar method using from 1 to 15 pixel window radii and the last one is the FCM method. Figure 10 is organized the same way as Figure 9 but represents all 3×3 mm CC images. From both the 3×3 mm and 6×6 mm images, as the window radii increase, the Phansalkar method yields increasing FDD, decreasing then increasing MFDS, and increasing then decreasing FDN.
FIGURE 9.
Comparison of different choriocapillaris (CC) measurements obtained by using different thresholding techniques on a 6×6 mm scan obtained from normal eyes and eyes with drusen with and without compensation. In each plot, the results from the Phansalkar local thresholding method (PL) using a range of window radii from 1 to 15 pixels are compared with the fuzzy C-means (FCM) method. The box plots correspond to flow deficit densities (FDDs) (A, D, and G), mean flow deficit sizes (MFDSs) (B, E, and H), and flow deficit numbers (FDNs) (C, F, and I) from 6×6 mm scans using different thresholding techniques in normal subjects (A through C), drusen subjects with compensation (D through F), and drusen subjects without compensation (G through I).
FIGURE 10.
Comparison of different choriocapillaris (CC) measurements obtained by using different thresholding techniques on a 3×3 mm scan obtained from normal eyes and eyes with drusen with and without compensation. In each plot, the results from the Phansalkar local thresholding method (PL) using a range of window radii from 1 to 15 pixels are compared with the fuzzy C-means (FCM) method. The box plots correspond to flow deficit densities (FDDs) (A, D, and G), mean flow deficit sizes (MFDSs) (B, E, and H), and flow deficit numbers (FDNs) (C, F, and I) from 6×6 mm scans using different thresholding techniques in normal subjects (A through C), drusen subjects with compensation (D through F), and drusen subjects without compensation (G through I).
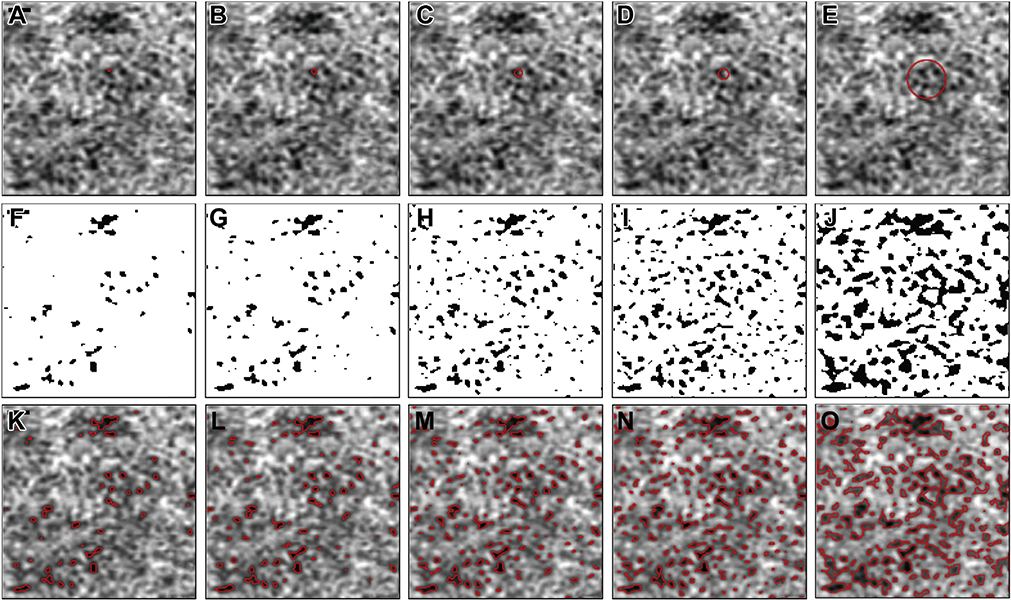
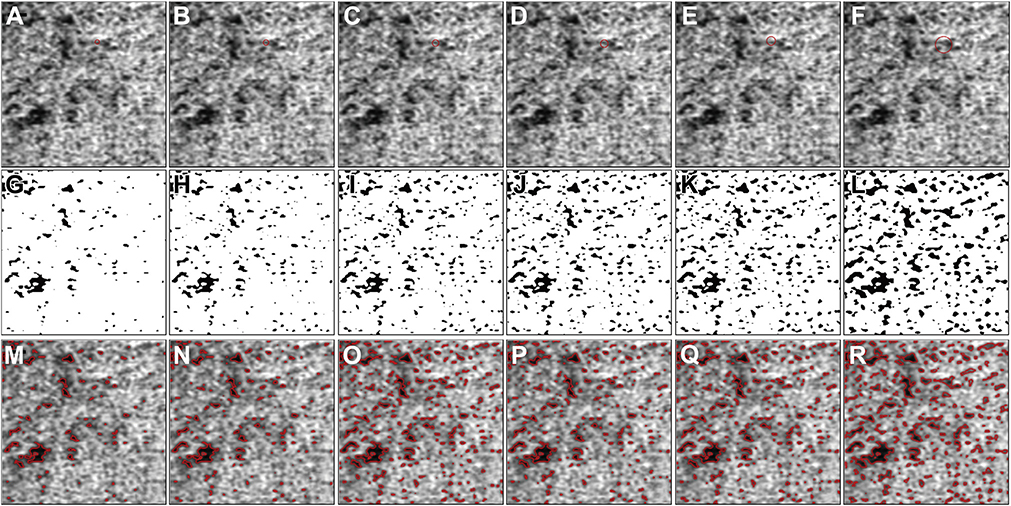
As described in the methods section, the specific implementation of the local window in the Phansalkar method with ImageJ uses a circle centered at each pixel. With the default image size setting from PlexElite (1024 × 1024 pixels for both the 3×3 mm and 6×6 mm images), the relationship of a window radius in pixels to window diameter in microns are shown in Table 1. Figure 11 shows a specific example of how large such windows (1–4 and 15 pixels) appear on a 6×6 mm OCTA CC image, and Figure 12 shows an example of how large such windows (4–8 and 15 pixels) appear on a 3×3 mm OCTA CC image. In both figures, the first row shows OCTA CC images with a red circle indicating how large the actual window is. The second row shows corresponding binarized CC images. The third row shows the overlay of detected CC FDs (red boundaries) with the SS-OCTA images. It can be visually appreciated from both figures that increasing FDs are detected with the increasing window radii. At a window radius of 15 pixels, neighboring FDs are connected into larger ones, which explains why the Phansalkar method results in increasing MFDS and decreasing FDN as the window radii increase.
TABLE 1.
Local Window Diameter with Corresponding Radius in Both 3- × 3-mm and 6- × 6-mm Scans, Assuming 1024 × 1024 Pixels as the Manufacturer’s Default Setting
| Window Diameter, μm |
||
|---|---|---|
| Window Radius, Pixels | 3×3 mm | 6×6 mm |
| 1 | 8.79 | 17.58 |
| 2 | 14.65 | 29.30 |
| 3 | 20.51 | 41.02 |
| 4 | 26.37 | 52.73 |
| 5 | 32.23 | 64.45 |
| 6 | 38.09 | 76.17 |
| 7 | 43.95 | 87.89 |
| 8 | 49.80 | 99.61 |
| 9 | 55.66 | 111.33 |
| 10 | 61.52 | 123.05 |
| 11 | 67.38 | 134.77 |
| 12 | 73.24 | 146.48 |
| 13 | 79.10 | 158.20 |
| 14 | 84.96 | 169.92 |
| 15 | 90.82 | 181.64 |
FIGURE 11.
The effect of choosing different window radii in the Phansalkar local thresholding method for 6×6 mm choriocapillaris ept source optical coherence tomography angiography (SS-OCTA) images. (A through E) Cropped 6×6 mm CC SS-OCTA images with red circles representing a local window with radii of 1, 2, 3, 4, and 15 pixels, which correspond to circles with 29.30 μm, 41.02 μm, 52.73 μm, and 181.64 μm diameters. (F through J) Corresponding binarized CC images with a local window radius of 1, 2, 3, 4, and 15 pixels, which correspond to circles with 29.30 μm, 41.02 μm, 52.73 μm, and 181.64 μm diameters. (K through O) The overlay of detected CC FDs from panels F and G represented as red lines on the corresponding SS-OCTA CC images from parts A through E. Scale bar = 100 μm.
FIGURE 12.
The effect of choosing different window radii in the Phansalkar local thresholding method for 3×3 mm choriocapillaris (CC) swept source optical coherence tomography angiography (SS-OCTA) images. (A through F) Cropped 3×3 mm CC OCTA image with red circles representing a local window with radii of 4, 5, 6, 7, 8, and 15 pixels, which correspond to circles with 26.37 μm, 32.23 μm, 38.09 μm, 43.95 μm, 49.80 μm, and 90.82 μm diameters. (G through L) Corresponding binarized CC images with a local window radius of 4, 5, 6, 7, 8, and 15 pixels, which correspond to circles with 26.37 μm, 32.23 μm, 38.09 μm, 43.95 μm, 49.80 μm, and 90.82 μm diameters. (M through R) The overlay of detected CC FDs from parts G through K represented as red lines on the corresponding SS-OCTA CC images from parts A through F. Scale bar = 100 μm.
DISCUSSION
THE MAIN QUESTION THIS STUDY ADDRESSES IS HOW THE Phansalkar method can be properly used for the segmentation and quantitation of CC FDs. As pointed out in the introduction, many researchers have selected the Phansalkar method to conduct CC binarization. We need to be aware that the Phansalkar method was originally introduced to segment nuclei in cytologic and histologic images, where local thresholding is preferred because of the common presence of uneven staining. This method is an improvement of Sauvola local thresholding31 for cytologic images because Phansalkar added an additional term (mean * p * e−1*mean) to cope with the low contrast of cytologic images. In the Phansalkar method, there are 5 parameters that can be varied: p, q, k, r, and the local window radius R. The parameters p and q are set with default values of 2 and 10 in ImageJ, which cannot be changed by users. Parameters k and r are set as default values of 0.25 and 0.5, but users can change them. These values were recommended by Phansalkar for cytologic images.37 The default local window radius R is 15 pixels, which can be changed by users. Theoretically speaking, the purpose of using a local window for thresholding is to mitigate the effects of uneven illumination; therefore, the smaller the window size, the better the binarization results, as long as the window is big enough to cover both the background and foreground.24,25 In the case of using the Phansalkar method for CC segmentation, the majority of users have selected the default radius of 15 pixels in their studies, regardless of their actual OCTA image size in pixels and millimeters.
In this study, we show that when the Phansalkar method is used, different FD segmentations and CC metrics are obtained when using different local window radii while keeping the settings fixed for the parameters of p, q, k, and r. As the radius R increases, the window used for threshold calculation becomes larger, leading to more pixels being included for threshold calculation. As a result, the differences in threshold of neighboring pixels becomes smaller. Visually, the increase of the window radius R makes the threshold images appear blurrier (Figures 3 and 6). Correspondingly, the binarization images (Figures 4 and 7) showed a more homogenous appearance of CC FDs. The histogram analyses also demonstrated that with a larger window radius, the pixel values in the CC vasculature group and CC FDs group have larger overlap (Figures 5 and 8).
Furthermore, FDD, MFDS, and FDN (Figures 9 and 10) also changed with different radius R choices. As the radius R increases, more FDs are detected. As the radius R increases even further, nearby FDs start to connect with each other. As the nearby FDs start to connect with each other, the FDs start to become artificially larger. These artificially larger FDs represent false positive FDs because of the increasing radius used when the Phansalkar thresholding method is applied (Supplemental Video 1 [a normal eye] and Supplemental Video 2 [a drusen eye] available at AJO.com). This explains why the FDN value in both 3×3 mm and 6×6 mm scans initially increase and then decrease, and why the MFDS decreases and then increases. On the other hand, FDD showed a steady increase in both 3×3 mm and 6×6 mm scans. In Supplemental Videos 1 and 2, window radii of 1 to 50 pixels were tested, and Supplemental Figures 1 and 2 (available online at AJO.com) show the increase and then plateau for the FDD.
The results presented here suggest that with the digitized image of 1024 × 1024 pixels, a window radius choice of 15 pixels is not an appropriate choice for the segmentation of CC FDs, regardless of the physical image size. As discussed earlier, the choice of a window radius needs to be carefully considered in terms of physical size. The actual window used in ImageJ is a circle with chosen radius centered at each pixel. Therefore, the actual diameter of the circle is 2 times the radius plus 1 pixel. Table 1 shows the window diameter in microns and the corresponding radius in pixels. Theoretically speaking, the optimal window size should cover both foreground and background, which would be a vessel and a FD for the CC network.24,25 The ICD is defined as the average distance from the center of one capillary to another, which covers a whole vessel width and a whole FD width. Therefore, when segmenting the CC FDs with local thresholding, a window diameter similar to the physiological ICD would be able to cover both foreground and background. An appropriate window diameter should be larger than the ICD, so it covers both vasculature and FDs, but not too large to be adversely affected by illumination. Previously, our group has used the power spectrum analysis to calculate the averaged ICD in averaged CC images and reported a value of 23.17 μm (95% confidence interval 21.05–25.28 μm) under the fovea for 3×3 mm PlexElite SS-OCTA images.10 Therefore, we believe that a window diameter of 1 to 2 times ICD should be the optimal choice of the window size when using the Phansalkar method. It should be noted that there have been other reports on specific values for the ICD. Using adaptive optics OCTA, Kurokawa and associates34 have reported an ICD value from 1 single healthy subject around ~39 μm. Marsh-Armstrong and associates38 have also reported CC quantitative metrics using a 1.6 MHz SS-OCTA system. They did not directly report ICD, but reported the averaged FD radius of 9.8 mm and an averaged vessel radius of 5.0 μm, which would infer an averaged ICD at ~29.6 μm for 5 healthy subjects. Zhou and associates16 used a high-resolution 200 KHz SS-OCTA system and reported an averaged ICD of 24.4 μm from 4 healthy subjects, consistent with the PlexElite SS-OCTA data. All 3 groups used different OCTA systems, used different scanning patterns, imaged different subjects, and reported slightly different but comparable ICD values. In this study, we selected the ICD value we reported before as a reference because the data used in this study were acquired using the same SS-OCTA system. Therefore, a diameter of 1 to 2 times ICD converted to a radius in pixels should be approximately 2 to 4 pixels for 6×6 mm scans and 4 to 8 pixels for 3×3 mm scans, assuming images of 1024 × 1024 pixels. Of note, if a window is set too small, then there would be not enough pixels included in the threshold evaluation. As a result, some FDs could be left unsegmented (Figure 11, A, F, and K). On the other hand, if a window is too large, it could lead to oversegmentation of FDs, resulting in individual FDs merging into larger ones and yielding erroneous results (Figure 11, E, J, and O, and Figure 12, F, L, and R). However, the best qualitative strategy to demonstrate that the radius range is reasonable is to simply compare the CC flow image obtained from the instrument with the binarized image after applying the FCM method or the Phansalkar method. It is always reassuring to observe that the qualitative appearance of flow and FDs on the CC images before thresholding looks similar to the image after thresholding. That has been our experience when using a Phansalkar window radius of 2 to 4 pixels for 6×6 mm scans and 4 to 8 pixels for 3×3 mm scans, assuming an image measuring 1024 × 1024 pixels. On the other hand, using a Phansalkar window radius of 15 pixels, the qualitative appearance of the flow and FDs on the CC images before thresholding tend to appear somewhat different from the images after thresholding.
It should also be noted that there are 2 other parameters that can be changed and optimized for CC FDs segmentation in the Phansalkar method. These are k and r, which appear as Parameter 1 and Parameter 2 in ImageJ, respectively. Parameter 2 is a normalization term and should be the dynamic range of standard deviation, which is 0.5 for normalized images. Of note, in ImageJ, all images are automatically normalized to 0 to 1 in the implementation of the Phansalkar method. Since the distribution of values in OCTA CC images is close to Gaussian, it is probably not meaningful to vary this parameter. Parameter 1, k, decides how much of a role the standard deviation plays in the determination of threshold. This parameter could be changed to optimize CC FD segmentation (Supplemental Figure 3, available online at AJO.com) and we encourage other researchers to explore what parameters works best for their specific datasets. Parameters p and q cannot be varied in ImageJ.
Another question we asked in this study is whether local thresholding is necessary for CC FD segmentation. In the case of OCTA CC imaging, we found that it depends on whether the “uneven illumination” in the image was actually caused by uneven illumination, such as the patches of lower CC OCTA signal being caused by RPE/BM complex abnormalities leading to signal attenuation, or by actual loss of CC flow. Based on our experiences, the answer is mostly “both.” For example, Figure 2 represents a subject with drusen and Supplemental Figure 4 uses a Gaussian filter to reveal the “local illumination” of such OCTA CC images. Lower local signal intensity revealed by Gaussian blurring within the drusen boundary (Supplemental Figure 4, G, available online at AJO.com) could be explained by an abnormal RPE/BM complex, especially when the signal increases after the compensation strategy (Supplemental Figure 4, F). However, patches of lower CC OCTA signal outside of drusen boundary are caused by pathological CC loss. Local thresholding methods would treat these regions inside and outside drusen boundary the same. It is our strong recommendation that a signal attenuation compensation strategy should be always used in such situations, regardless of whether it is combined with either local or global thresholding techniques.
This study is not without limitations. First, there is no ground truth for the CC segmentation. It is unfortunately difficult to make precise judgments on how well a segmentation algorithm performs without access to independent and true measurements of CC vasculature and FDs. As discussed before, such ground truth beyond the reach of commercially available OCT systems because of limited lateral resolution. Future studies using higher speed and higher lateral resolution SS-OCTA systems16,38 are certainly warranted. Second, we have a limited sample size. We have only tested CC OCTA images from 6 normal eyes and 6 drusen eyes, and there are many other diseases of interest that we did not test because of the limited scope of this paper. Finally, we did not discuss the possibility of using an adaptive window for the Phansalkar method because it is beyond the scope of this study. Again, future studies are certainly warranted to explore such possibilities.
In summary, we have used clinically acquired OCTA CC data to demonstrate the risks associated with using the Phansalkar method to perform CC FD segmentation. We suggest other researchers make thorough deliberations before selecting a strategy for CC FD segmentation. If the Phansalkar method is selected to conduct CC FD segmentation, we suggest careful considerations when optimizing its parameters, especially the local window radius, before conducting any further analyses.
Supplementary Material
Acknowledgments
ALL AUTHORS HAVE COMPLETED AND SUBMITTED THE ICMJE FORM FOR DISCLOSURE OF POTENTIAL CONFLICTS OF INTEREST.
Funding/Support: Supported by grants from the National Eye Institute, United States (R01EY024158 and R01EY028753), the Salah Foundation, Carl Zeiss Meditec, an unrestricted grant from the Research to Prevent Blindness, Inc. (New York, NY), and the National Eye Institute Center Core Grant, United States (P30EY014801) to the Department of Ophthalmology, University of Miami Miller School of Medicine, United States. The funding organization had no role in the design or conduct of this research. Financial Disclosures: Drs Gregori, Wang, and Rosenfeld received research support from Carl Zeiss Meditec, Inc. Dr Gregori and the University of Miami co-own a patent that is licensed to Carl Zeiss Meditec, Inc. Dr Rosenfeld also receives research funding from Boehringer-Ingelheim and Stealth and is a consultant for Apellis, Boehringer-Ingelheim, Carl Zeiss Meditec, Chengdu Kanghong Biotech, Ocunexus Therapeutics, Genentech, Healios K.K, Hemera Biosciences, F. Hoffmann-La Roche Ltd., Isarna Pharmaceuticals, Ocunexus, Ocudyne, and Unity Biotechnology. He also has equity interest in Apellis, Verana Health, and Ocudyne. Dr Wang discloses intellectual property owned by the Oregon Health and Science University and the University of Washington. Dr Wang also receives research support from Tasso Inc, Moptim Inc, Colgate Palmolive Company, and Facebook technologies LLC. He is a consultant to Insight Photonic Solutions, Kowa, and Carl Zeiss Meditec. The other authors have no disclosures. All authors attest that they meet the current ICMJE criteria for authorship.
Footnotes
Supplemental Material available at AJO.com.
Contributor Information
ZHONGDI CHU, Department of Bioengineering, University of Washington, Seattle, Washington, USA.
YUXUAN CHENG, Department of Bioengineering, University of Washington, Seattle, Washington, USA.
QINQIN ZHANG, Department of Bioengineering, University of Washington, Seattle, Washington, USA.
HAO ZHOU, Department of Bioengineering, University of Washington, Seattle, Washington, USA.
YINING DAI, Department of Bioengineering, University of Washington, Seattle, Washington, USA.
YINGYING SHI, Department of Ophthalmology, Bascom Palmer Eye Institute, University of Miami Miller School of Medicine, Miami, Florida, USA.
GIOVANNI GREGORI, Department of Ophthalmology, Bascom Palmer Eye Institute, University of Miami Miller School of Medicine, Miami, Florida, USA.
PHILIP J. ROSENFELD, Department of Ophthalmology, Bascom Palmer Eye Institute, University of Miami Miller School of Medicine, Miami, Florida, USA
RUIKANG K. WANG, Department of Bioengineering, University of Washington, Seattle, Washington, USA Department of Ophthalmology, University of Washington, Seattle, Washington, USA.
REFERENCES
- 1.Bernstein M, Hollenberg M. Fine structure of the choriocapillaris and retinal capillaries. Invest Ophthalmol Vis Sci 1965; 4(6):1016–1025. [PubMed] [Google Scholar]
- 2.Schmetterer L, Kiel J, eds. Ocular Blood Flow. New York, NY: Springer Science & Business Media; 2012. [Google Scholar]
- 3.Bhutto I, Lutty G. Understanding age-related macular degeneration (AMD): relationships between the photoreceptor/retinal pigment epithelium/Bruch’s membrane/choriocapillaris complex. Mol Aspects Med 2012;33(4):295–317. [DOI] [PMC free article] [PubMed] [Google Scholar]
- 4.Cao J, McLeod DS, Merges CA, Lutty GA. Choriocapillaris degeneration and related pathologic changes in human diabetic eyes. Arch Ophthalmol 1998;116(5):589–597. [DOI] [PubMed] [Google Scholar]
- 5.Herbort C Posterior uveitis: new insights provided by indocyanine green angiography. Eye (Lond) 1998;12(pt 5): 757–759. [DOI] [PubMed] [Google Scholar]
- 6.Spraul CW, Lang GE, Lang GK, Grossniklaus HE. Morphometric changes of the choriocapillaris and the choroidal vasculature in eyes with advanced glaucomatous changes. Vision Res 2002;42(7):923–932. [DOI] [PubMed] [Google Scholar]
- 7.Whitmore SS, Sohn EH, Chirco KR, et al. Complement activation and choriocapillaris loss in early AMD: implications for pathophysiology and therapy. Prog Retin Eye Res 2015; 45:1–29. [DOI] [PMC free article] [PubMed] [Google Scholar]
- 8.Wang RK, Jacques SL, Ma Z, Hurst S, Hanson SR, Gruber A. Three dimensional optical angiography. Opt Express 2007; 15(7):4083–4097. [DOI] [PubMed] [Google Scholar]
- 9.Chu Z, Chen CL, Zhang Q, et al. Complex signal-based optical coherence tomography angiography enables in vivo visualization of choriocapillaris in human choroid. J Biomed Opt 2017;22(12):121705. [DOI] [PMC free article] [PubMed] [Google Scholar]
- 10.Chu Z, Chen Y, Zhang Q, et al. Accurate visualization and quantification of choriocapillaris with swept source OCTA through averaging repeated volume scans. Invest Ophthalmol Vis Sci 2018;59(9):2880.30025134 [Google Scholar]
- 11.Chu Z, Zhang Q, Zhou H, et al. Quantifying choriocapillaris flow deficits using global and localized thresholding methods: a correlation study. Quant Imaging Med Surg 2018;8(11): 1102–1112. [DOI] [PMC free article] [PubMed] [Google Scholar]
- 12.Zhang Q, Shi Y, Zhou H, et al. Accurate estimation of choriocapillaris flow deficits beyond normal intercapillary spacing with swept source OCT angiography. Quant Imaging Med Surg 2018;8(7):658–666. [DOI] [PMC free article] [PubMed] [Google Scholar]
- 13.Zhang Q, Zheng F, Motulsky EH, et al. A novel strategy for quantifying choriocapillaris flow voids using swept-source OCT angiography. Invest Ophthalmol Vis Sci 2018;59(1): 203–211. [DOI] [PMC free article] [PubMed] [Google Scholar]
- 14.Zheng F, Zhang Q, Shi Y, et al. Age-dependent changes in the macular choriocapillaris of normal eyes imaged with swept-source optical coherence tomography angiography. Am J Ophthalmol 2019;200:110–122. [DOI] [PMC free article] [PubMed] [Google Scholar]
- 15.Thulliez M, Zhang Q, Shi Y, et al. Correlations between choriocapillaris flow deficits around geographic atrophy and enlargement rates based on swept-source OCT imaging. Ophthalmol Retina 2019;3(6):478–488. [DOI] [PMC free article] [PubMed] [Google Scholar]
- 16.Zhou K, Song S, Zhang Q, Chu Z, Huang Z, Wang RK. Visualizing choriocapillaris using swept-source optical coherence tomography angiography with various probe beam sizes. Biomed Opt Express 2019;10(6):2847–2860. [DOI] [PMC free article] [PubMed] [Google Scholar]
- 17.Borrelli E, Souied EH, Freund KB, et al. Reduced choriocapillaris flow in eyes with type 3 neovascularization and age-related macular degeneration. Retina 2018;38(10):1968–1976. [DOI] [PubMed] [Google Scholar]
- 18.Spaide RF. Ising model of choriocapillaris flow. Retina 2018; 38(1):79–83. [DOI] [PubMed] [Google Scholar]
- 19.Al-Sheikh M, Falavarjani KG, Pfau M, Uji A, Le PP, Sadda SR. Quantitative features of the choriocapillaris in healthy individuals using swept-source optical coherence tomography angiography. Ophthalmic Surg Lasers Imaging Retina 2017;48(8):623–631. [DOI] [PubMed] [Google Scholar]
- 20.Spaide RF. Choriocapillaris flow features follow a power law distribution: implications for characterization and mechanisms of disease progression. Am J Ophthalmol 2016;170: 58–67. [DOI] [PubMed] [Google Scholar]
- 21.Choi W, Mohler KJ, Potsaid B, et al. Choriocapillaris and choroidal microvasculature imaging with ultrahigh speed OCT angiography. PLoS One 2013;8(12):e81499. [DOI] [PMC free article] [PubMed] [Google Scholar]
- 22.Olver J Functional anatomy of the choroidal circulation: methyl methacrylate casting of human choroid. Eye 1990; 4(2):262–272. [DOI] [PubMed] [Google Scholar]
- 23.Chu Z, Gregori G, Rosenfeld PJ, Wang RK. Quantification of choriocapillaris with optical coherence tomography angiography: a comparison study. Am J Ophthalmol 2019;208:111–123. [DOI] [PMC free article] [PubMed] [Google Scholar]
- 24.Huang Q, Gao W, Cai W. Thresholding technique with adaptive window selection for uneven lighting image. Pattern Recog Lett 2005;26(6):801–808. [Google Scholar]
- 25.Fisher RB, Perkins S, Walker A, Wolfart E. Hypermedia Image Processing Reference. Chichester, United Kingdom: John Wiley & Sons Ltd; 1996. [Google Scholar]
- 26.Sacconi R, Borrelli E, Corbelli E, et al. Quantitative changes in the ageing choriocapillaris as measured by swept source optical coherence tomography angiography. Br J Ophthalmol 2019;103(9):1320–1326. [DOI] [PubMed] [Google Scholar]
- 27.Uji A, Balasubramanian S, Lei J, Baghdasaryan E, Al-Sheikh M, Sadda SR. Choriocapillaris imaging using multiple en face optical coherence tomography angiography image averaging. JAMA Ophthalmol 2017;135(11):1197–1204. [DOI] [PMC free article] [PubMed] [Google Scholar]
- 28.Borrelli E, Shi Y, Uji A, et al. Topographic analysis of the choriocapillaris in intermediate age-related macular degeneration. Am J Ophthalmol 2018;196:34–43. [DOI] [PubMed] [Google Scholar]
- 29.Nassisi M, Shi Y, Fan W, et al. Choriocapillaris impairment around the atrophic lesions in patients with geographic atrophy: a swept-source optical coherence tomography angiography study. Br J Ophthalmol 2019;103(7):911–917. [DOI] [PubMed] [Google Scholar]
- 30.Phansalkar N, More S, Sabale A, Joshi M. Adaptive local thresholding for detection of nuclei in diversity stained cytology images. 2011 International Conference on Communications and Signal Processing: IEEE; 2011;:218–220. [Google Scholar]
- 31.Sauvola J, Pietikainen M. Adaptive document image binarization. Pattern Recog 2000;33(2):225–236. [Google Scholar]
- 32.Carl Zeiss Meditec Website. ZEISS receives the first US FDA Clearance for Swept-Source OCT posterior ocular imaging with PLEX Elite 9000. Available at https://www.zeiss.com/meditec/us/media-and-news/latest-news/-us-fda-clearance-for-swept-source-oct-posterior-ocular-imaging-with-plex-elite-9000.html. Accessed February 17, 2020.
- 33.Yin X, Chao JR, Wang RK. User-guided segmentation for volumetric retinal optical coherence tomography images. J Biomed Opt 2014;19(8):086020. [DOI] [PMC free article] [PubMed] [Google Scholar]
- 34.Kurokawa K, Liu Z, Miller DT. Adaptive optics optical coherence tomography angiography for morphometric analysis of choriocapillaris. Biomed Opt Express 2017;8(3):1803–1822. [DOI] [PMC free article] [PubMed] [Google Scholar]
- 35.Zhang A, Zhang Q, Wang RK. Minimizing projection artifacts for accurate presentation of choroidal neovascularization in OCT micro-angiography. Biomed Opt Express 2015; 6(10):4130–4143. [DOI] [PMC free article] [PubMed] [Google Scholar]
- 36.Chu Z, Zhou H, Cheng Y, Zhang Q, Wang RK. Improving visualization and quantitative assessment of choriocapillaris with swept source OCTA through registration and averaging applicable to clinical systems. Sci Rep 2018;8(1):16826. [DOI] [PMC free article] [PubMed] [Google Scholar]
- 37.Helfrich S, Rueden C, Dietz C, Yang L. Local Phansalkar threshold implementation in ImageJ. GitHub repository. Available at; 2016. https://github.com/imagej/imagej-ops/blob/master/src/main/java/net/imagej/ops/threshold/localPhansalkar/LocalPhansalkarThreshold.java;. Accessed February 17, 2020. [Google Scholar]
- 38.Marsh-Armstrong B, Migacz J, Jonnal R, Werner JS. Automated quantification of choriocapillaris anatomical features in ultrahigh-speed optical coherence tomography angio-grams. Biomed Opt Express 2019;10(10):5337–5350. [DOI] [PMC free article] [PubMed] [Google Scholar]
Associated Data
This section collects any data citations, data availability statements, or supplementary materials included in this article.


