

Abstract
Making high‐quality dopamine (DA)‐producing cells for basic biological or small molecule screening studies is critical for the development of novel therapeutics for disorders of the ventral midbrain. Currently, many ventral midbrain assays have low signal‐to‐noise ratio due to low levels of cellular DA and the rate‐limiting enzyme of DA synthesis, tyrosine hydroxylase (TH), hampering discovery efforts. Using intensively characterized ventral midbrain cells derived from human skin, which demonstrate calcium pacemaking activity and classical electrophysiological properties, we show that an L‐type calcium agonist can significantly increase TH protein levels and DA content and release. Live calcium imaging suggests that it is the immediate influx of calcium occurring simultaneously in all cells that drives this effect. Genome‐wide expression profiling suggests that L‐type calcium channel stimulation has a significant effect on specific genes related to DA synthesis and affects expression of L‐type calcium receptor subunits from the CACNA1 and CACNA2D families. Together, our findings provide an advance in the ability to increase DA and TH levels to improve the accuracy of disease modeling and small molecule screening for disorders of the ventral midbrain, including Parkinson's disease.
Keywords: cell biology, induced pluripotent stem cells (iPSCs), nervous system, neural differentiation, neural induction
Using intensively characterized ventral midbrain cells derived from humans, we show that an L‐type calcium agonist can significantly increase tyrosine hydroxylase protein levels and dopamine release. Genome‐wide expression profiling suggests that L‐type calcium channel stimulation has a significant effect on specific genes related to dopamine synthesis and affects expression of L‐type calcium receptor subunits from the CACNA1 and CACNA2D families.
Significance statement.
A single molecule provides a major boost to both tyrosine hydroxylase and dopamine in stem cell‐derived human ventral midbrain cells.
1. INTRODUCTION
Development of new drugs to treat disorders of the ventral midbrain such as childhood dystonia or Parkinson's disease (PD) is a major undertaking and can involve critical in vitro assays in human cells to assess biological function and toxicology. Currently, the cell types of choice are those either derived from affected human subjects or control cell lines engineered to reflect disease, usually by modifying a gene of interest related to the phenotype, such as TOR1A for childhood onset dystonia.1 To do this, high‐quality human dopamine (DA)‐producing ventral midbrain cells are required.
Ventral midbrain cells are essential for basic biological studies or small molecule screening of potential drugs to treat ventral midbrain diseases. For example in PD, some alpha‐synuclein uptake studies utilize DA‐producing cells in vitro to understand how alpha‐synuclein may selectively damage a ventral midbrain cell.2, 3 Similarly, small molecule screening involves the assessment of hundreds to many thousands of chemical probes to identify a cellular phenotype related to disease. Example of a cellular phenotype might be mitophagy in cells derived from PD patients with mutations in PARKIN,4 with a potential small molecule screen looking for compounds that attenuate mitophagy in mutant PARKIN cells. A heterogeneous population of cells could seriously undermine these basic biological and small molecule screening studies.
Extensive work has gone into making ventral midbrain cells as a potential cell therapy for PD patients. Cell therapy involves the manufacturing and use of cells to replace dead or deficient cells5 and is a promising avenue to treat PD.6, 7, 8 This is exemplified by the clinical trials that will begin in 2019‐2020 in the United States,9 Europe,10 China,11 and Japan.12 One major concern with cell therapy is the potential for heterogeneity of cells used in transplantation13 reflected by the variation in success of the therapy when attempted with fetal cells, where some PD patients eliminated the need for l‐dopa therapy,14 whereas others suffered graft rejection, graft‐induced dyskinesia,15 or unsuccessful grafting and/or no DA production as measured postmortem or via Positron Emission Tomography/Magnetic Resonance Imaging studies.16, 17 A major issue in graft efficacy may be purity of cell populations within the graft, in this case DA‐producing cells of the A9 type.18 For example, contamination with serotonergic/hindbrain cell types has been shown to produce severe side effects.13 Thus, novel in vitro techniques could be a benefit to manufacturing ventral midbrain cells for cell therapy.
There are varied approaches to manufacturing DA‐producing cells. A dual SMAD inhibition approach to create neuroectoderm with simultaneous sonic hedgehog exposure is the most robust approach to date,19 with various tweaks to this including the addition of FGF8b20 or a CORIN selection step.21 Still, subtle changes in dose or time for some molecules can shift cells to a different cell‐type (eg, serotonergic), so very small changes in batch can have severe consequences on cell type, even when the same protocol is followed in the same laboratory.
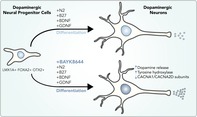
In the current work, we perform extensive quality control steps to assess ventral midbrain cell quality derived from human skin including live calcium imaging and electrophysiology. We report discovery of an L‐type calcium channel agonist which significantly improves both tyrosine hydroxylase (TH) levels and cellular DA content in differentiating ventral midbrain cells, which should prove useful in any assays requiring DA or TH levels as a measurable output.
2. RESULTS
2.1. Making ventral midbrain progenitor cells
To make ventral midbrain cells, we began with a very pure population of induced pluripotent stem cells (iPSCs; Figure 1A and B), where iPSC colonies stained for pluripotency markers, had a normal karyotype, expressed endogenous Yamanaka factors, and could be differentiated into three germ layers. We used a two‐step purification procedure (Figure 1C) in proliferating midbrain progenitors in addition to protocols described previously.19, 20 The novelty of this procedure is a mechanical separation via cell strainer that uses selective adhesion of homotypic cells, thus significantly and rapidly increasing cell purity. We dissociated adherent DA neural progenitor cells (NPCs) and extracted mRNA and measured the expression level of forebrain, midbrain, and hindbrain markers to assess midbrain specificity (Figure 1D). We repeated this experiment with different cells and a different operator, to determine batch‐to‐batch variation (Figure 1D). The pattern of expression of all genes was similar to the first experiment, with good enrichment of midbrain markers. To contextualize both the first and second batches, we generated both forebrain and hindbrain cells from the same iPSCs used in these experiments (Figure 1E). These experiments suggest that our midbrain protocol reproducibly enriches for markers of midbrain cells.
Figure 1.
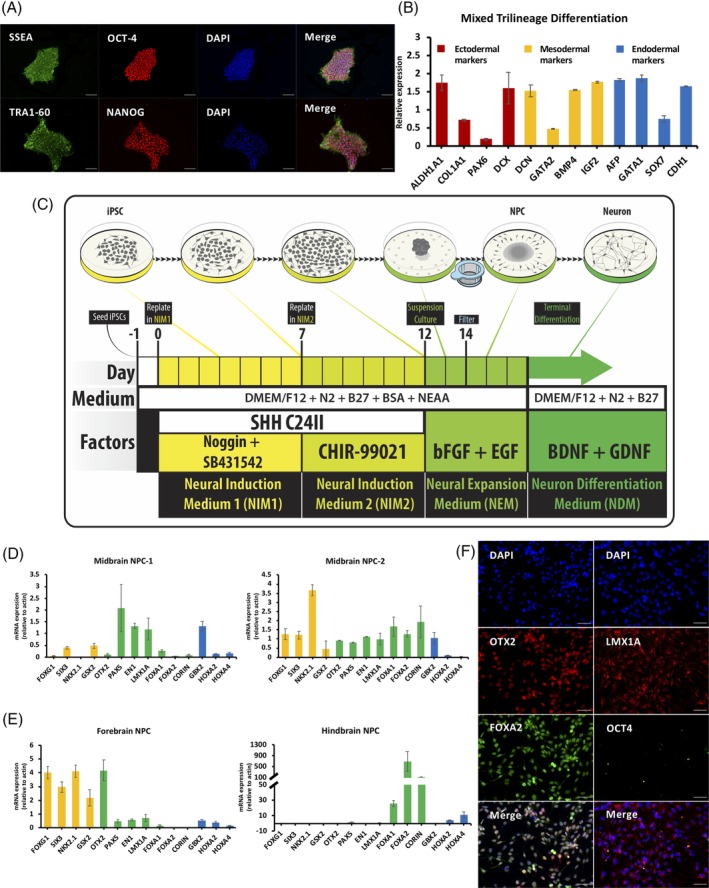
Generation and characterization of ventral midbrain neural progenitor cells. A, Representative immunocytochemistry (ICC) staining for pluripotency markers oct‐4, SSEA, nanog, and TRA1‐60 in iPSCs. Scale bars indicate 50 μm. B, Quantitative polymerase chain reaction (qPCR) analysis of markers for the three germ layers validating the ability of induced pluripotent stem cell (iPSC) differentiating into endodermal, mesodermal, and ectodermal cells. C, Overview of midbrain neural progenitor cell (NPC) and neuron induction procedure from iPSC. D, qPCR analysis showing relative expression of forebrain, hindbrain, and midbrain in midbrain NPCs from two batches. E, Forebrain, midbrain, and hindbrain marker expression in iPSCs induced to forebrain and hindbrain using the same iPSC lines as for midbrain induction. F, ICC staining for midbrain NPC markers showing FOXA2, OTX2, and LMX1A protein expression and inactivation of pluripotency marker (OCT‐4) protein expression. Scale bars indicate 50 μm
We next characterized the protein levels of FOXA2, LMX1A, OCT4, and OTX2 in proliferating midbrain NPCs. We show that all cells were LMX1A‐positive and OCT4‐negative, and all cells were OTX2‐ and FOXA2‐positive (Figure 1F). This is significantly greater than most other protocols that report on average >80% purity at this step, for example, 22 likely due to our selective adhesion step. One observation we made across all lines was that the protein levels of OTX2 and FOXA2, although present in all cells, had notable dynamic range, where some cells expressed high amounts and others low amounts of either marker (Figure 1F). We conclude that our ventral midbrain NPCs are a highly pure population.
2.2. Characterizing differentiating ventral midbrain cells
Levels of TH are nil in progenitor cells but increase as cells differentiate,23 whereas levels of FOXA2 are high in NPCs and decrease but remain expressed at more differentiated time points.24, 25 We reasoned that high‐quality midbrain dopaminergic cells should exhibit these characteristics as cells differentiate; to test this, we assessed the levels of TH and FOXA2 at multiple time points as cells were differentiated from NPCs to more mature neurons. Figure 2A‐C documents the expected effect, whereas immunocytochemical staining for TH after 30 days differentiation confirmed successful TH expression and indicates very homogenous cultures, with little to no contaminating cells (Figure 2D).
Figure 2.
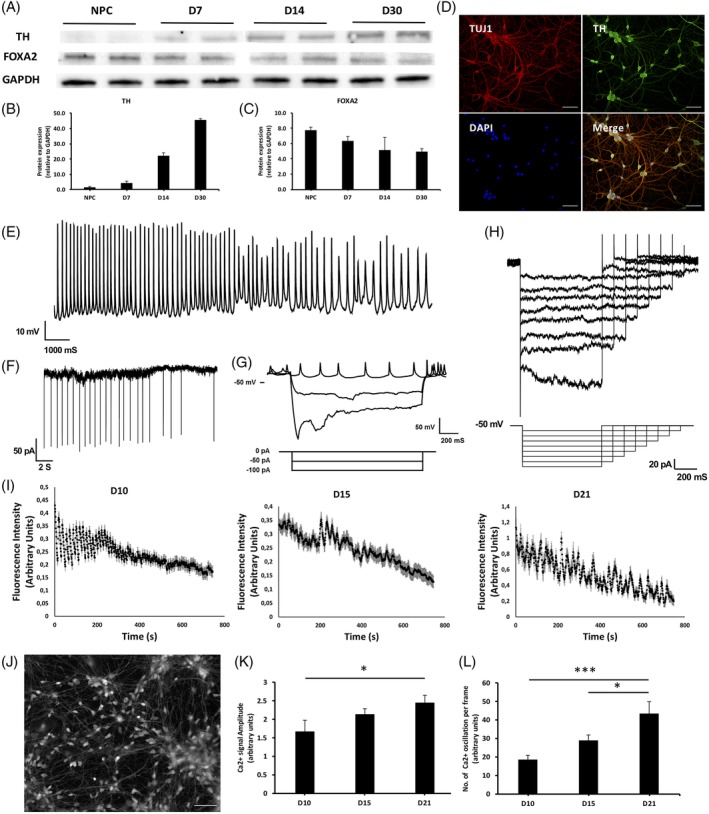
Functional characterization of differentiating ventral midbrain neurons. A, Western blot analysis of TH and FOXA2 expression of midbrain neurons differentiated for 7 days, 14 days and 30 days (n = 2/batch). B, Quantified TH protein expression of D7, D14, and D30 midbrain neurons relative to GAPDH expression (n = 2/batch). C, Quantified FOXA2 protein expression of D7, D14, and D30 midbrain neurons relative to GAPDH expression (n = 2/batch). D, Representative TUJ1 (green) and TH (red) expression in D21 midbrain neurons. Scale bars indicate 50 μm. E, Representative trace of spontaneous action potential with high‐frequency spikes (bursting) of D8 midbrain neuron. F, Representative trace of spontaneous synaptic events of D8 midbrain neuron recorded in voltage clamp configuration. G, Top: Traces generated under current clamp mode showing spontaneous action potential and spike frequency adaptation, and a large voltage depolarizing sag followed by multiple rebound action potentials when neuron hyperpolarized. Bottom: Traces represent the current steps isolated. H, Traces of hyperpolarization activated current (Ih) isolated (between 65 and 125 mV) with hyperpolarizing voltage steps. Cells were held at 55 mV and hyperpolarizing steps applied (bottom traces). I, Spontaneous calcium influx traces of D10, D15, and D21 midbrain neuron using live calcium imaging analysis, showing pacemaking characteristics of midbrain neurons. J, Representative image extracted from live calcium imaging video in Video S1. Scale bars indicate 50 μm. K, Analyzed mean calcium signal intensity in D10 (n = 93), D15 (n = 73), and D21 (n = 24) midbrain neuron live calcium imaging. *P ≤ .05. L, Analyzed mean oscillating calcium signal frequency per frame in D10 (n = 93), D15 (n = 73), and D21 (n = 24) midbrain neuron live calcium imaging. *P ≤ .05, ***P ≤ .001
2.3. Electrophysiological and live calcium flux properties of midbrain dopaminergic cells
Although marker staining in NPCs and differentiating cells is informative, functional properties of ventral midbrain cells are also critical to show a high‐quality cell line. We differentiated NPCs for 8 days and identified spontaneous action potentials (Figure 2E) and excitatory post‐synaptic currents (Figure 2F). Both these traces exemplify characteristics of dopaminergic cells, mostly by their continuous, sustained firing pattern. Dopaminergic neurons fire Action Potentials upon hyperpolarization,26 which we could also detect (Figure 2G). Moreover, these 8‐day midbrain neurons exhibited hyperpolarization activated currents (Ih‐current; Figure 2H),27 another property of ventral midbrain cells. These skin‐derived cells thus exhibit classical functional properties of dopaminergic cells from the ventral midbrain.
Dopaminergic neurons show pacemaker activity27 and can be detected by calcium transients using calcium indicator dyes. We reasoned that assessing spontaneous calcium activity, a core feature of the pacemaking activity of these cells, might be an excellent way to characterize differentiating ventral midbrain cells. To determine differentiation parameters of calcium flux, we differentiated ventral midbrain NPCs for 10, 15, and 21 days and performed live calcium imaging experiments (Figure 2I‐L). At all time points, we observed clear calcium flux in cell cultures ([Link], [Link]), where most cells show sustained spiking but where the signal is lost over time due to dye exposure to light. We observed an interesting developmental effect in these cells whereby the frequency of firing increases over differentiation days (Figure 2K and L). Deeper mathematical analysis of the calcium flux frequency changes over development (Supplementary results in Appendix S1) revealed the so‐called Hopf‐Bifurcation,28 which is the standard process for evolution of robust periodic phenotypes without periodic stimulation out of unstructured or constant activity profiles for a vast amount of nonlinear dynamic systems, including cardiac cells. We were able to identify several cells with correlated firing, suggesting that ventral midbrain cells form subnetworks in vitro (Figure S1).
2.4. Increased TH and DA content in ventral midbrain cells exposed to BAY‐K8644
In a small molecule screening experiment in ventral midbrain cells for an unrelated study that used TH expression as a measurable output, we identified BAY‐K8644, an L‐type calcium channel agonist, as an enhancer of TH expression after 15 days of cell maturation (Figure 3A). Nifedipine, an L‐type calcium channel antagonist which was also included in this screening experiment, did not result in any significant increase or decrease in TH expression. We repeated this result using a different operator and a different batch of cells and again boosted the TH mRNA signal after just 15 days in culture (Figure S2), suggesting that stimulating L‐type calcium channels might improve TH protein and presumably DA content. We repeated the experiment in three different cell batches, and this time extracted protein from 15‐day old cultures and probed for TH via Western blot (Figure 3B). Here, we saw an even more striking effect whereby TH protein was increased by at least 56% ± 12%. Next, to rule out the possibility that this effect is specific to one genetic background, we repeated this experiment using two independent DA NPC lines HJ and AK. Using three replicates per sample, we again found significant increase in BAY‐K8644‐treated cells (Figure 3C), strongly supporting our claim that inclusion of BAY‐K8644 can increase the levels of TH in differentiating midbrain progenitor cells.
Figure 3.
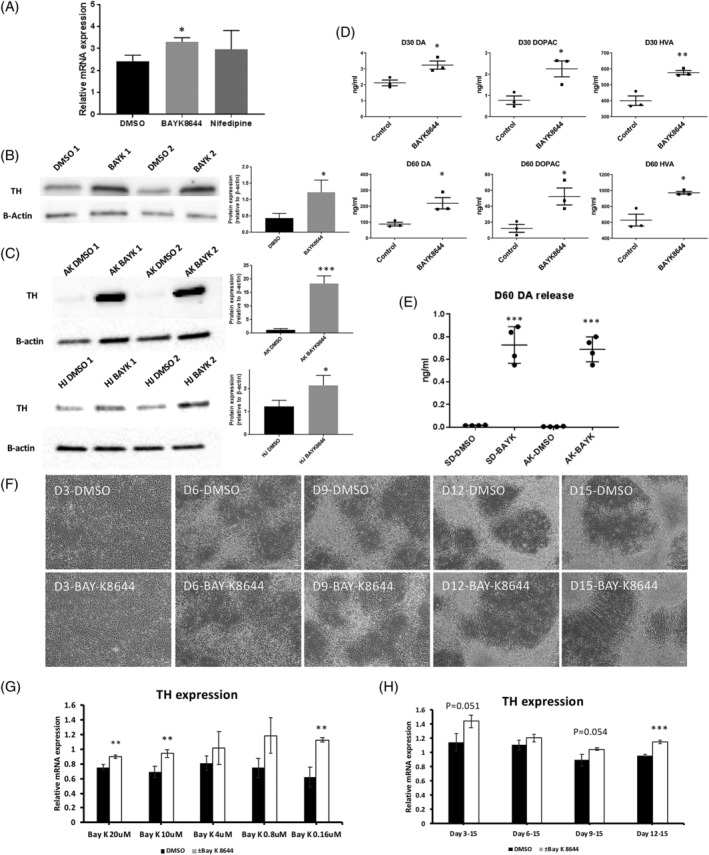
BAY‐K8644 boosts tyrosine hydroxylase (TH) expression and increases dopamine content in ventral midbrain neurons. A, Quantitative polymerase chain reaction (qPCR) analysis showing TH mRNA expression of D15 DA neuron treated with dimethyl sulfoxide (DMSO) (vehicle), 2 μM racemic BAY‐K8644, and nifedipine (n = 3). *P ≤ .05. B, (left) Western blot analysis of TH expression of D15 DA neuron treated with DMSO or BAY‐K8644. (right) Western blot analysis signal were quantified for mean TH expression relative to β‐actin. *P ≤ .05. C, (left) Additional western blot analysis showing 2 additional groups (different genetic background) of D30 DA neurons treated with DMSO or BAY‐K8644 (n = 4); (right) Western blot analysis signal were quantified for mean TH expression relative to β‐actin. *P ≤ .05, ***P ≤ .001. D, High‐performance liquid chromatography (HPLC) analysis of dopamine (DA) production and its downstream catabolites, 3,4‐dihydroxyphenylacetic acid (DOPAC), and homovanillic acid (HVA) in D30 (top) and D60 (bottom) neuron (n = 3). *P ≤ .05, **P ≤ .01. E, HPLC analysis of dopamine release in the culture media of 2 different D60 DA neuron cultures treated with DMSO or BAY‐K8644 after potassium chloride (KCL) stimulation (n = 4). ***P ≤ .001. F, D3, D6, D9, D12, and D15 neurons treated with BAY‐K8644 or DMSO develop similarly with no obvious effects on cell morphology or cell number. Scale bars indicate 50 μm. G, qPCR analysis of TH expression (relative to β‐actin) using mRNA extracted from midbrain neurons treated with different concentrations of BAY‐K8644 (n = 3). **P ≤ .01. H, qPCR analysis of TH expression (relative to β‐actin) using mRNA extracted from BAY‐K8644‐treated midbrain neurons at different developmental time periods (n = 3). ***P ≤ .001
Any increase of TH, the rate‐limiting enzyme in DA production, may be very beneficial for experiments that need to make DA; however, a boost in TH does not mean that cells necessarily produce more DA. To test DA content within cells, we measured DA and its metabolites HVA and DOPAC levels after BAY‐K8644 treatment with high‐performance liquid chromatography (HPLC) after 30 and 60 days maturation (Figure 3D). HPLC analysis showed a highly significant, twofold increase of DA levels in the BAY‐K8644‐treated group after 30 days in culture an effect that rose to a threefold increase after 60 days in culture (Figure 3D). Longer exposure to BAY‐K8644 in differentiating midbrain cells thus increases DA content. Careful monitoring of cells at each media change suggested no gross morphological or cell density changes in D3, D6, D12, and D15 in both experimental groups (Figure 3F). To investigate whether BAY‐K8644 increases DA release, we treated two different cell lines with vehicle or BAY‐K8644 at every media change (every 3 days) as the cells differentiated, where the cells were allowed to rest 5 days prior to the experiment at D60, since BAY‐K8644 can itself induce DA release.29 To induce cell depolarization, we treated cells with KCl then collected media after 15 minutes of incubation (Figure 3E). We found a major increase in DA release in BAY‐K8644‐treated cells compared with vehicle‐treated controls, where we performed this experiment in quadruplicate and on two different genetic backgrounds (P = 4.6 × 10⁻¹⁰). These data suggest that BAY‐K8644 increases TH and dopamine content and that vesicle release machinery is intact.
2.5. Assessing optimal doses of BAY‐K8644 on TH expression levels in ventral midbrain cells
In previous experiments, we used the dose of BAY‐K8644 that we had initially used in the unrelated small molecule screening experiment. To assess the optimal dose to increase TH, we added BAY‐K8644 in varying amounts (20, 10, 4, 0.8, and 0.16 μM) over 15 days maturation then assessed TH expression levels (Figure 3G). Most doses showed significant increases in TH, including in doses 100‐fold smaller than our initial experiment (2 μM), suggesting even a small amount of BAY‐K8644 can boost TH expression. These results suggest even a very low dose of Bay‐K8644 of 0.16 μM is sufficient to increase TH levels.
We next considered whether the effects of BAY‐K8644 required consistent exposure to the chemical throughout maturation, or if they could be induced with a single acute dose (2 μM). Here the results were less clear. We did observe an increase of TH even when BAY‐K8644 was added at the last media change prior to cell harvesting, day 12 (Figure 3H), but there appeared to be increased TH in those cells exposed to BAY‐K8644 9 days earlier in differentiation at day 3, possibly implying that early and continuous inclusion of BAY‐K8644 at 2 μM leads to increased TH, at least when assessing over this short differentiation window. Presumably L‐type calcium channel expression and cell maturation state affect the degree by which BAY‐K8644 can act.
2.6. Functional effects of BAY‐K8644 treatment in ventral midbrain cells
What is the effect of BAY‐K8644 on calcium pacemaker activity in ventral midbrain cells? To answer this question, we turned to live cell imaging to determine acute effects of BAY‐K8644 treatment compared with dimethyl sulfoxide (DMSO)‐treated control cells. First, we found, as expected, that BAY‐K8644 produced a major influx of calcium into cells (Figure 4A), whereas nifedipine did not (Figure 4B), although both led to a blockade of pacemaker activity in cells almost immediately after application of the drug (Videos S4 and S5). As nifedipine does not increase or decrease TH levels, this suggests that it is the acute influx of calcium that might increase TH and DA levels rather than a temporary block of calcium oscillations in cells. We then further investigated how calcium flux affects DA cell electrophysiological properties. There is a significant increase in firing frequency 1 minute after BAY‐K8644 is applied (Figure 4C), and the firing frequency decreases to baseline after wash out. To assess if BAY‐K8644 treatment led to any longer lasting change to electrophysiological properties of midbrain cells, we examined cells exposed to BAY‐K8644 for at least two media changes (6 days) and found a significantly lower resting membrane potential (RMP) in BAY‐K8644‐treated cells (Figure 4D), possibly suggesting a more mature cell (n = 12 BAYK‐8644 cells and n = 20 DMSO‐treated cells). In addition, we also observed depolarizing “sags” in response to hyperpolarizing current injection as early as D7 DA neuron with BAY‐K8644 treatment, a characteristic of mature DA neuron that we only observed in D28 control DA neurons (Figure S3).
Figure 4.
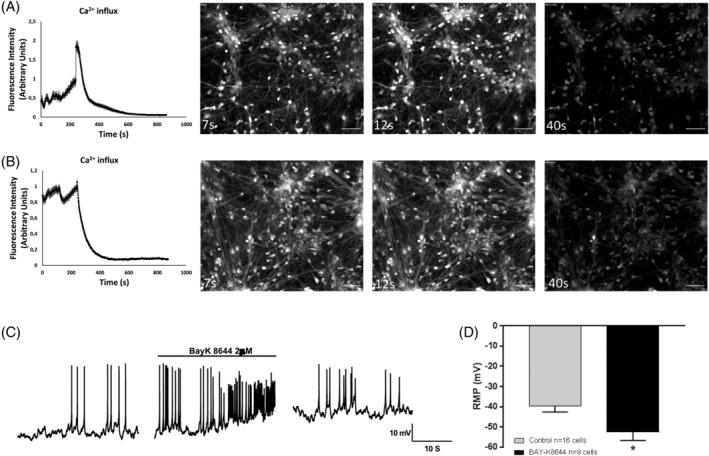
Acute effects of BAY‐K8644 in ventral midbrain neurons. A and B, Extracted images from recorded live Ca2+ imaging of D10 dopamine (DA) neurons treated with (A) BAY‐K8644 (n = 22), an L‐type calcium channel agonist. (B) Nifedipine (n = 92), an L‐type calcium channel antagonist. First image is 7 seconds from application of dimethyl sulfoxide (DMSO) or BAyK‐8644 in D10 neurons, where white color represents amount of calcium in cell represents calcium signal of D10 DA neurons upon DMSO treatment. Second and third images in the series are from 12 and 40 seconds, respectively, after application of DMSO or BAYK‐8644. Scale bars indicate 50 μm. C, Representative trace of acute BAY‐K8644 effect on control DA neurons 7 days after differentiation. D, Effect of chronic BAY‐K8644 treatment on RMP in DA neurons between d7 and d37 after differentiation. Data are presented as mean ± SEM (n = 12 BAYK‐8644 cells and n = 20 DMSO‐treated cells). *P ≤ .05
2.7. Morphological assessments of BAY‐K8644‐treated ventral midbrain cells
Is the increase in DA in the BAY‐K8644 group due to increased TH expression within each DA cell or increased numbers of DA cells? To investigate this, we performed immunostaining on D15 DA neurons with DMSO or BAY‐K8644 treatment. In BAY‐K8644‐treated cultures, we observed more TH+ cells, more intense TH staining, and more complicated projections (Figure 5A and B) than in control‐treated cells, more intense staining in each cell but not necessarily more cells (note nuclear stain, DAPI, are approximately equal). There was a higher intensity of FOXA2 staining in BAY‐K8644‐treated cells as well. We then further differentiated two different batches of cells for 30 days and did another immunostaining reaction, in which we found even more intense overall TH and FOXA2 signal in BAY‐K8644‐treated cultures (Figure 5C‐F, showing two different batches of cells) compared with the DMSO‐treated cultures. We further quantified these images using CellProfiler to quantitatively validate the effect of the BAY‐K8644 treatment on TH and FOXA2 expression (Figure 5G and H). More images from different batches are included in Figure S4.
Figure 5.
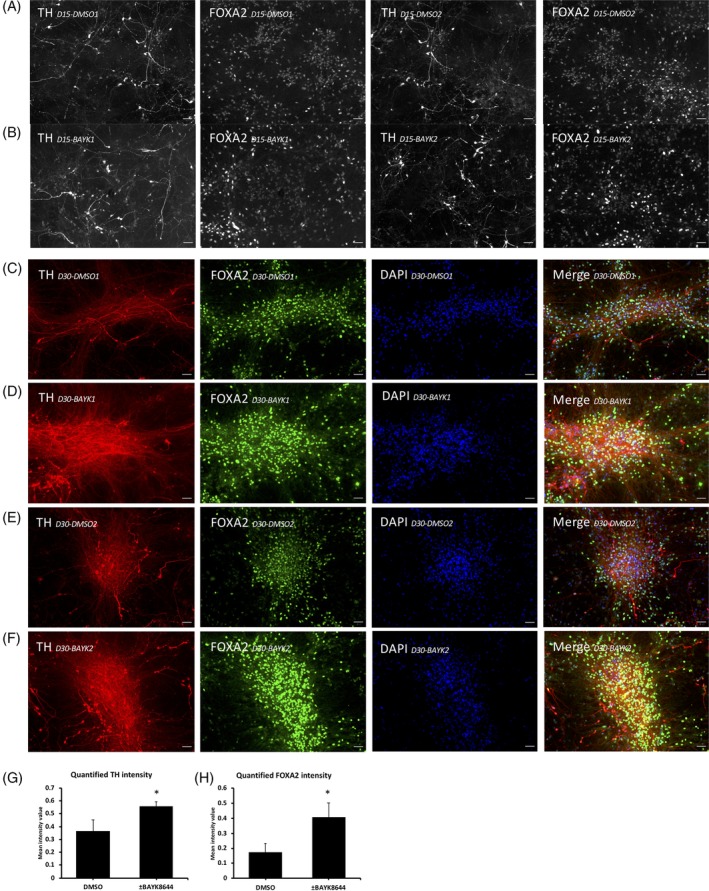
Increased TH and FOXA2 protein in BAY‐K8644‐treated ventral midbrain neurons. A, Immunostaining of TH and FOXA2 expression in dimethyl sulfoxide (DMSO)‐treated D15 dopamine (DA) neuron culture. Scale bars indicate 50 μm. B, Immunostaining of tyrosine hydroxylase (TH) and FOXA2 expression in BAY‐K8644‐treated D15 DA neuron culture. Scale bars indicate 50 μm. C and E, Immunostaining of TH (red) and FOXA2 (green) expression in DMSO‐treated D30 DA neuron cultures. Scale bars indicate 50 μm. D and F, Immunostaining of TH (red) and FOXA2 (green) expression in BAY‐K8644‐treated D30 DA neuron cultures. Scale bars indicate 50 μm. G, Images from each group (n = 3 images of between 150‐200 cells) were analyzed for mean TH intensity per cell in each image. BAY K8644‐treated group has significantly higher TH signal than the DMSO‐treated group. *P ≤ .05. H, Images from each group (n = 3 images of between 150 and 200 cells) were analyzed for mean FOXA2 intensity per cell in each image. BAY K8644‐treated group has significantly higher FOXA2 signal than the DMSO‐treated group. *P ≤ .05
2.8. Assessment of BAY‐K8644 enantiomers on TH expression in ventral midbrain cells
Throughout ICC and all previous experiments, we have used a racemic mixture of BAY‐K8644, as this is reported to have agonist activity on L‐type calcium channels, an effect we confirmed by live calcium imaging and electrophysiology. Still, the mixture contains S‐ and R‐ enantiomers, where R is considered an antagonist. To examine the effects of both enantiomers, we differentiated midbrain neurons for 30 days while treating the cultures with the two BAY‐K8644 using identical procedures and observed a notable increase in TH signal in the S‐BAY‐K8644‐treated culture, and no change in TH signal observed in the R‐BAY‐K8644‐treated culture compared with DMSO‐treated cultures (Figure S5).
2.9. Whole‐transcriptome profiling of BAY‐K8644‐treated ventral midbrain cells
Are cells treated with BAY‐K8644 in a different maturational state or is there a selective increase in the machinery that produces DA? Alternatively, does BAY‐K8644 restrict lineage specification leading to a more homogenous cell type? To assess these questions, we performed RNAseq using cell lines treated with BAY‐K8644 and cell lines treated with DMSO, matured for 15 days. We reasoned that global decreases in genes related to cell proliferation and increases in genes related a more mature cell state, might argue for BAY‐K8644 leading to faster maturation of cells. Also, decreased expression of genes known to define specific cell types might suggest that BAY‐K8644 restricts development to a more DA fate. Both the principle components analysis (PCA; Figure 6A) and the heat map of the differentially expressed genes (Figure 6B) argue that BAY‐K8644‐treated cells are very similar to DMSO‐treated cells, possibly arguing for a specific effect on a small subset of genes rather than increased maturation or different cell types. Or that machinery is present in both treated and untreated cells but is in a more functional state in BAY‐K8644‐treated cells. Figure 6C and D shows the gene ontology (GO) terms associated with those genes that are differentially expressed between conditions. GO terms associated with genes with increased expression in the BAY‐K8644 condition were associated with neuron development, whereas those associated with decreased gene expression were related to protein translation and rRNA metabolism. The small number of differentially expressed genes, the PCA, and the heat map argue for precise effect on a subset of genes. To assess this, we selected genes of obvious interest in dopaminergic cells as well as some genes related to L‐type calcium subunits. Among those genes significantly upregulated genes were TH, LMX1A, and FOXA2, but not other DA markers (no difference in NR4A2, e.g., Figure S6). There was a notable and significant decrease in L‐type calcium channel subunit encoding genes in BAY‐K8644‐treated samples, including the CACNA and CACND families (Figure 6E and F) but not in the CACNG family of auxiliary subunits which interact with voltage‐dependent calcium channels (Figure 6G). Finally, although this study was not done to explicitly address whether BAY‐K8644 could be useful in cell therapy studies which requires GMP conditions, we do note that a single marker of transplanted dopaminergic graft quality (ie, the ability to produce DA in vivo) that was common between two groups,21, 30 DLK1, is increased in BAY‐K8644‐treated cells by approximately 25% (P = .025; Figure S7).
Figure 6.
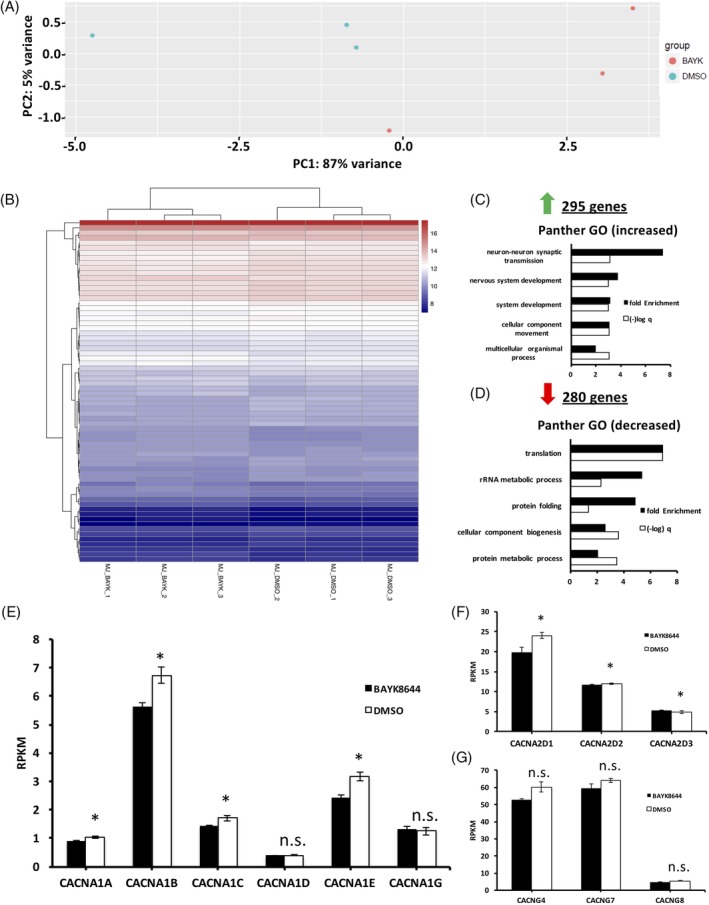
Whole transcriptomic effects of BAY‐K8644 in differentiating ventral midbrain cells. A, Principle component analysis showing highly similar effects of treatment of midbrain dopaminergic neurons with dimethyl sulfoxide (DMSO) and BAY‐K8644 on transcriptomic patterns (n = 3). B, Heat map of the commonly differentially expressed mRNAs in DMSO‐ and BAY‐K8644‐treated D15 midbrain neurons. C, Gene ontology classification of significantly enriched genes upregulated in BAY‐K8644‐treated midbrain neurons. D. Gene ontology classification of significantly enriched genes downregulated in BAY‐K8644‐treated midbrain neurons. E, mRNA expression of L‐type calcium channel subunits in DMSO‐ and BAY‐K8644‐treated groups. (n = 3). *P ≤ .05. F, mRNA expression of voltage gated calcium channel (VGCC) auxiliary alpha2delta subunits in DMSO‐ and BAY‐K8644‐treated groups. (n = 3). *P ≤ .05, N.S., no statistical significance. G, mRNA expression of VGCC auxiliary gamma subunits in DMSO‐ and BAY‐K8644‐treated groups (n = 3). N.S., no statistical significance
3. DISCUSSION
We have demonstrated extensive characterization of ventral midbrain progenitors and differentiating ventral midbrain neurons using electrophysiology and calcium imaging. We discovered that inclusion of an L‐type calcium receptor channel agonist in cell culture media can significantly increase TH and DA content and release in cells, likely to the benefit of any study using these markers as a measurable output.
We demonstrated a two‐step purification protocol, taking advantage of selective removal of NPCs from adherent plates and selective aggregation of NPCs in organoid bodies. The first step takes advantage of a commercially available media, Gentle Cell Dissociation Media from Stem Cell Technologies, which we found to be very useful in purifying NPCs of forebrain, midbrain, or hindbrain. Plating of these detached cells as single cells on nonadherent plates allowed us to further select organoid bodies which further purified NPCs. Some cells continue to attach to the (nonadherent) plates and other cells do not cluster into the floating embryoid body, suggesting these cells are not NPCs. We suspect NPCs release factors or generate membrane‐bound adhesion proteins which may attract other NPCs, thus there is a selective advantage for homogenous cells to cluster together. A major advantage of this purification technique is that one can do it repeatedly on the same NPC line if cell heterogeneity begins to increase.
We characterized calcium flux in differentiating ventral midbrain cells and could show that more mature cells have a higher frequency of firing and form more connected subnetworks. A major advantage to calcium imaging over electrophysiology for the evaluation of cell lines is that many cells can be assessed at the same time. Calcium pacemaking activity is considered a core feature of ventral midbrain cells, thus one can get a reasonably good idea of culture homogeneity and quality with these videos. Precise parameters were not assessed here; however, calcium flux in ventral midbrain cells may become an important quality metric in stem cell derived cells in the future. We highlight in the current work that well‐known electrophysiological properties can be detected after just 8 days differentiation. This should provide for faster quality control assessment in future studies.
The L‐type calcium channel agonist BAY‐K8644 increased TH and DA levels in differentiating ventral midbrain cells. We assessed this via mRNA, protein, and metabolite levels using different doses and time to attempt to make a practical contribution to making ventral midbrain cells. Both BAY‐K8644 and nifedipine led to a loss of calcium pacemaker activity (which presumably restarts after some period of time related to binding affinity and half‐life), and nifedipine was found to have no ability to increase (or decrease) TH levels. Our interpretation of the data are that BAY‐K8644 functions to strengthen connections between cells, and it is the simultaneous calcium influx into all cells on application of BAY‐K8644 that increases cell communication and networking (ie, simultaneous depolarization), allowing a dopaminergic cell network to form. Indeed, L‐type calcium channel agonists are known to trigger burst firing in dopaminergic cells.29 Cells that simultaneously fire together may connect, a phenomenon known as Hebbian synapses. Future experiments might probe precise mechanisms of this effect using other channel blockers with BAY‐K8644 and whether other L‐type calcium channels agonists can induce a similar increase in DA content. Currently, we cannot rule out the idea that simply depolarizing the cells at every media change may have a similar effect. We favor a model whereby it is the simultaneous stimulation and calcium influx, possibly through well‐known second messengers that respond or bind to calcium and which can drive specific cell type effects (eg, calmodulins, calcineurins, calnexins).
These data also revealed a clear effect on the expression on some calcium receptor subunit genes. We found that almost all members of the CACNA131 and CACNA2D32 families had decreased expression after treatment with BAYK‐8644. This suggests that continued treatment of differentiating ventral midbrain cells with BAY‐K8644 will lead to decreased expression of these calcium subunits.
This work characterizes a simple method to significantly boost both TH and DA levels in human‐derived cells. Stimulating L‐type calcium channels in differentiating midbrain cells might be a relatively easy way to increase signal to noise ratios in ventral midbrain assays that use TH or DA content or release as a readout.
4. METHODS
All work in this article was approved by the Research Ethics Board of the Douglas Hospital Research Center.
4.1. Somatic cell reprogramming
Control fibroblasts were obtained from Coriell cell repository, GM07492‐A. Fibroblasts were reprogrammed by transfecting episomal reprogramming vectors containing Oct4, Sox2, Myc3/4, Klf4, and ShRNA P53 (ALSTEM) with a Neon Transfection System (Invitrogen, Burlington). Electroporation was conducted using 2‐3 × 10⁵ cells and 3 μg of episomal vectors for each reaction. Electroporation parameters were as follows: 1650 V, 10 ms, 3 pulses. After transfection, cells were plated on to Matrigel (Corning) coated tissue culture dish in 10% fetal bovine serum (FBS) Dulbecco's modified Eagle's medium (DMEM). After 24 hours, the media was replaced with fresh 10% FBS DMEM with 1 μg/mL puromycin (Sigma‐Aldrich). After 48 hours, the media was replaced with TesR‐E7 (STEMCELL Technologies, Vancouver), with daily media change. iPSC colonies formed into observable sized colonies after 2 weeks culture in TesR‐E7 media. iPSC colonies with desirable size (500‐1000 μm in diameter) were then treated with ReLeSR media (STEMCELL Technologies) and manually picked and replated into new Matrigel‐coated dish and cultured with TesR‐E8 media.
4.2. Quality control of iPSCs
4.2.1. Pluripotency marker expression
iPSC colonies were dissociated using ReLeSR and replated into Matrigel‐coated coverslips containing petri dish or suspension culture dish. Following colony attachment, iPSC colonies were fixed with 4% paraformaldehyde (Sigma‐Aldrich) for 15 minutes, followed with downstream procedure as described in immunofluorescence section.
4.2.2. Trilineage differentiation
Induction of iPSCs into the three germ layer cells was conducted by exposing iPSCs to equal mixture of the STEMdiff Trilineage Ectoderm, Mesoderm, and Endoderm Medium (STEMCELL Technologies). The culture was then allowed to differentiate for 12 days with media changed every 3 days. Afterwards, cells were collected for RNA extraction.
4.2.3. Endogenous marker expression
Total RNA were extracted from healthy growing iPSC culture with extraction and cDNA synthesis procedure described in quantitative polymerase chain reaction section. Amplification of endogenous pluripotent markers expression were conducted using primers listed in Table S1.
4.2.4. Genomic integrity
Each iPSC lines were actively growing in 2 separate Matrigel‐coated tissue culture dish with TesR‐E8 (STEMCELL Technologies) before treated with KaryoMAX Colcemid in two different conditions (10 μL Colcemid/mL of medium for 30 minutes and 15 μL Colcemid/mL of medium for 60 minutes). Afterward, cells were dissociated and treated with hypotonic solution (0.075 M KCL) for 25 minutes. Following, cells were then fixed in prechilled (−20°C) Carnoy's fixative solution and shipped to the SickKids Hospital (Toronto, Canada) to be analyzed by experts in genomic integrity analysis.
4.3. Ventral midbrain induction
iPSCs were cultured in Matrigel‐coated tissue culture dish with TesR‐E8 (STEMCELL Technologies). When 15%‐25% confluence was reached, iPSC culture media was replaced with midbrain Neural Induction (mNIM1) medium 1 (DMEM/F12 supplemented with L‐glutamine [2 mM], N2, B27 supplement, bovine serum albumin [1 mg/mL, ThermoFisher], NEAA [10 mM; ThermoFisher], SB431542 [10 μM; STEMCELL Technologies], noggin [200 ng/mL, GenScript], SHH C24II[200 ng/mL; GenScript], and laminin [1 μg/mL, Sigma‐Aldrich]). The induction medium was replaced with fresh prewarmed mNIM1 every 48 hours. After 1 week, when cells reached maximum confluence, mNIM1 was switched to mNIM2 (DMEM/F12 supplemented with L‐glutamine [2 mM], N2, B27 supplement, bovine serum albumin [1 mg/mL, ThermoFisher], NEAA [10 mM; ThermoFisher], SHH C24II[200 ng/mL; GenScript], CHIR‐99021 [STEMCELL Technologies], and laminin [1 μg/mL, Sigma‐Aldrich]). Cells were cultured in mNIM2 for 5 days, with daily media change. After 5 days, cells were dissociated using Gentle Cell Dissociation Reagent (STEMCELL Technologies) and cultured in low attachment dish for 2 days with STEMDiff Neural progenitor medium (STEMCELL Technologies). Formed aggregates were then plated onto polyornithine‐/laminin‐coated tissue culture dish for midbrain neural progenitor cells (mNPCs) expansion and cultured with the same media. To further differentiate into midbrain neurons, mNPCs were seeded and cultured in polyornithine‐/laminin‐coated tissue culture dish in neural differentiation medium (DMEM/F12 supplemented with L‐glutamine [2 mM], N2, B27 supplement, BDNF [20 ng/mL], GDNF [20 ng/mL], and laminin [1 μg/mL, Sigma‐Aldrich]).
For every 2‐3 passages of NPCs, we conducted purification steps to remove non‐NPC cells. Cultured cells were detached using Gentle Cell Dissociation Reagent and cultured in low attachment dish for at least 2 days. When visible under a 4× magnification bright field microscope, aggregates were selectively filtered using the 40 μm FalconCell Strainer (Fisher Scientific) and replated onto Matrigel‐coated dish with STEMDiff neural progenitor medium.
4.4. BAY‐K8644 treatment
BAY‐K8644 (Tocris Bioscience) was purchased in powder form and dissolved in DMSO (Sigma‐Aldrich) to make a stock concentration of 2 mM. Neural progenitor cells were treated with BAY‐K8644 as they were exposed to neuron induction media for neuron differentiation. NPCs were seeded into polyornithine‐/laminin‐coated tissue culture dish in STEMDiff. After desired cell density was reached, media was replaced with neuron induction media containing 2 μM BAY‐K8644. Media was half‐replaced with fresh neuron induction media containing 4 μM BAY‐K8644 every 3 days until the desired analysis time point.
4.5. Forebrain induction
iPSCs were cultured in Matrigel‐coated tissue culture dish with TesR‐E8 (STEMCELL Technologies). When 15%‐25% confluence was reached, iPSC culture media was replaced with neural induction (NIM1) medium 1 (DMEM/F12 supplemented with L‐glutamine [2 mM], N2, B27 supplement, bovine serum albumin [1 mg/mL, ThermoFisher], NEAA [10 mM; ThermoFisher], SB431542 [10 μM; STEMCELL Technologies], noggin [200 ng/mL, GenScript], and laminin [1 μg/mL, Sigma‐Aldrich]). Afterward, medium was replaced with fresh prewarmed NIM1 after every 48 hours. After 1 week, when cells were reaching maximum confluence, NIM1 was switched to NIM2 (DMEM/F12 supplemented with L‐glutamine [2 mM], N2, B27 supplement, bovine serum albumin [1 mg/mL, ThermoFisher], NEAA [10 mM; ThermoFisher], and laminin [1 μg/mL, Sigma‐Aldrich]). Cells were cultured in NIM2 for 5 days, with daily media change. After 5 days, cells were dissociated using Gentle Cell Dissociation Reagent (STEMCELL Technologies) and cultured in low attachment dishes for 2 days with STEMDiff neural progenitor medium (STEMCELL Technologies). Formed aggregates were then plated onto polyornithine‐/laminin‐coated tissue culture dish for mNPCs expansion and cultured with the same media.
4.6. Hindbrain induction
iPSCs were cultured in Matrigel‐coated tissue culture dish with TesR‐E8 (STEMCELL Technologies). When 15%‐25% confluence was reached, iPSC culture media was replaced with SDC medium (DMEM/F12 supplemented with L‐glutamine [2 mM], N2, B27 supplement, NEAA [10 mM; ThermoFisher], SB431542 [2 μM; STEMCELL Technologies], DMH1 [2 μM, Tocris Bioscience], and CHIR‐99021 [1.4 μM STEMCELL Technologies]). Medium was changed with fresh prewarmed SDC medium every 48 hours. On day 7 of induction, the medium was replaced with SDC + SHH medium (SDC medium supplemented with SHH C24II [1 μg/mL, GenScript]). Medium was changed with fresh prewarmed SDC + SHH medium every day for 7 days. On day 14 of induction, the medium was replaced with SDC + SHH + FGF4 medium (SDC medium supplemented with SHH C24II [1 μg/mL, GenScript] and FGF4 [10 ng/mL, Thermo Fisher Scientific]. Afterward, medium was changed every day with fresh prewarmed SDC + SHH + FGF4 medium for 7 days. On day 21, cells were dissociated using Gentle Cell Dissociation Reagent (STEMCELL Technologies) and cultured in low attachment dish for 2 days with STEMDiff Neural progenitor medium (STEMCELL Technologies). Formed aggregates were then plated onto polyornithine‐/laminin‐coated tissue culture dish for mNPCs expansion and cultured with the same media.
4.7. Immunofluorescence
Cells were washed with phosphate‐buffered saline (PBS), then fixed with 4% paraformaldehyde (Sigma‐Aldrich) on slides for 15 minutes. Samples were permeabilized with 0.5% TX‐100 (Sigma‐Aldrich) in PBS for 15 minutes and then blocked in 0.5% PBS‐BSA for an additional 15 minutes. Primary antibodies were added in appropriate dilutions (Table S2) in PBS and added to samples for overnight. Samples were washed in a 0.5% PBS‐BSA solution containing an appropriate dilution of secondary antibody (Table S2) was added to the samples and incubated for 60 minutes in the dark. Samples were washed with 0.5% BSA and visualized on an Apotome Fluorescent Microscope (Zeiss). Images are analyzed using the ImageJ software.
4.8. Quantitative polymerase chain reaction
RNA samples are extracted using RNeasy mini kit (Qiagen) RNA isolation kit. Reverse transcriptions were done on total RNA fraction in order to obtain cDNA. cDNA synthesis reaction was performed using 40 μL solutions containing 1 μg of total RNA; 0.5 mg random primers, 0.5 mM dNTPs, 0.01 M DTT, and 400 U M‐MLV RT (Carlsbad, California). Quantitative PCR reactions were performed in 384 well plates using a Quant Studio 6 Flex Real time PCR machine (Life Technology).We used a reference pool of cDNA samples to generate a reference sample for final relative expression calculation. Each well included 10 μL of 2X gene expression master mix (2X Power SYBR Green PCR Master Mix, Applied Biosystems), 1 μL of 5 μM primer mix, 2 mL of cDNA and RNAse free water QSP to make up to 20 μL of total mix volume. Beta‐actin was used as an internal control for normalization.
4.9. High‐performance liquid chromatography
Cells were washed with PBS, lysed in perchloric acid, pelleted, and the liquid decanted. Samples were run on an UltiMate 3000 CoulArray HPLC machine. DA, 3.4‐dihydroxyphenylacetic acid, and homovanillic acid concentration were quantified using OpenChrom (https://www.openchrom.net/) software. We used a standard of each compound to assess the concentration of each measured compound. We normalized the results based on protein concentrations.
To measure the DA release in the culture media, cells were differentiated and cultured in 6 cm culture dish for 60 days. On day 60, cells were incubated in the same culture media supplemented with 56 mM KCL for 15 minutes, followed by HPLC analysis as described previously.
4.10. Whole‐cell recordings
For whole‐cell patch‐clamp recordings, individual coverslips containing differentiated human iPSC‐derived neurons were transferred into a heated recording chamber maintained at 37°C and continuously perfused (1 mL/min) with BrainPhys Neuronal Medium (STEMCELL Technologies) bubbled with a mixture of CO2 (5%) and O2 (95%). Whole‐cell patch clamp recordings were obtained using borosilicate pipettes (3‐6 MΩ), filled with intracellular solution that contained the following (in mM): 5 HEPES, 2 KCl, 136 potassium gluconate, 5 EGTA, 5 Mg‐ATP, 8 creatine phosphate, and 0.35 GTP. The pH was adjusted to 7.27 with KOH, and the osmolarity adjusted with distilled water or concentrated potassium gluconate if needed to between 295 and 298 mOsm with an osmometer (Advanced Instruments). After a recording was completed, we corrected the nominal membrane potential in voltage‐ and current‐clamp recordings for the calculated 10‐mV liquid junction potential. All potential values reported reflect this correction. Once whole‐cell recording had been established, neurons were routinely held in voltage clamp at −70 mV except when examining changes in the RMP and rheobase, which was performed in current clamp. To study Ih, a family of hyperpolarizing voltage steps was applied from a holding potential of 50 mV (60‐130 mV in 10 mV increments; the initial step lasted 1650 ms, and each subsequent step was successively shortened by a 100 ms increment to prevent damage to the membrane). The magnitude of Ih at a given potential step was determined as the difference between the initial peak positive current amplitude and the final, steady‐state current for each step. Cells were only studied if they exhibited a stable holding current and access resistance for at least 10 minutes before experimental manipulations. Data were acquired using a Digidata 1550A/ Multiclamp 700B (Axon Instruments) and Clampex 10.5 (Molecular devices). Currents were filtered at 2 kHz and digitized at 20 kHz.
4.11. Immunoblotting
Cells were lysed using RIPA buffer (Sigma) supplemented with complete, EDTA‐free protease inhibitor cocktail (Sigma‐Aldrich). Cell lysates were well mixed and centrifuged at top speed. Protein samples in the supernatant were then isolated from cell debris pellet. Protein concentrations were determined using Pierce BCA protein assay kit (ThermoFisher). Fifteen micrograms of protein were loaded per well in Mini‐PROTEAN TGX stain free precast gels (Bio‐Rad) and were run with 150 V for 30‐35 minutes, before transferred to nitrocellulose membrane using Trans‐Blot Turbo Transfer system (Bio‐Rad). The membranes were blocked in 4% nonfat milk Tris‐buffered Saline with Triton X (TBST) buffer for 30 minutes, followed by incubation in primary antibodies diluted in blocking solution overnight with shaking. Blots were washed thrice with TBST before incubated with respective secondary antibodies diluted in TBST for an hour at room temperature. Blots were washed thrice followed by band visualization using Clarity western ECL blotting substrates (Bio‐Rad). Blots were imaged and analyzed using the ImageLab software. The intensity of target bands was normalized to β‐actin.
4.12. Live cell calcium imaging
4.12.1. Cell culture preparation and fluo4 incubation
5 × 10⁵ cells were seeded in 35 mm MatTek Dishes (MatTek corporation) in the StemDiff Neural progenitor medium and differentiated for 10, 15, or 21 days in BrainPhys medium (STEMCELL Technologies) supplemented with N2, B27 supplement, BDNF, and GDNF(10 ng/μL). At the day of the acquisition, the Fluo4 calcium indicator (ThermoFisher Scientific) was incubated for 30 minutes at a final concentration of 1 μM. Cells were then washed twice for 5 minutes with the differentiation medium before acquisition.
4.12.2. Acquisitions and drug application
Acquisitions were performed using an Axio Observer Z1 Microscope (Zeiss) assisted by the Zen 2 software. Pictures were collected at every 400 milliseconds for 5 minutes, with a correction for defined focus every 30 pictures. At picture 120, a vehicle solution (DMSO) was applied. At picture 240, BAY‐K8644 was applied at a final concentration of 2 μM.
4.12.3. Data processing and statistical analyses
The acquisitions were treated using the Fiji/Image J software. Thresholds were set up to get rid of the empty space. In order to assess (i) spontaneous activities, (ii) BAY‐K8644, or (iii) nifedipine response, we performed a manual segmentation of the cells to define the regions of interest. Data were collected through the particle analysis module. A multiple measurement tool from the region of interest (ROI) manager was used to the measure the mean pixel values of each ROI in each picture of the time stack. Once the data were extracted from the time stack, background was subtracted from every single ROI at every time point. Signal variation is expressed as “∆F/F0,” F0 being the minimal intensity signal for a given region of interest after background subtraction and ∆F being the difference between an intensity signal at a given time point and F0. Regarding the spontaneous activities, the number of periods occurring during the whole time of acquisition for a given stage of differentiation was visually determined by examining individual cell traces. Amplitude of ∆F/F0 variations following BAY‐K8644 applications was monitored in the ROIs and averaged to compare responses between the different stages of differentiation. Statistical comparisons between the differentiation stages were performed through SPSS 20, using an analysis of variance followed by a post hoc t test. The time stacks were JPEG compressed at 20 frames per second to obtain movies.
4.13. Calcium imaging analysis
Three data sets of calcium signaling in neurons each under different stages of differentiation that is, 10, 15, and 21 days were analyzed. Each data set has 93, 73, and 106 calcium signaling regions and 744, 746, and 748 time points of pixel data, respectively (400‐millisecond intervals for 5 minutes). Given two neurons X and Y in a neuron population, the Pearson Correlation Coefficient ρX,Y can be calculated as follows:
Here E is the expectation value and σ is the standard deviation. Correlation coefficients can take values between −1 and 1; 1 indicates strong correlation and −1 strong anticorrelation. Coefficients whose magnitude are between 0.9 and 1.0 indicate variables which can be considered very highly correlated; between 0.7 and 0.9 indicate variables which can be considered highly correlated; between 0.5 and 0.7 indicate variables which can be considered moderately correlated; between 0.3 and 0.5 indicate variables which have a low correlation.; and less than 0.3 have little correlation with each other. With this, we constructed a correlation matrix for each neuron population that is, ρD10, ρD15, and ρD21, respectively.
In order to identify an underlying cooperative spiking dynamics of the developing cells, we decomposed the activity data x i(t) for each cell i and all development days D10, D15, D21 individually into a nonspiking trend component T i(t) and a spiking component S i(t): x i(t) = T i(t) + S i(t), such that S i(t) shows almost zero means along the monitoring time course. The decomposition was performed by means of a Gaussian filter G(t′) = c exp(−λt′2), such that
As the amplitudes of S i(t) showed nonperiodic spiking components as well as a high degree of variability up to monotonic decrease of the amplitudes, we used the autocorrelation function A i(t) of S i(t) in order to analyze the underlying periodic spiking components. In contrast to the original spiking data S i(t), the A i(t) acts an efficient low pass filter revealing the underlying periodicity of the spiking activity of each cell. Moreover, we calculated for each spiking period tp the area under the curve ACi(tp) of S i(t) quantifying the spiking intensity. In order to identify a standard exponential decay of the spiking intensity, we calculated the decay rate di by means of a log‐linear regression on ACi(tp) for all spiking periods observed in each cell individually. All calculations were performed using Matlab (The Mathworks Inc.) version 15.
4.14. RNA sequencing
All library preparation was conducted by technicians at the Genome Quebec Innovation Center in McGill University. Six libraries were run per lane of an Illumina HiSeqV4 2500 flow cell (125 bp paired‐end reads), which produced an average of 40 million reads per library. For bioinformatic processing, we used FASTX‐Toolkit, TopHat15 Bowtie216, and Cufflinks217 with default parameters to preprocess, align, and assemble reads into transcripts, estimate abundance, and test differential expression.
CONFLICT OF INTEREST
A.S. declared employment and research funding from Bayer AG for research on computational methods in biomedicine. The other authors declared no potential conflicts of interest.
AUTHOR CONTRIBUTIONS
M.J., S.B.: generated primary cell‐culture data, wrote the manuscript; H.P., N.H., H.W., H.S., L.M., X.Z., Y.Z., V.M., A.G.: generated primary cell‐culture data; J.‐F.T., Z.A.: performed bioinformatics analyses; J.K., A.S.: performed machine learning analyses on Ca2+ imaging videos; N.M.: provided reagents and support; C.E.: conceived of project and approved final manuscript, provided reagents and support, wrote the manuscript; V.S., G.M., T.M.D., E.A.F.: generated Ca2+ imaging videos; L.A.O. drew illustrative figures.
Supporting information
Appendix S1: Supplementary results
Video S1 Spontaneous calcium flux in midbrain dopaminergic cells differentiated for 10 days
Video S2 Spontaneous calcium flux in midbrain dopaminergic cells differentiated for 15 days
Video S3 Spontaneous calcium flux in midbrain dopaminergic cells differentiated for 21 days
Video S4 Acute effects of BAYK8644 on spontaneous calcium transients in ventral midbrain DA‐producing cells.
Video S5 Acute effects of nifedipine on spontaneous calcium transients in ventral midbrain DA‐producing cells
Jefri M, Bell S, Peng H, et al. Stimulation of L‐type calcium channels increases tyrosine hydroxylase and dopamine in ventral midbrain cells induced from somatic cells. STEM CELLS Translational Medicine. 2020;9:697–712. 10.1002/sctm.18-0180
Malvin Jefri and Scott Bell are co‐first authors.
DATA AVAILABILITY STATEMENT
The data that support the findings of this study are available on request from the corresponding author.
REFERENCES
- 1. Risch NJ, Bressman SB, deLeon D, et al. Segregation analysis of idiopathic torsion dystonia in Ashkenazi Jews suggests autosomal dominant inheritance. Am J Hum Genet. 1990;46(3):533‐538. [PMC free article] [PubMed] [Google Scholar]
- 2. Rodriguez L, Marano MM, Tandon A. Import and export of Misfolded alpha‐Synuclein. Front Neurosci. 2018;12:344. [DOI] [PMC free article] [PubMed] [Google Scholar]
- 3. Peelaerts W, Bousset L, van der Perren A, et al. Alpha‐Synuclein strains cause distinct synucleinopathies after local and systemic administration. Nature. 2015;522(7556):340‐344. [DOI] [PubMed] [Google Scholar]
- 4. Durcan TM, Fon EA. The three ‘P's of mitophagy: PARKIN, PINK1, and post‐translational modifications. Genes Dev. 2015;29(10):989‐999. [DOI] [PMC free article] [PubMed] [Google Scholar]
- 5. Kirouac DC, Zandstra PW. The systematic production of cells for cell therapies. Cell Stem Cell. 2008;3(4):369‐381. [DOI] [PubMed] [Google Scholar]
- 6. Barker RA, Parmar M, Studer L, Takahashi J. Human trials of stem cell‐derived dopamine neurons for Parkinson's disease: Dawn of a new era. Cell Stem Cell. 2017;21(5):569‐573. [DOI] [PubMed] [Google Scholar]
- 7. Kriks S, Shim JW, Piao J, et al. Dopamine neurons derived from human ES cells efficiently engraft in animal models of Parkinson's disease. Nature. 2011;480(7378):547‐551. [DOI] [PMC free article] [PubMed] [Google Scholar]
- 8. Parmar M. Towards stem cell based therapies for Parkinson's disease. Development. 2018;145(1):1‐4. [DOI] [PubMed] [Google Scholar]
- 9. Studer L. Strategies for bringing stem cell‐derived dopamine neurons to the clinic‐the NYSTEM trial. Prog Brain Res. 2017;230:191‐212. [DOI] [PubMed] [Google Scholar]
- 10. Kirkeby A, Parmar M, Barker RA. Strategies for bringing stem cell‐derived dopamine neurons to the clinic: a European approach (STEM‐PD). Prog Brain Res. 2017;230:165‐190. [DOI] [PubMed] [Google Scholar]
- 11. Wang, Y.K. , et al., Human clinical‐grade parthenogenetic ESC‐derived dopaminergic neurons recover locomotive defects of nonhuman primate models of Parkinson's disease. Stem Cell Reports, 2018. 11 171‐182. [DOI] [PMC free article] [PubMed] [Google Scholar]
- 12. Takahashi J. Strategies for bringing stem cell‐derived dopamine neurons to the clinic: the Kyoto trial. Prog Brain Res. 2017;230:213‐226. [DOI] [PubMed] [Google Scholar]
- 13. Politis M, Oertel WH, Wu K, et al. Graft‐induced dyskinesias in Parkinson's disease: high striatal serotonin/dopamine transporter ratio. Mov Disord. 2011;26(11):1997‐2003. [DOI] [PubMed] [Google Scholar]
- 14. Li W, Englund E, Widner H, et al. Extensive graft‐derived dopaminergic innervation is maintained 24 years after transplantation in the degenerating parkinsonian brain. Proc Natl Acad Sci U S A. 2016;113(23):6544‐6549. [DOI] [PMC free article] [PubMed] [Google Scholar]
- 15. Politis M. Dyskinesias after neural transplantation in Parkinson's disease: what do we know and what is next? BMC Med. 2010;8:80. [DOI] [PMC free article] [PubMed] [Google Scholar]
- 16. Barker RA, Parmar M, Kirkeby A, Björklund A, Thompson L, Brundin P. Are stem cell‐based therapies for Parkinson's disease ready for the clinic in 2016? J Parkinsons Dis. 2016;6(1):57‐63. [DOI] [PMC free article] [PubMed] [Google Scholar]
- 17. Barker RA, Drouin‐Ouellet J, Parmar M. Cell‐based therapies for Parkinson disease‐past insights and future potential. Nat Rev Neurol. 2015;11(9):492‐503. [DOI] [PubMed] [Google Scholar]
- 18. Smidt MP, Burbach JP. How to make a mesodiencephalic dopaminergic neuron. Nat Rev Neurosci. 2007;8(1):21‐32. [DOI] [PubMed] [Google Scholar]
- 19. Chambers SM, Fasano CA, Papapetrou EP, Tomishima M, Sadelain M, Studer L. Highly efficient neural conversion of human ES and iPS cells by dual inhibition of SMAD signaling. Nat Biotechnol. 2009;27(3):275‐280. [DOI] [PMC free article] [PubMed] [Google Scholar]
- 20. Nolbrant S, Heuer A, Parmar M, Kirkeby A. Generation of high‐purity human ventral midbrain dopaminergic progenitors for in vitro maturation and intracerebral transplantation. Nat Protoc. 2017;12(9):1962‐1979. [DOI] [PubMed] [Google Scholar]
- 21. Kikuchi T, Morizane A, Doi D, et al. Human iPS cell‐derived dopaminergic neurons function in a primate Parkinson's disease model. Nature. 2017;548(7669):592‐596. [DOI] [PubMed] [Google Scholar]
- 22. Lang C, Campbell KR, Ryan BJ, et al. Single‐cell sequencing of iPSC‐dopamine neurons reconstructs disease progression and identifies HDAC4 as a regulator of Parkinson cell phenotypes. Cell Stem Cell. 2019;24(1):93‐106. e6. [DOI] [PMC free article] [PubMed] [Google Scholar]
- 23. Coyle JT, Axelrod J. Tyrosine hydroxylase in rat brain: developmental characteristics. J Neurochem. 1972;19(4):1117‐1123. [DOI] [PubMed] [Google Scholar]
- 24. Ferri AL et al. Foxa1 and Foxa2 regulate multiple phases of midbrain dopaminergic neuron development in a dosage‐dependent manner. Development. 2007;134(15):2761‐2769. [DOI] [PubMed] [Google Scholar]
- 25. Kittappa R, Chang WW, Awatramani RB, McKay RDG. The foxa2 gene controls the birth and spontaneous degeneration of dopamine neurons in old age. PLoS Biol. 2007;5(12):e325. [DOI] [PMC free article] [PubMed] [Google Scholar]
- 26. Nedergaard S. A Ca2+−independent slow after hyperpolarization in substantia nigra compacta neurons. Neuroscience. 2004;125(4):841‐852. [DOI] [PubMed] [Google Scholar]
- 27. Puopolo M, Raviola E, Bean BP. Roles of subthreshold calcium current and sodium current in spontaneous firing of mouse midbrain dopamine neurons. J Neurosci. 2007;27(3):645‐656. [DOI] [PMC free article] [PubMed] [Google Scholar]
- 28. Tran DX, Sato D, Yochelis A, Weiss JN, Garfinkel A, Qu Z. Bifurcation and chaos in a model of cardiac early after depolarizations. Phys Rev Lett. 2009;102(25):258103. [DOI] [PMC free article] [PubMed] [Google Scholar]
- 29. Liu Y, Dore J, Chen X. Calcium influx through L‐type channels generates protein kinase M to induce burst firing of dopamine cells in the rat ventral tegmental area. J Biol Chem. 2007;282(12):8594‐8603. [DOI] [PubMed] [Google Scholar]
- 30. Kirkeby A, Nolbrant S, Tiklova K, et al. Predictive markers guide differentiation to improve graft outcome in clinical translation of hESC‐based therapy for Parkinson's disease. Cell Stem Cell. 2017;20(1):135‐148. [DOI] [PMC free article] [PubMed] [Google Scholar]
- 31. Lipscombe D, Andrade A. Calcium channel CaVα(1) splice isoforms—tissue specificity and drug action. Curr Mol Pharmacol. 2015;8(1):22‐31. [DOI] [PMC free article] [PubMed] [Google Scholar]
- 32. Davies A, Hendrich J, van Minh AT, Wratten J, Douglas L, Dolphin AC. Functional biology of the alpha(2)delta subunits of voltage‐gated calcium channels. Trends Pharmacol Sci. 2007;28(5):220‐228. [DOI] [PubMed] [Google Scholar]
Associated Data
This section collects any data citations, data availability statements, or supplementary materials included in this article.
Supplementary Materials
Appendix S1: Supplementary results
Video S1 Spontaneous calcium flux in midbrain dopaminergic cells differentiated for 10 days
Video S2 Spontaneous calcium flux in midbrain dopaminergic cells differentiated for 15 days
Video S3 Spontaneous calcium flux in midbrain dopaminergic cells differentiated for 21 days
Video S4 Acute effects of BAYK8644 on spontaneous calcium transients in ventral midbrain DA‐producing cells.
Video S5 Acute effects of nifedipine on spontaneous calcium transients in ventral midbrain DA‐producing cells
Data Availability Statement
The data that support the findings of this study are available on request from the corresponding author.