Abstract
Objective:
The main objective of this study was to investigate which injection pattern led to the best imaging of fascicular compound activity in fast neural EIT of peripheral nerve using an external cylindrical 2x14-electrodes cuff. Specifically, the study addressed the identification of the optimal injection pattern and of the optimal region of the reconstructed volume to image fascicles.
Approach:
The effect of three different measurement protocol features (transversal/longitudinal injection, drive electrode spacing, referencing configuration) over imaging was investigated in simulation with the use of realistic impedance changes and noise levels. Image-based metrics were employed to evaluate the quality of the reconstructions over the reconstruction domain. The optimal electrode addressing protocol suggested by the simulations was validated in vivo on the tibial and peroneal fascicles of rat sciatic peripheral nerves (N=3) against MicroCT reference images.
Main results:
Injecting current transversally, with spacing of ≥4 electrodes apart (≥100°) and single-ring referencing of measurements, led to the best overall localization when reconstructing on the edge of the electrode array closest to the reference. Longitudinal injection protocols led to a higher SNR of the reconstructed image but poorer localization. All in vivo EIT recordings had statistically significant impedance variations (p<0.05). Overall, fascicle center-of-mass (CoM) localization error was estimated at 141±56μm (−26±94μm and 5±29° in radial coordinates). Significant difference was found (p<0.05) between mean angular location of the tibial and peroneal CoMs.
Significance:
This study gives the reader recommendations for performing fast neural EIT of fascicular compound activity using the most effective protocol features.
Keywords: electrical impedance tomography, fast neural, nerve, image reconstruction, Tikhonov
1. Introduction
1.1. General Context
Electrical neuromodulation of peripheral nerves (“electroceuticals”) is a promising tool for relieving various medical conditions (Birmingham et al 2014). Despite being around for decades, it is still in the process of being improved and could benefit from technical advances (materials, device miniaturization, etc.) and progress in the understanding of nerve physiology. In neuromodulation, electrical pulses are delivered by an external device placed around the nerve to generate action potentials and modulate the activity of a given organ in order to restore normal function. One of the most common uses of neuromodulation is in the cervical vagus nerve (Sabbah et al 2011, Vonck et al 2004) as it is relatively accessible for implantation and delivers autonomic innervation to several organs of the body. However, a shortcoming with current autonomic nerve stimulators may be the lack of specificity; at the moment, nerve stimulation is performed indiscriminately with no spatial localization of the delivered electrical current. As the vagus nerve modulates the activity of different organs, this causes a problem of off-target effects (Ben-Menachem 2001). A possible solution to this problem is selective stimulation (Aristovich et al 2019): a method for delivering spatially-targeted electrical stimulation to different regions in the cross-section of the nerve by using a multi-electrode cylindrical nerve cuff. However, this method currently relies on empirical stimulation of different target areas in order to identify the location of specific organ-related activity (e.g. cardiac) in relation to the nerve cuff electrodes.
Electrical Impedance Tomography (EIT) is a non-invasive technique which allows imaging of variations in electrical impedance inside a volume of interest by image reconstruction of transfer impedances collected from external electrodes (Holder 2005). This lacks the spatial resolution of some other tomographic techniques, such as MRI or CT, but has the ability to provide tomographic images of neuronal depolarization over milliseconds in active neural tissue. It may be undertaken with compact and relatively inexpensive hardware, thereby providing continuous or semi-continuous monitoring. One of its biomedical applications, fast neural EIT, has been demonstrated recently as a method for imaging evoked compound activity in the rat sciatic nerve (Aristovich et al 2018).
As such, it is a promising tool for allowing targeted neuromodulation in the vagus nerve (and possibly other nerves) by spatially localizing specialized neuronal activity with no trial-and-error stimulation involved. This would require both technical optimization of peripheral nerve EIT and overcoming specific physiological challenges related to imaging of the vagus nerve.
In this manuscript we address one aspect of technical optimization; specifically, the choice of imaging protocol. Fast neural EIT has been previously performed in rat sciatic nerve with a heuristic prototype data collection strategy. Here, we investigated different approaches in order to determine the strategy which appeared to deliver the best quality images of fascicular compound action potential activity in peripheral nerve. The simulations and experiments described here are, yet again, focused on the rat sciatic nerve; the Discussion section addresses the general validity of our results and the challenges related to moving to imaging of the vagus nerve in the future.
1.2. Background
1.2.1. Fast neural EIT
The term ‘fast neural EIT’ refers to a specific application of EIT, in which neuronal activity is imaged by the detection of small variations in electrical impedance, produced by the opening of neural ion channels during firing. The opening of channels decreases membrane resistivity, which is reflected in a decrease in bulk resistivity of tissue of ~0.1%. This can be detected and imaged using EIT hardware together with averaging over repeated electrically evoked compound action potentials in nerve or physiologically evoked responses in brain. This last step is mandatory at the moment as the averaging process improves signal-to-noise-ratio (SNR) and allows the neural impedance change signal to emerge over noise. Early studies suggested the possibility of imaging neuronal impedance changes by reporting detected neural impedance changes in humans (0.001% at 1Hz with scalp electrodes) (Gilad and Holder 2009), crab nerves (−0.2% at 125 and 175 Hz) (Oh et al 2011), and rat somatosensory cortex (−0.07% at 225Hz) (Oh et al 2011). In following years, fast neural EIT has been demonstrated in brain in both simulation (Aristovich et al 2014) and experiments (Aristovich et al 2016). More recently, fast neural EIT has been extended to imaging compound fascicular activity in rat sciatic nerves (Aristovich et al 2018).
1.2.2. Electrode addressing protocols
EIT images are reconstructed from multiple measurements of transfer impedance. There are several options for the strategy to achieve this. Measurement may be with current injection and recording of voltages or vice versa, and through multiple electrodes simultaneously or stepwise through serial recordings. The most widely used approach which was employed in the early Sheffield Mark 1 system (Brown and Seagar 1987) is serial recording from two pairs of electrodes – constant current is injected through one pair and voltage recorded from another. In the original Sheffield work, current was applied to adjacent electrode pairs of 16 electrodes in a circular ring around the chest and voltages were sequentially recorded from all other available pairs. With all approaches, there is a choice of how to address available electrodes to minimise instrumentation error and achieve optimal reconstructed image quality. The options have been addressed in several modelling and empirical studies.
In a simulation study for EIT of lung ventilation, the best overall electrode placement configuration was in two rings of vertically aligned electrodes (Graham and Adler 2007). The authors concluded that the results apply to any approximately cylindrical medium. In 2011, a modelling study by Adler et al. (Adler et al 2011) concluded that pair drive and measurement patterns over a planar electrode configuration should be separated by over 90°, with spacing of one electrode less than 180° considered optimal based on a distinguishability metric. This study also advocated abandoning the adjacent drive and measurement pattern used in the Sheffield Mark 1 system and subsequently widely used in the lung ventilation EIT community, citing poor performances. In 2016, Wagenaar and Adler (Wagenaar and Adler 2016) conducted an experimental evaluation of different electrode addressing protocols in phantoms and patients, concluding that the best performance is achieved with a “square” protocol, i.e. a protocol including electrode pairs on both the same and a different ring of electrodes.
For imaging in the brain with scalp or epicortical electrodes, our group found it necessary to address widely separated electrodes, in order to improve current penetration (Fabrizi et al 2009). In regard to fast neural EIT for peripheral nerves, studies performed in vivo have used injection patterns of 5-electrodes apart (135°) over a single ring of electrodes (Aristovich et al 2018) and 90° apart across two ring-like electrode arrays (Chapman et al 2019). In 2018, Hope (Hope et al 2018b) reported a simulation study to investigate the optimal EIT electrode pattern for imaging of fascicular compound activity, concluding that transversal patterns yielded higher resolution whereas longitudinal patterns showed more robustness against noise. The same group also reported a modelling study regarding nerve EIT for neural prosthetics control (Hope et al 2018a). Both studies implemented a forward EIT model with anisotropic conductivity. In the present work, we investigated the electrode driving patterns for imaging the impedance changes during the compound action potential in fascicles in peripheral nerve, with a number of technical differences from Hope’s study (discussed in subsection 4.2) and with the inclusion of experimental verification for the estimated optimal pattern.
1.2.3. Prior work and reference peripheral nerve cuff design
The use of fast neural EIT for imaging evoked fascicular compound activity has been previously reported as proof-of-concept by Aristovich et al. (Aristovich et al 2018) in rat sciatic nerves (Section 1.2.1). In this study, activity from fast fibres was evoked by electrical stimulation of individual fascicles using hook electrodes. Bulk conductivity changes generated by the triggered action potentials were then imaged with a custom EIT cuff with 16 platinized electrodes arranged in a ring-like configuration placed over the common part of the nerve. EIT was performed by injecting current over a pair of electrodes and repeating this process for each pair. Averaging over repeated stimulation pulses was required to reduce noise and reach a signal-to-noise ratio (SNR) sufficiently high for successful imaging. A simple cylindrical model of the nerve with uniform baseline conductivity was used, with cuff electrodes placed over the external surface. The forward problem solution was computed using the complete electrode model (CEM) within the UCL PEITS fast parallel forward solver (Jehl et al 2015). Reconstruction was performed by using Tikhonov regularization and a noise-based correction method on a coarse 100k elements voxel mesh of the nerve.
1.3. Purpose
The main purpose of this study was to investigate which drive pattern led to the best imaging of fascicular compound activity in fast neural EIT of peripheral nerve, using an external cylindrical cuff with 2x14 equally spaced electrodes. We investigated the choice of current injection patterns with parallel voltage measurements from all available electrodes with respect to a common reference. We addressed the following questions:
Which injection pattern works best in simulation? On which region of the reconstructed volume is best to image fascicles?
How does the best protocol found in simulation perform in real experiments?
What is the biophysical explanation of these modelling and simulation results?
What are the recommendations for performing fast neural EIT of fascicular compound activity in future studies?
2. Methods
2.1. Experimental Design
The previous in vivo experimental studies for fast neural EIT of the peripheral nerve employed drive patterns of 5-electrodes apart (135°) over a single array of electrodes arranged in a ring configuration (i.e. circumferentially) and 90° apart across two of such electrode arrays. We evaluated the effect of three different protocol features over quality of reconstructed images. This is mainly a simulation study, but experimental data were collected on two occasions:
on 1 nerve at the beginning of the study to justify extension of our original forward model to ensure that simulations had realistic noise.
on 3 nerves as the final step of the study to evaluate the optimized injection pattern.
Only one electrode cuff design was used for both simulations and experiments reported in this work (geometry and manufacturing in Section 2.2).
First, simulated EIT data for fascicle compound activity were generated for a wide set of injection patterns and two referencing schemes starting from realistic assumptions about the impedance variations of nerve fascicles during neuronal activity (Section 2.3). Specifically, a total of 24 different configurations were investigated by combining 6 drive electrode spacing distances with 2 referencing schemes and injecting current transversally or longitudinally. For each of those, 5 conductivity perturbations were simulated at different distances from the centre of the domain, for a total of 120 simulations. Realistic noise was injected into the simulated data with features obtained from a real fast neural EIT experiment. The injected noise only included a fixed component as analysis of preliminary recordings with our system showed no significant component proportional to injected current. Afterwards, conductivity changes were reconstructed from simulated data (Section 2.4) and quantitative metrics were applied to evaluate the quality of the reconstructions at several locations over the reconstruction domain (Section 2.5). The metrics employed in this study were defined to evaluate reconstructed images with a list of priorities functional to nerve EIT. We previously observed different image quality when analysing the cross-sectional images at different positions along the longitudinal axis of the nerve domain (unpublished); for this reason, metrics were assessed independently over each cross-section along the longitudinal axis, i.e. the x-axis.
As the last step, fast neural EIT experiments were performed in vivo on rat sciatic peripheral nerves to empirically validate the optimal electrode addressing protocol suggested by the simulations (Section 2.6). Figure 1 provides a simple workflow for the different stages of the study.
Figure 1.

Workflow of the present optimization study.
2.2. Electrode design, geometry and manufacturing
In this study, simulations and experiments were performed with a new nerve cuff design (Figure 2), presenting the following differences from the previous design reported in subsection 1.2.3:
Two arrays of 14 electrodes – each one arranged in a circumferential ring.
Two reference electrodes placed at the extremities of the cuff – each one of these electrodes covering the whole circumference of the cuff, i.e. is ring-shaped but not an array.
The new cuff geometry was designed to test different measurement referencing arrangements and to test array-to-array current injection. Each electrode on the two arrays was 1x0.14mm in size. Electrodes over each array were equally-spaced, thus radially spaced at ≈25.7°. The distance between electrode arrays was 2mm (gap between centres), and distance between each electrode array and closest reference electrode was 2.2mm (edge-to-edge). The cuff was designed to wrap around a nerve with nominal 1.4mm diameter. Nerve cuffs for validation experiments were manufactured as described in (Chapman et al 2019) with silicone and stainless steel. In experiments, cuff electrodes were coated with PEDOT:pTS, as this material demonstrated better properties compared to platinum for use in EIT measurements (Chapman et al 2019).
Figure 2.
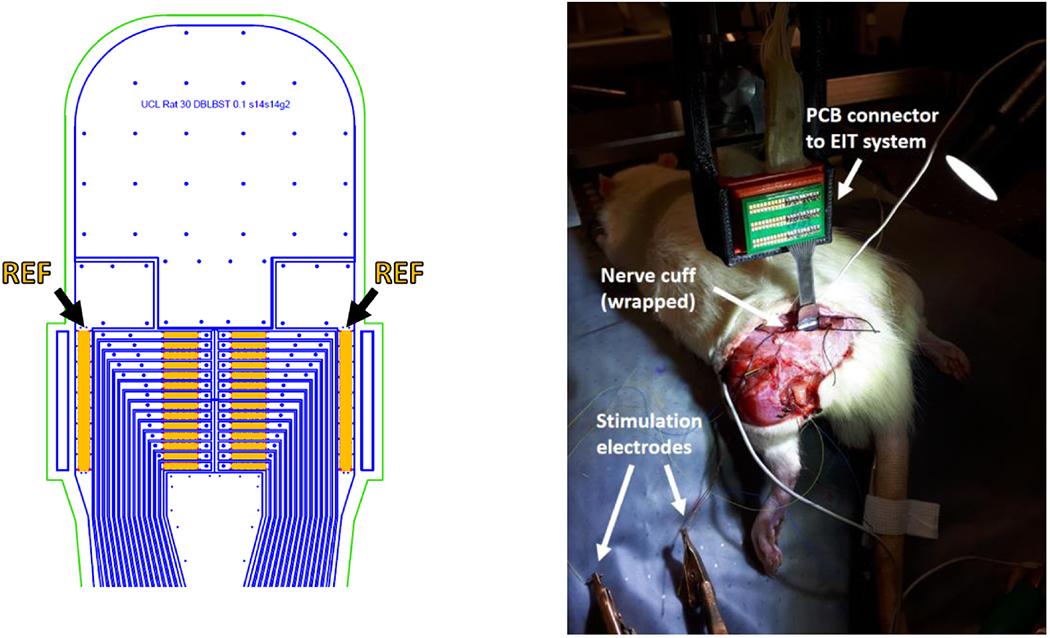
Left: AutoCAD drawing of the top of the nerve cuff with electrodes (orange), outline of stainless steel tracks (blue) and outline of external cuff boundary (green). Arrows and labels indicate reference electrodes. Right: nerve cuff in an experimental setting, wrapped around the rat sciatic nerve.
2.3. Modelling and simulation
2.3.1. Forward problem solution and generation of simulated measurements
The forward problem solution was computed using the complete electrode model (CEM) within the UCL PEITS fast parallel forward solver (Jehl et al 2015). Electrode contact impedance value in the solver was set to 1 KΩ and EIT current was set to 60 μA.
In this study, an extended forward model was used; compared to the basic cylindrical model employed in (Aristovich et al 2018), it included an additional external subdomain largely more conductive that the nerve itself.
The nerve subdomain was 1.4mm in diameter and 10mm long (end-to-end). The external subdomain had a thickness of 1mm (internal to external radii) and was in contact with the nerve cylindrical domain on both extremities, where it was 1mm wide. The external subdomain was insulated on its external boundaries.
The new subdomain was included after observing that the original model simulated boundary voltages (BVs) for longitudinal current injections did not properly correlate with experimental ones. Simulated BVs are the voltage values collected at the electrodes for different injection pairs, in the absence of any time-differential perturbation, and, accordingly, their correlation with experimentally collected BVs is a measure of the agreement of the forward model with reality. The purpose of the new subdomain was to allow electrical current to flow away at the extremities of the nerve domain, thus being a surrogate of the external environment surrounding real nerves and implementing a more realistic forward model. In experimental conditions, the sciatic nerve was not in contact with its surrounding on the lateral surface, and so an unmeshed space where physics was not simulated was left between the nerve and the external subdomain, except for the two extremities of the nerve. This is equivalent to assuming electrical isolation on the external surface of the nerve. The final extended model (Figure 3) was converted to a 2.63M-elements tetrahedral mesh for the purpose of computing the forward solution. The maximum mesh element size was set to 20 μm on the electrodes, 40 μm for the inner nerve region (under and between the electrodes), 60μm for the outer part of the nerve region, and 420μm for the external subdomain. The mesh quality computed according to the Joe-Liu formulation (Liu and Joe 1994) was higher than 0.7 for >99% of the elements. The minimum mesh element quality was 0.47. Background conductivity was set to 0.3 S/m for the nerve subdomain and to 1.5 S/m for the external domain (similar to the conductivity of saline solution).
Figure 3.
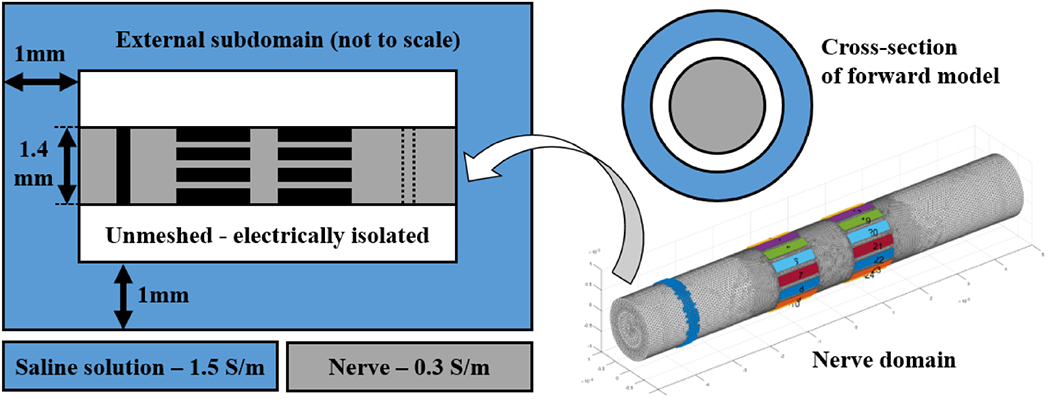
Left: diagram (not to scale) showing the complete forward model, with the nerve subdomain (grey), electrodes (black), and the external environment subdomain (light blue). Internal white volume represents unmeshed zone. An optional second reference ring is shown with a dotted line. Right: Nerve subdomain (grey) of the tetrahedral mesh used in this study for solving the forward model with external reference ring (blue, far left around grey subdomain) and two arrays of electrodes (multiple colours). Top right: cross-section of the forward model diagram.
Solving the forward problem provided a linearized Jacobian matrix J relating conductivity to voltages measured at the electrodes. Simulated measurements were generated according to equation (1), where δV represent linearized small variations in measured voltages in response to small conductivity perturbations δσ. Also in equation (1), VNoise represents noise applied to make simulated measurements more realistic.
| (1) |
Following subsections report details related to the implementation of Equation (1): Matrix J was computed for all combinations of EIT injection patterns and referencing schemes described in subsection 2.3.2, conductivity perturbations δσ were implemented according to subsection 2.3.3 to realistically simulate the effect of fascicular compound activity, and magnitude of VNoise was determined according to experimental noise levels as reported in 2.3.4.
2.3.2. Combinations of injection pairs and referencing schemes
The following features of the injection protocol were investigated:
Transversal or longitudinal current injection: the nerve cuff geometry used in this study allows injection of current on electrodes arranged in a single circumferential array (T, transversal) or between a pair of electrodes positioned on two different electrode rings arrays spaced 2 mm apart (L, longitudinal). Both types of current injection schemes were simulated.
Reference electrode: simulations were performed using a reference electrode for measurements. This can be either a single (S) external circumferential electrode or two electrodes (D, double-ring) in a shunted configuration. Single-ring referencing has been previously used (Aristovich et al 2018). Double-ring referencing, also called tripolar configuration, is common in peripheral nerve recordings (Stein et al 1977, Nielsen et al 2011); however, it is a novel solution for nerve EIT.
Injection electrode spacing: the spacing between the pair of injecting electrodes was also investigated. Spacing of injecting electrode pair from 1 to 6 electrodes apart (1-off to 6-off) was simulated, corresponding to ≈25°-150° angle on the cross-sectional plane. Spacing configurations were tested for both transversal and longitudinal injection types. Longitudinal 0-off configuration, corresponding to injecting current across electrodes positioned at the same angle on two different rings was excluded as it lacks the penetration power for delivering significant current inside the nerve. Small injection spacing angles (e.g. 1-off) will also have low penetration power; however, they were all included to allow a more thorough comparison.
Maximum spacing of 7 electrodes apart was excluded as it would correspond to a full 180 degrees, with the risk of generating symmetry artefacts in the reconstruction. For each simulation, all electrodes on the first array (electrodes 1-14 in Figure 4) are used as the first of a pair during injection. For example, 3-off protocol would be performed over electrodes pairs 1-4, 2-5 and so on in transversal injections, and over 1-18, 2-19, and so on for longitudinal injections.
Thus, the combination of 2 injection types (T/L), 2 referencing schemes (S/D), and 6 injection pair spacing options were tested, for a total of 24 possible configurations (Figure 4). As explained in Experimental Design and in the next subsection, each configuration was evaluated over 5 different perturbations for a total of 120 simulations.
Figure 4.
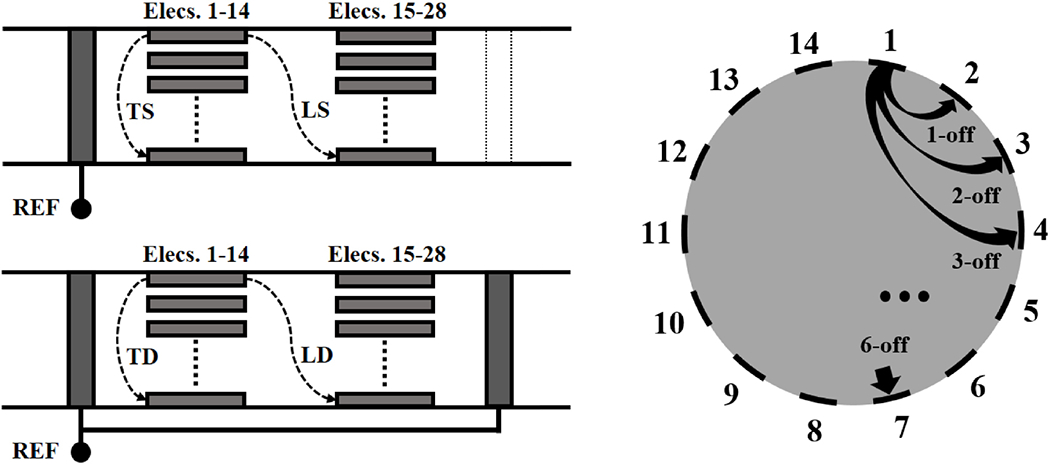
Left: Types of injections and referencing schemes tested in this study, with Transversal(T) and Longitudinal (L) injections performed with either a Single-ring (S) or Double-ring (D) reference, leading to four possible configurations (TS, LS, TD, LD). Right: diagram showing the electrode spacing configurations tested in this study over either transversal or longitudinal injections, from 1-off to 6-off spacing.
For the purpose of this study we assume recording from measurement electrodes is performed in parallel and real-time over all electrodes involved in the EIT protocol. This requires the use of an EIT system capable of high-speed and high-channel count parallel sampling; such systems are available (Avery et al 2017).
2.3.3. Modelling of fascicular compound action potentials as perturbations in bulk conductivity.
Occurrences of compound action potential activity in fascicles were simulated as cylindrical perturbations: 20% of nerve diameter (280μm out of 1400μm), aligned with the cross-section of the nerve and extending over its whole length (10mm) in the tetrahedral mesh. 5 such perturbations were created and spaced 100-500μm from the cross-section centre in 100μm steps (Figure 5). Perturbations were set as a reasonable 1% increase in bulk conductivity (Liston et al 2012, Aristovich et al 2015, Fouchard et al 2016), corresponding to a 0.003 S/m increase over 0.3 S/m of background conductivity.
Figure 5.
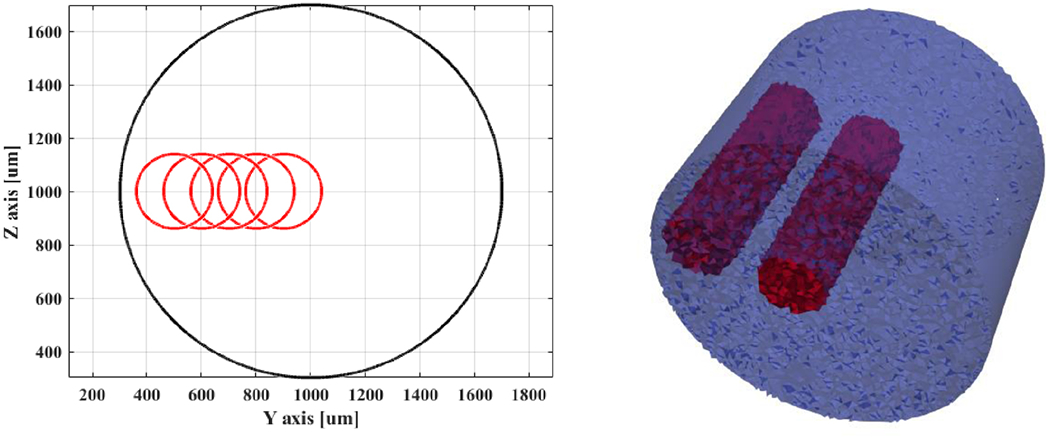
Left: Outlines of conductivity perturbations (red) placed at different distances between the cross-sectional centre of the nerve and the its external boundaries (black). Right: inner- and outer-most perturbations (red) over a tetrahedral representation of the nerve (blue).
2.3.4. Application of realistic noise to simulated data
Simulated δV values were corrupted by noise according to equation (1). A realistic value for VNoise standard deviation (std) was chosen by analysing EIT data from a pilot experiment on the rat sciatic nerve performed with different configurations (TS/LS/TD/LD from 2.3.2), 4-off spacing of injecting electrodes, and averaging over NT=292 trials of evoked fascicular compound activity. Standard deviation of noise was computed on a pre-stimulation background noise interval of 20ms and then correlation analysis was performed versus recorded boundary voltages. Noise levels of the demodulated EIT traces can theoretically have a fixed additive component and a component proportional to the level of current density near the electrode, which also influences BV magnitude. As such, the correlation between noise levels and BV is a proxy of the proportionality between injected current and noise. Results of this analysis, reported in subsection 3.1, showed that recorded experimental noise lacked a meaningful proportional component; for this reason, artificial noise was generated as random white noise. The value obtained by such analysis (0.5 μV) was not applied directly to simulated δVs as they were found to be, on average, 5-fold larger than experimental ones – thus, a value of 2.5 μV was applied in order to approximately match average experimental SNR at δV peak.
2.4. Image reconstruction
A Jacobian matrix J obtained from the forward solution was projected into a coarse hexahedral mesh (≈75K elements, uniform voxel size of 40x40x40μm) for image reconstruction. Reconstruction was performed by inverting the coarse Jacobian matrix using 0th-order Tikhonov regularization and noise-based voxel correction (Ventouras et al 2000, Aristovich et al 2018).
For transversal injections, only measurements from electrodes on the same ring as the injections were used, for a total of 196 measurements (14 current injections x 14 electrodes); for longitudinal injections, electrodes from both ring-like arrays were used, leading to a total of 392 measurements (14 current injections x 28 electrodes).
To perform noise-based correction, random white noise (Section 2.3.4) was also projected into the voxel-based mesh using the same reconstruction parameters. For each reconstruction, each voxel was divided by the standard deviation of projected noise, resulting in the z-score of the conductivity perturbation with respect to the background noise. Reconstruction was performed only on a relevant subset of ≈75K-elements on the hexahedral mesh, namely the part of the nerve subdomain including the injection/measurement rings, as shown in Figure 6. Visualization of reconstructed images was performed with Paraview (Kitware, New Mexico, USA).
Figure 6.
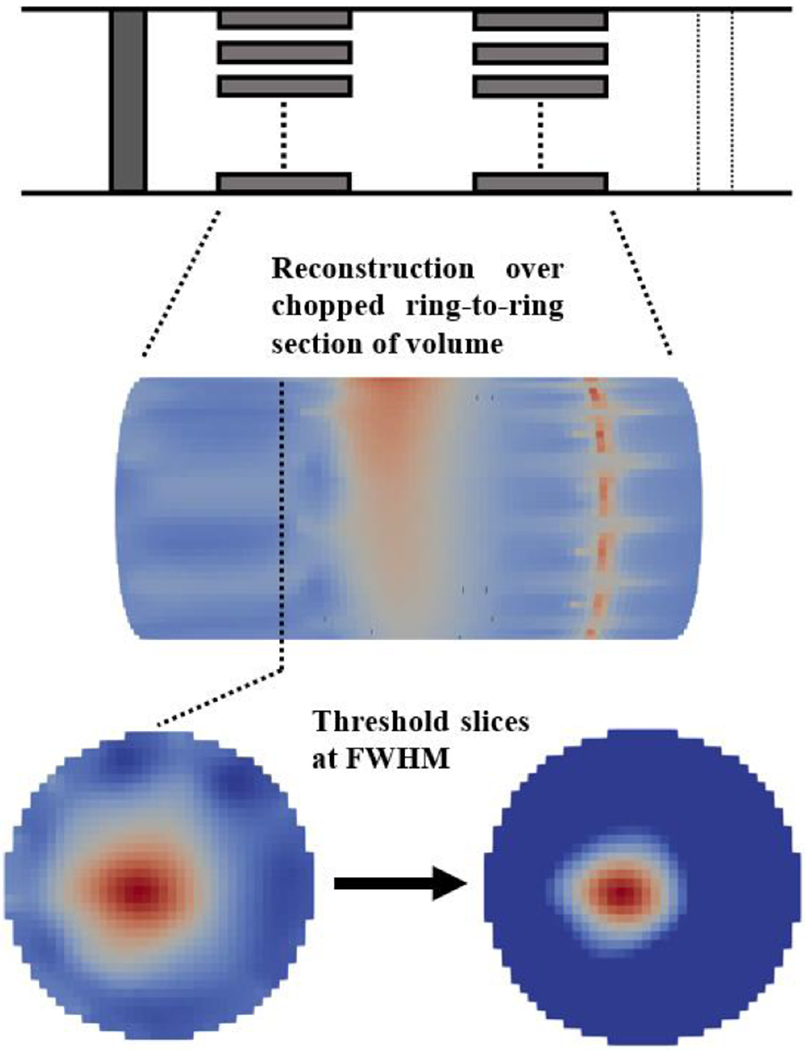
Image reconstruction process.
2.5. Quantitative evaluation of reconstructed images
Three figures of merit were chosen as quantitative metrics to assess each EIT protocol configuration (i.e. injection pattern + referencing scheme) described above. Each of these was evaluated over each cross-sectional area (i.e. each “slice”) of the reconstructed volume; thus, building a 1D evaluation profile along the longitudinal axis, defined as the x-axis for description purposes. As the longitudinal length of the reconstructed area is 3mm and the voxel size 40μm, 1D profiles were built over 75 different cross-sections for each simulation and metric.
All three metrics were evaluated with a Full-Width at Half-Maximum (FWHM) approach, meaning that for each slice only the top 50% (magnitude) of voxels were involved in the computation of metrics. This approach was chosen in order to avoid the evaluation being affected by the noise and small artefacts inherent to all reconstructed images. The metrics are:
- Average Signal Intensity, σAvg, dimensionless [−]: the target of this metric is to assess where on the x-axis the average amplitude of the reconstructed conductivity change is higher. As explained in 2.4, the reconstructed quantity is actually a z-score of the reconstructed conductivity vs. background noise; thus, this metric gives an indication of where the best image SNR will be located.
(2) - Center of Mass error, ECoM, [μm]: the purpose of this metric is to assess quality of localization of the centre of fascicular activity in the reconstructed images. In equation (5), ypert and zpert indicate the coordinate on the nerve’s cross-section of the real conductivity perturbation centre.
(3) (4) (5) - Circularity Index, CI, dimensionless [−]: this metric addresses the quality of shape reconstruction. Equation (6) will return index in the range [0-1], with 1 being a perfect circle. Given that conductivity perturbations are modelled as cylindrical in this study, assessing circularity as shown in equation (6) is a good surrogate for shape recovery in the present study. In equation (6), S(x) refers to the alpha-shape reconstructed at any given x-axis location from the selected FWHM voxels.
(6)
For each equation in (2)–(4), index i points to voxels at the given x-axis location.
The σAvg and ECoM metrics have some similarity, respectively, to the volume-weighted Image Magnitude (IM) and to the Radial Position Error metrics from the work by Graham and Adler (Graham and Adler 2007). The circularity metric has already been previously used for evaluating EIT reconstructions (Chapman et al 2019).
Results for each configuration and electrode spacing were averaged over the five simulated conductivity perturbations in order to build a more robust evaluation of each protocol variant regardless of fascicle location relative to the cuff.
Naturally, as evaluation is performed over the whole reconstruction domain, but current injection is only performed transversally in some simulations, metrics from T simulations will show asymmetric 1D profiles and degraded performances over the longitudinal locations of the second (unused) electrode ring.
A logical approach was used to identify the optimal protocol. Arguably, minimizing localization error ECoM would be first priority given our aim for targeted neuromodulation. However, real EIT measurements have the general problem of low SNR in both measured impedance variations and reconstructed images. Thus, the best possibility of successful imaging is in areas with higher σAvg, therefore, locating these areas should be priority. Shape, on the other hand, is the least relevant factor as selective neuromodulation can currently only target a general zone of the nerve cross-section and not a specific shape. Also, fascicles all have roughly circular/ellipsoidal cross-section, so shape is quite regular and can be easily guessed as a priori knowledge. For these reasons, in this study, CI is reported in results but only checked on generic terms: it is not a rejection criterion for a specific simulated protocol configuration unless very low. The following order of priority was given in identifying optimal configuration:
Identify x-axis location(s) xmax of maximum σAvg for each simulation.
Evaluate localization error ECoM at slices x= xmax.
Exclude configurations with extremely low CI, if present.
2.6. In-vivo experiments
Experiments were performed on sciatic nerves from Sprague-Dawley adult male rats weighing 400–550g, with the same procedures as in (Aristovich et al 2018). All animal experiments undertaken in this study were approved by the UK Home Office and in accordance with its regulations.
Experimental data were collected for evoked compound activity on tibial and peroneal fascicles, i.e. the main fascicles of the rat sciatic nerve. The following data were collected:
A single experiment with TS configuration and 4-off spacing was performed to collect BV and noise data.
A small but demonstrative dataset (N=3) was collected with the configuration determined to be the optimal from simulations (transversal injections, single-ring referencing, 4-off spacing).
EIT measurements in this study have been performed with the custom EIT cuff design reported in subsection 2.2 (14 electrodes x 2 rings, plus refs.), manufactured as described in (Chapman et al 2019). As in (Aristovich et al 2018), the EIT cuff was placed on the main trunk of the sciatic nerve running in the posterior compartment of the thigh approximately 20 mm distal to the greater sciatic foramen. EIT injected current frequency was 6KHz as in (Aristovich et al 2018), whereas injected current amplitude was doubled from 30μA in the previous study to 60μA in order to maximize detected impedance changes without eliciting action potentials. Fascicle stimulation was performed with cuff electrodes (Cortec Gmbh, Freiburg, Germany) coated with PEDOT:pTS as done for the nerve cuff electrodes, delivering biphasic 50μs pulses at 1-2mA amplitude and 200ms repetition time. Stimulation electrodes were placed more distally compared to the EIT cuff, in a zone of complete branching of the tibial and peroneal fascicles, approximately 15mm away from the cuff (edge-to-edge). Stimulation parameters have been chosen for each fascicle with the target of evoking supramaximal compound action potential (CAP) activity in myelinated fibers. All EIT measurements were performed with a ScouseTom system (Avery et al 2017). Averaging over repeated stimulation pulses was performed at 1-minute for each injection pair (total 292 trials for each pair) for a total recording time of 14 minutes. Raw signals were converted to δV recordings (“traces”) by Hilbert transform demodulation (modulus only) at 2KHz bandwidth around the 6KHz EIT carrier.
Criteria for excluding collected impedance traces from reconstruction were:
Injection or measurement on faulty electrode (classified by user)
DC saturation of raw signal
δV background noise >3μV
Imaging of selected experimental impedance changes was performed with the same method reported in subsection 2.5 for simulated data (Tikhonov regularization and a noise-based voxel correction method). EIT reconstructions were evaluated at time of peak average δV variation for each recording.
Images collected with TS/TD protocols were evaluated at slice x=−1.5mm (with x=0 at the central position between the electrodes) and images collected with LS/LD protocols were evaluated at slice x=0mm, as found to be best from simulations. Slices were post-processed with median and mean filtering of respectively 1- and 3-voxels radius. From post-processed EIT images of the optimal protocol dataset, CoM was computed for each fascicle at FWHM.
After each experiment, the EIT cuff was removed and a surgical suture was glued along the side of the nerve to mark the position of the cuff’s opening. The nerve was then excised and Micro-Computed Tomography (microCT) scans were performed according to the method developed by our group (Thompson et al 2019b) to obtain reference ground truth location for EIT-computed CoMs. Briefly, the nerve was stained in 1% Lugol’s iodine solution for 24h and scanned with a microCT scanner (Nikon XT H 225) using a molybdenum target, a power of 4W, 3176 projections and a resolution with isotropic voxel size of 4μm. The other scanning parameters were set at 35kVp energy, 114 μA current and 4s exposure time (0.25 frames per second). Scans were reconstructed using Nikon CT Pro 3D software and exported to MATLAB.
MicroCT reference fascicle CoMs were evaluated by performing rigid deformation of the image with a custom MATLAB script and then fitting the nerve external boundary to a circular profile. Manual co-registration of the nerve cuff’s opening in the EIT and microCT images was possible due to the surgical suture which was visible in the microCT scans. CoM from EIT and microCT were compared over vector distance modulus and over radial coordinates (R/ϑ).
2.7. Statistical analysis for in-vivo experiments
Peak δV traces were analysed by a paired t-test with Bonferroni correction with respect to background noise to determine the significance of impedance changes. CoM localization error was computed for each fascicle. Mean radial distance and angular position of tibial, peroneal and sural fascicles computed from EIT and MicroCT CoM values were compared by a one-way ANOVA. A multiple-comparisons tests was performed between each pair of fascicles found to have significance in the ANOVA test for each quantity (radial/angular). Average peak δV traces, CoM localization error and mean radial distance and angular position are reported as mean±standard deviation in the Results section.
3. Results
3.1. Extended forward model and realistic noise levels
Use of our extended forward model (Subsection 2.3.1) led to an improvement in correlation between predicted and experimental boundary voltages for longitudinal-type injections (R2=0.70 extended model vs R2=0.34 for the basic model) and to identical results for the transversal-type injections (R2=0.72 extended model vs R2=0.72 for the basic model) (Figure 7).
Figure 7.
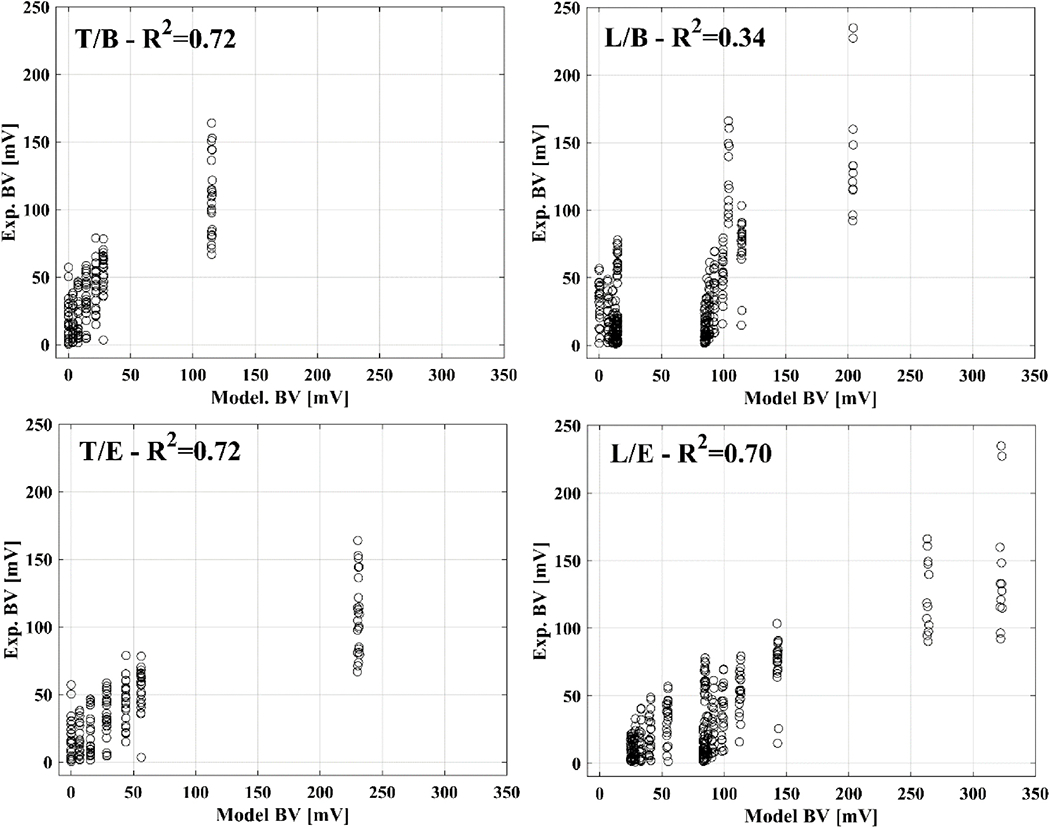
Example of correlation between boundary voltages from the forward model and experimental data. Correlation is shown for transversal (T) or longitudinal (L) injections and for basic (B) or extended (E) forward models.
A visual indication of the time interval chosen for the computation of background noise std is shown in Figure 8, left panel, for exemplary EIT δV traces during repeated evoked compound activity. Noise std computed for each configuration (Table I) showed that no meaningful difference was present in noise level among different configurations. Correlation between noise standard deviation and boundary voltage amplitude was also analysed to investigate a possible dependency of the noise level from injection current; analysis was performed by pooling together all the traces recorded for the different configurations reported in Table I, for a total number of NδV = 1684 traces. The lack of meaningful correlation in this analysis (R2=0.17 and Figure 8, right.) suggests noise to be purely additive. In conclusion, this analysis showed a realistic noise standard deviation to be ≈0.5μV.
Figure 8.

Left: Example of multiple experimental δV traces from an experimental EIT recording. Each trace is averaged over NT=292 trials. The interval over which pre-stimulation noise standard deviation is evaluated, the stimulation time, and the time of peak δV due to the CAP are illustrated. Right: scatter plot of noise levels vs. boundary voltages for NδV=1684 traces, showing negligible correlation between the two quantities (R2=0.17).
Table I.
Breakdown of average background noise standard deviation for single- and double-ring (S/D) referencing and transversal/longitudinal (T/L) current injection, with the total number of traces NδV analysed for each configuration.
| Background Noise std [uV] | |||
|---|---|---|---|
| Ref: S | Ref: D | ||
| Inj: T | Inj:L | Inj: T | Inj:L |
| 0.46±0.17 (NδV=275) | 0.47±0.17 (NδV=560) | 0.48±0.19 (NδV=283) | 0.43±0.16 (NδV=566) |
| 0.47±0.17 (NδV=835) | 0.45±0.19 (NδV=849) | ||
| 0.46±0.17 (NδV=1684) | |||
3.2. Simulation results
The type of injection pattern (T or L) had the largest influence on the profile of each figure of merit along the x-axis (Figure 9) for all configurations (TS, LS, TD, LD). For example, signal amplitude σAvg was much more similar among current injection protocols performed on the same electrode array, regardless of single-/double-ring referencing scheme, than for current injections performed with the same referencing scheme across one or two electrode arrays; e.g. σAvg evaluated at peak locations with 5-off spacing was 40.0/37.9/162.9/139.3 for TS/TD/LS/LD configurations, respectively. More specifically, the double-ring referencing scheme did not show any advantage over the evaluated figures of merit compared to single-ring referencing: maximum a σAvg was ≈3% lower for transversal injections and ≈16% lower for longitudinal injections, whereas ECoM and circularity were comparable. On the basis of this first observation, we concluded that double-ring referencing could be excluded from our selection process.
Figure 9.
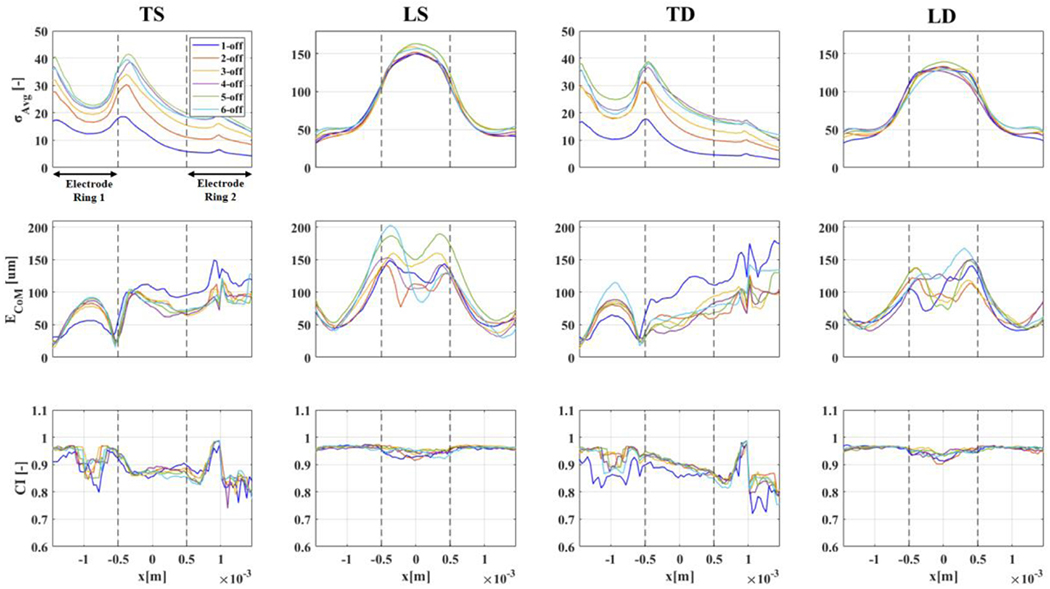
Figures of merit for each protocol configuration (TS/DS/TD/LD) and for different injection electrode pair spacing (1-off to 6-off, colour-coding available as legend in upper-left panel). Results are reported as a function of longitudinal axis on the reconstructed volume shown in Figure 6 (−1.5 to 1.5mm). Boundaries of electrode rings are shown in the first subpanel as black arrows and in all subpanels as vertical dashed lines.
After exclusion of the results from double-ring referencing, we then focused on analysis of single-ring reference protocols to identify the optimal current injection type (i.e. transversal or longitudinal) and electrode spacing (1-off to 6-off corresponding to 26-154°). Figures of merit for TS and LS schemes are reported in Table II and visually again in Figure 10 for an easier comparison.
Table II.
Figures of merit for transversal(TS) and longitudinal(LS) single-reference protocols with different spacing of current injection electrodes. Evaluation is performed at selected XMax values on the reconstructed volume presenting σAvg peaks.
| TS | LS | ||||||||
|---|---|---|---|---|---|---|---|---|---|
| XMax =−1.5 [mm] | XMax =−0.5 [mm] | XMax =0 [mm] | |||||||
| Spacing | σAvg [−] | ECoM [μm] | CI [−] | σAvg [−] | ECoM [μm] | CI [−] | σAvg [−] | ECoM [μm] | CI [−] |
| 1-off | 16.9 | 30.9 | 0.91 | 18.0 | 56.6 | 0.92 | 149.4 | 125.5 | 0.93 |
| 2-off | 27.6 | 26.2 | 0.96 | 27.4 | 31.5 | 0.94 | 151.7 | 112.7 | 0.92 |
| 3-off | 31.9 | 13.9 | 0.96 | 31.2 | 28.9 | 0.93 | 158.8 | 143.1 | 0.94 |
| 4-off | 37.0 | 17.0 | 0.96 | 32.8 | 27.8 | 0.94 | 150.2 | 105.5 | 0.94 |
| 5-off | 40.0 | 24.2 | 0.95 | 36.0 | 25.7 | 0.95 | 162.9 | 150.4 | 0.95 |
| 6-off | 35.6 | 23.1 | 0.96 | 36.0 | 35.0 | 0.93 | 156.5 | 94.0 | 0.95 |
| Mean | 31.5 | 22.5 | 0.95 | 30.2 | 34.2 | 0.93 | 154.9 | 121.9 | 0.94 |
| Std | 8.4 | 6.2 | 0.02 | 6.8 | 11.4 | 0.01 | 5.4 | 21.9 | 0.01 |
Figure 10.
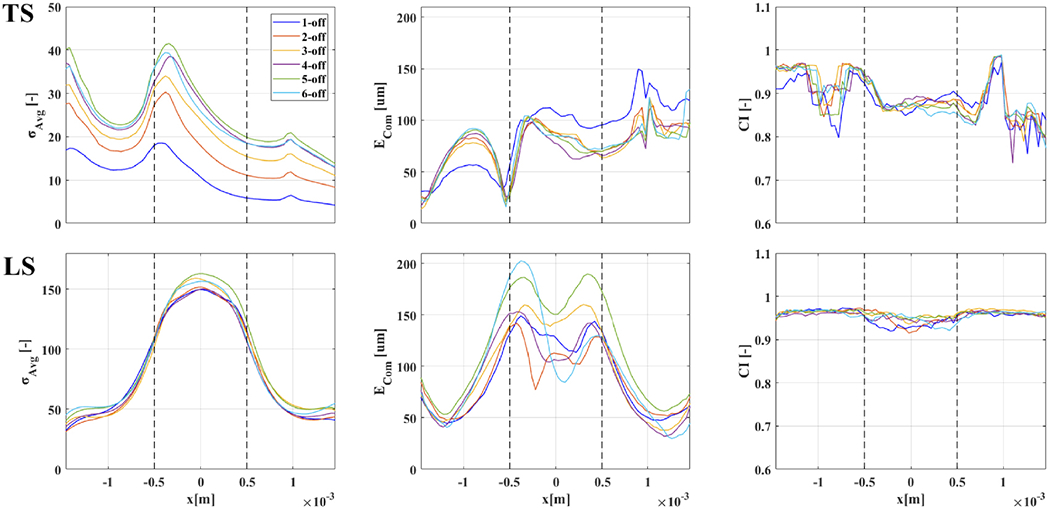
Figures of merit for TS/LS from Figure 9 from x=−1.5 to 1.5mm, with electrode boundaries shown as dashed lines. Color-coding for injection electrode spacing available in a legend in the upper–left panel.
As described in the Methods section, our process for optimal protocol selection first involved selection of maximum σAvg: this choice is justified by the concern that, although other metrics might be not optimal at the location of maximum σAvg in practical applications successful imaging will be harder outside of locations with high SNR. The σAvg profiles in Figure 10 have different peak locations for transversal and longitudinal injection schemes; however, location of σAvg peaks was consistent among simulations with different injection electrode spacing. Transversal injection protocols showed maximum σAvg in close proximity to both external electrode boundaries (xMax=−1.5mm and xMax=−0.5mm for this specific cuff design) whereas longitudinal injection protocols had the largest reconstructed conductivity change on the middle plane located between the electrodes (x=0). Overall, transversal injection protocols led to an average signal for the reconstructed conductivity change which was lower compared to longitudinal injections and showed more variability in relation to different injection electrode spacing (TS at xMax=−1.5mm:31.5±8.4, TS at xMax=−0.5mm:30.2±6.8. LS at xMax=0mm:154.9±5.4). The maximum σAvg was ≈40 for TS, with similar results from 4-,5- and 6-off spacing, i.e. for >100° for injecting electrodes, and ≈150 for LS, with similar results for all injection electrode spacing. The main result here was not the specific σAvg value, which is of course case-specific, but the ratio between the LS and TS protocols. A simple possible explanation for the higher average signal amplitude for longitudinal injections is the fact that a longer path for electrical current across electrode arrays implied a larger bulk resistance, and thus a proportional bulk conductivity change will be larger as well and easier to detect and image.
The second step in our selection process was evaluation of center-of-mass error ECoM at locations of peak σAvg. For this marker, transversal current injection protocols showed better results, with ECoM being, on average, lower than longitudinal injections (TS at x=−1.5mm: 22.6±6.2μm, TS at x=−0.5mm: 34.2±11.4 μm, LS at x=0mm: 154.9±5.4). The minimum error for TS was ≈17μm, with 4-off spacing, although 5-/6-off spacing yielded only slightly worse results of ≈24μm. The minimum error achieved for LS was ≈94μm, with 6-off spacing, with 4-off closely following at 106 μm. In evaluating ECoM results, the size of the voxel on the reconstruction mesh, 40 μm, placed a lower bound in trusting ECoM results. For this reason, despite, for example, TS protocols reaching 17μm as the lowest ECoM value (roughly corresponding to half-voxel size), we suggest the best course is to stay on the safe side and assume that centre-of-mass localization power of the best transversal and longitudinal protocols can be estimated at 1-voxel (or sub-voxel) and 2 or 3-voxels respectively.
On the basis of the previous observations about figures of merit σAvg and ECoM, we narrowed our optimal protocol selection to the following two choices:
transversal injection protocol with single-ring reference electrode (TS) with 4-off electrode spacing (≈100°) and evaluation of the reconstructed conductivity change at xMax=−1.5mm, corresponding to the reconstructed slice on the edge of the electrode closest to the reference ring.
Longitudinal injection protocol with single-ring reference electrode (LS) with 4-off electrode spacing (≈100°) and evaluation of the reconstructed conductivity change at xMax=0mm, corresponding to the reconstructed slice on the middle plane in-between electrode arrays.
For TS configuration, xMax=−1.5mm was chosen among the two peak a σAvg locations for having a slightly lower ECoM. For LS configuration, 4-off injection spacing was chosen in place of 6-off spacing, which presented slightly lower ECoM, since the difference was very low (<half voxel size) and using the same spacing value for TS and LS would allow a more direct comparison.
With respect to CI, the two protocols at the selected xMax locations had CI values of 0.96(TS) and 0.94(LS), respectively, over a maximum of 1 which would imply perfect circularity. Thus, both protocols had a more than acceptable shape reconstruction power for our purpose. It is interesting to notice from Figures 9 and 10 how no protocol reaches maximum CI value of 1; there might be a hard limit given by the fact that our evaluation of circularity first involves determining the external perimeter of the reconstructed perturbation with the alpha-shape method from voxel locations; thus, from an imperfect reconstruction of external boundaries.
A visual comparison of the two best protocols identified is shown in Figure 11, where it is possible to see how transversal injections, compared to longitudinal, led to a reconstructed conductivity change which was less circular but whose centre-of-mass was closer to ground truth. The same figure also shows distribution of current flow for both protocols in an exemplary injection pair.
Figure 11.
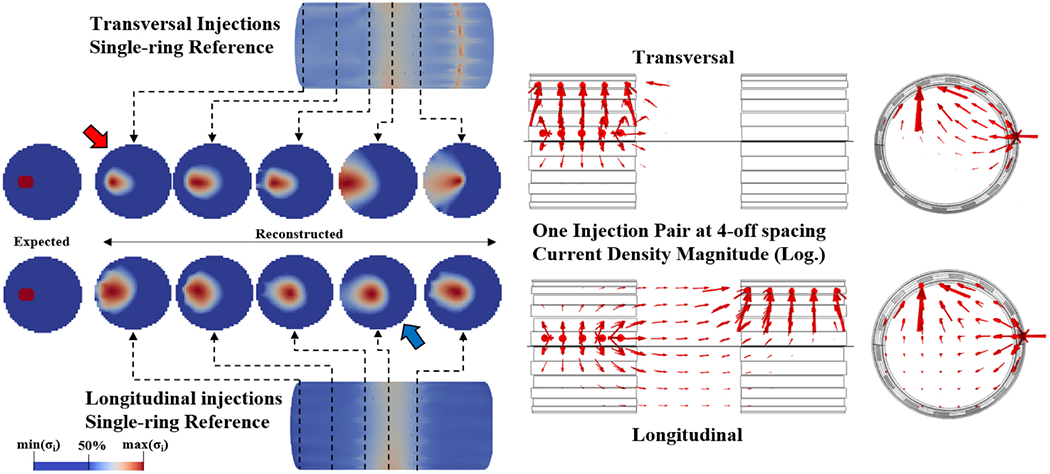
Left: Visual comparison of reconstructed conductivity changes along different x-axis locations for one example perturbation with TS/LS configurations and 4-off spacing. Each slice is shown with FWHM colour scheme for its own value range. Red and blue arrows identify optimal reconstruction location for TS and LS protocols, respectively. Right: arrows representing logarithm of current density in the reconstructed volume for one example injection pair at 4-off spacing in transversal and longitudinal configurations.
The two current injection protocols identified above as candidates for optimality show a trade-off between relevant features in simulation: with transversal injections, fascicle localization error is lower, whereas signal is stronger with longitudinal injections. Given our goal of targeted neuromodulation, the logical final choice would be to use transversal current injections; however, since achieving high SNR can be a problem in many practical EIT applications, and particularly in neural applications, choosing longitudinal injections would still be a valid option for low SNR applications.
As it was possible in the present study to achieve high SNR in experimental recordings with transversal current injections, performance of this protocol (TS, 4-off spacing, reconstruction at xMax=−1.5mm) was assessed experimentally.
3.2. Experimental results
For the optimal protocol dataset, EIT imaging and microCT scans were performed over six experimental recordings (N=3 nerves, tibial/peroneal fascicles for each). An example of reconstructed EIT images can be found in Figure 12 compared with a microCT cross-sectional image from the same nerve. In this example, the reconstructed tibial and peroneal impedance changes appear to have a similar area, with peroneal almost larger than tibial, whereas the reference image shows a physiologically smaller size for the peroneal fascicle. This is explained by the fact that since the peroneal fascicle is smaller than the tibial, its impedance change will be less detectable (i.e. its EIT signal will be smaller) and, thus, the reconstructed image will be more spread out.
Figure 12.
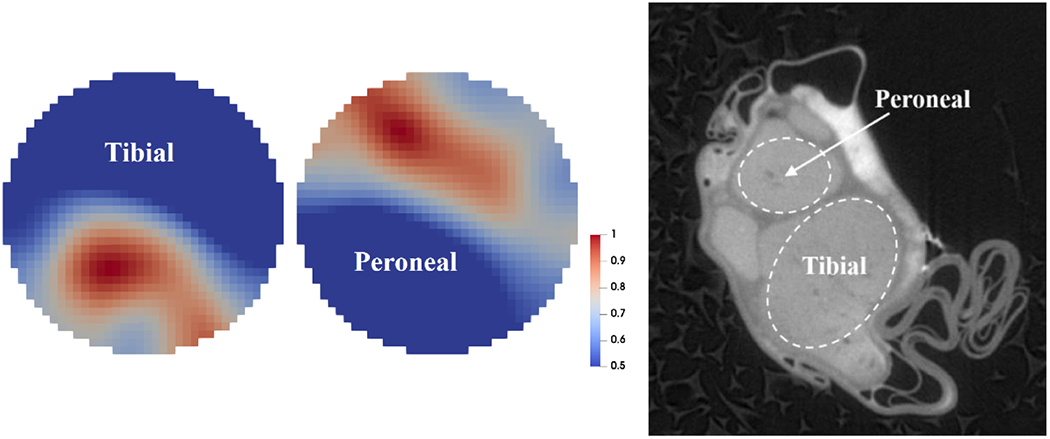
Left: example of EIT imaging of compound activity from tibial and peroneal fascicles (normalized FWHM visualization). Right: MicroCT scan of the same nerve (raw scan, before co-registration).
EIT recordings used for reconstruction had an average of 153.3±2.5 δV traces. All recordings had statistically significant peak δV variations related to evoked activity (p<0.05 with Bonferroni correction). CoM localization error was 172±46μm for tibial fascicle, 110±52μm for peroneal fascicle, and 141±56μm overall. Radial estimation error was −3±118μm for the tibial fascicle, −49±80μm for the peroneal fascicle, and −26±94μm overall. Angular estimation error was −2±42° for the tibial fascicle, 12±16° for the peroneal fascicle, and 5±29° overall. No significant difference was found (p>0.05) between mean radial distance of tibial and peroneal CoMs (273±56μm and 254±36μm, respectively). Significant difference was found (p<0.05) between mean angular location of tibial and peroneal CoMs (−125±28° and 59±19°, respectively. Figure 13).
Figure 13.
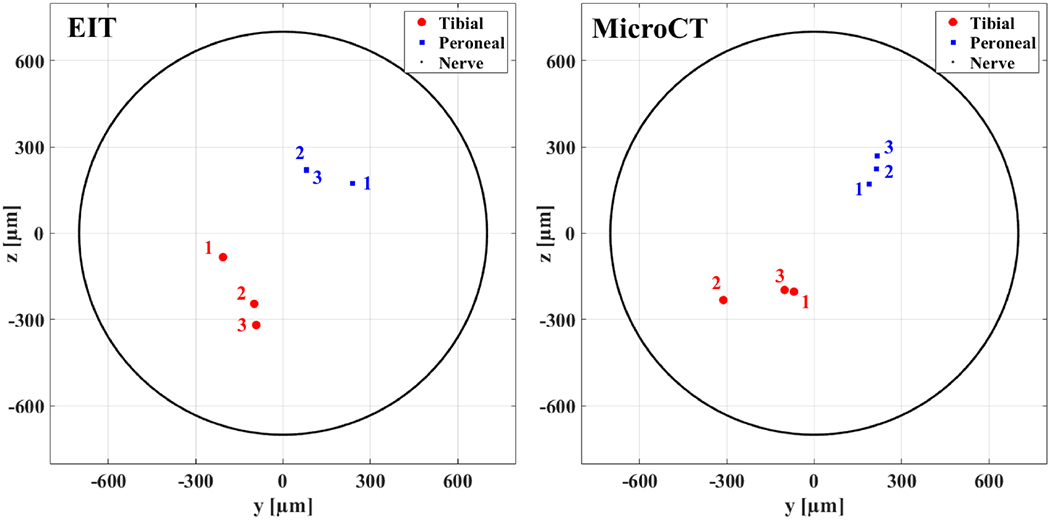
Centres of mass estimated from EIT reconstructions (left) and computed from reference microCT scans (right) for N=3 nerves. CoMs are shown in red dots for tibial fascicles and blue squares for peroneal fascicles. Data from each of the three nerves is marked with labels 1-3. Peroneal EIT-computed CoMs 2 and 3 present strong overlapping and are not distinguishable. External nerve boundary is shown as a black line. In the left panel, only two out of three EIT CoMs are visible for peroneal fascicle as two of them strongly overlap.
4. Discussion
4.1. Results summary and answers to questions in 1.3.
Overall, the study showed insights into the protocol selection and allowed significant optimisation of the EIT acquisition for application to electrode cuffs.
Specifically:
-
a
Which injection pattern works best in simulation? On which region of the reconstructed volume is best to image fascicles?
Injecting current transversally with spacing of ≥4 electrodes apart (≥100°) and single-ring referencing of measurements leads to the best overall localization when reconstructing on the edge of the electrode array as close as possible to the reference ring. Injecting current with longitudinal injection protocols leads to a higher SNR of reconstructed signal but with localization being 2-3 times worse.
-
b
How does the best pattern found in simulation perform in real experiments?
The single-reference transversal injection protocol with 4-off spacing returned an overall CoM localization error of 141±56μm over six fascicle measurements in the rat sciatic nerve, approximately equivalent to 10±4% (in line with known EIT performance (Holder 2005) of the nerve diameter and 2-5 voxels in our reconstruction mesh. Broken down into radial coordinates, CoM error was overall −26±94μm for radius and 5±29° for angular position, suggesting good capability of this pattern for targeting fascicles located at different angles over the nerve’s cross section. Several factors might have influenced the increase in CoM localization error from theory to practice which are not necessarily related to EIT:
Twisting and deformation of nerve during EIT nerve cuff positioning.
Shrinkage and deformation of nerve during pre-processing (fixation/staining) and microCT scanning.
Co-registration is not a perfect process, as it relies on deformation of the MicroCT image to fit a circular profile equivalent to that of the EIT nerve domain.
This possible CoM error sources are not specific to microCT as, for example, histology pre-processing could also lead to nerve deformation, and rigid deformation for circle-fitting would need to be applied regardless of the source of images.
-
cWhat is the theoretical explanation of these modelling and simulation results?
-
c.1.)Double referencing does not improve results: this is an effect which is caused by current flow, where part of the injected current flows around the region of interest due to short circuiting through the metal of the reference electrodes. The total amount of this current would depend on the specific geometry and, for our case, the improvement in background noise was neglected by the drop of signal due to this reference configuration.
-
c.2.)The transversal protocol has better resolution, whilst longitudinal protocol has better SNR. This effect is caused by several factors:
- The total longitudinal transfer impedance drop is higher than transversal due to the fact that current has to travel a longer distance across the nerve region between the electrodes. Thus, transfer impedance is larger and the impedance variation is also proportionally larger.
- The current changes direction in the longitudinal case more than it does in transversal. A region containing an impedance variation will have a larger influence on recorded δV traces if more current is driven through it. Given that image reconstruction is performed starting from these δV traces, imaging will be “skewed” to better reconstruct perturbations in regions with higher current density. With the transversal protocol, most of the current stays in the transversal direction and close to the driving electrode pair (as shown by streamlines in Fig. 11); thus, better resolution is achieved on the cross-sectional plan. With the longitudinal protocol, current is more widely spread out across the whole domain, it changes direction since the drive electrode of the second array requires current steering from transversal to longitudinal, and the path of the current is much longer.
-
c.1.)
-
d
What are the recommendations for performing fast neural EIT of fascicular compound activity in future studies?
We recommend using the above-mentioned 4-off TS protocol if decent SNR can be achieved on impedance changes; otherwise, any LS protocol (with ≥4-off spacing suggested) can be used to boost the SNR by increasing the impedance change magnitude.
4.2. Comparison to existing literature
As explained in the introduction, optimal EIT drive and measurement patterns have been investigated previously in several studies.
As such, the work hereby presented is similar to previous works by Adler and co-authors (Graham and Adler 2007, Adler et al 2011, Wagenaar and Adler 2016) in regard to the use of isotropic conductivity and a cylindrical model. The main difference of our study from these models is that we evaluated reconstruction quality on a 2D plane at different positions along the x-axis for an impedance change which is uniform along the x-axis, and with an x-axis resolution much smaller than the electrodes; both of which are representative of EIT implemented in a nerve cuff.
In the more specific context of neural EIT, determination of the optimal EIT protocol for imaging of fascicular compound activity has been previously investigated by Hope (Hope et al 2018b, 2018a). The main differences of this study from the work performed by Hope are the following:
Forward model – Hope’s forward model of the nerve includes anisotropic conductivity and different conductivity values for different subdomains like epineurium, perineurium, and fascicles, whereas our model has uniform isotropic bulk conductivity. This choice was made intentionally in order to avoid making specific assumptions about the details of the physio-anatomical properties of the nerve under measurement. For example, with a layered model, epineurium thickness could be different between the model and the specific nerve under investigation, possibly leading to an erroneous image reconstruction if the Jacobian is computed based on average values. Also, this study was focused on comparison between different current injection protocols and, thus, the choice of nerve model, as long as realistic, is not a detail of specific concern.
Tested injection patterns – The number of current injection protocols tested in this study was wider than in the previous study. Also, the number of electrodes in our cuff was lower (2x14 vs 2x16 in cuff used by Hope et al.).
Technical details – A tetrahedral forward model mesh was used in this study, whereas in Hope’s study, grid-based sub-domains extending over the whole longitudinal length of the nerve model are used. We also apply a noise-based correction to Tikhonov-regularized reconstructions and choice of regularization parameters is performed by cross-validation instead of L-curve.
Despite the technical differences, our findings are in general agreement with Hope’s study, in regard to the fact that transverse current patterns produce higher resolution but are more susceptible to noise, given the lower signal intensity.
4.3. Technical considerations
In the present study, protocols were evaluated on the basis of the quality of the imaged conductivity perturbations, which were reconstructed using a Tikhonov-based algorithm; thus, it could be argued that our conclusions are only valid for the specific reconstruction process we employed. However, Tikhonov-based reconstruction is a well-established technique for EIT and the specific noise-corrected method used in this study has been previously validated (Aristovich et al 2018, Ventouras et al 2000).
One limitation of this study is that only the current pattern identified as optimal from simulations was tested in the in-vivo experiments.
In the present configuration of fast neural EIT, several injection pairs and measurement electrodes were employed in addition to long averaging times for improvement of SNR. Further optimization might lead to improvements in measurement speed (see subsection 4.4); however, this is not the target of this study, which focused on current injection optimization, and we expect that comparison of protocols stays valid with a homogeneous reduction of measurement and injection pairs.
Also, a different number of measurements was used for reconstruction from transversal and longitudinal injection protocols: this choice could seem biased as comparison of quality of images was performed between protocols with access to less or more information during the reconstruction process. However, longitudinal protocols were still found to be lacking in terms of centre-of-mass localization; also, modern data acquisition systems like the ScouseTom have the technical capability of parallel sampling of multiple channels, so including additional measurements comes with no disadvantage.
4.4. Future technical improvements
Future studies on the use of fast neural EIT for imaging of fascicular activity in peripheral nerves should start from the results hereby presented, that is, the two optimal protocols identified, and involve further optimization of EIT for this specific application.
One topic of interest would be to perform faster measurements: this would involve analysing how skipping an increasing number of injection pairs and reducing the number of averaging trials would affect SNR of impedance changes in order to identify the minimal set of required measurements for successful imaging. Faster measurements in peripheral nerves could also be achieved through parallel injections implemented by frequency-division multiplexing (FDM) (Avery et al 2019, Hope et al 2019) or phase-division multiplexing (PDM) (Dowrick and Holder 2018).
Another topic of interest would be to address image reconstruction for this specific application: reconstruction could be streamlined by reducing the size of the reconstructed volume and by fixing the regularization coefficient λ; structural priors could be applied to take into account the specific, strongly directional conformation of the nerve.
4.5. Future challenges of vagus nerve EIT imaging
In this work, protocol optimization was performed using simulations and experimental data related to the rat sciatic nerve. However, our ultimate goal is to improve neuromodulation of the vagus nerve in humans and, as such, translational applications of our results should be addressed. The forward model and reconstruction algorithm we used do not contain any assumption about the specific physiological properties of the nerve under investigation, moreover the comparison between protocols is relative. Thus the obtained results should be of general validity, provided that a similar relationship between the nerve diameter and the cuff geometry is preserved when scaling up to the vagus nerve. While the rat vagus nerve does not possess a clear multi-fascicular structure (Licursi de Alcântara et al 2008), the vagus nerves of large animals and humans do (Verlinden et al 2016). Therefore, the next step towards human vagus EIT will be performed in pigs and/or sheep. Scaling up to a nerve of larger diameter will also allow for easier manufacturing of electrode cuffs.
Nonetheless, specific physiological challenges remain in scaling up nerve EIT to imaging of the vagus nerve. For example, imaging of rat sciatic nerve fascicles is currently performed by evoking activity in myelinated fibers with electrical stimulation of individual fascicles. This might be a challenge in the vagus nerve which is composed mainly of unmyelinated fibers. However, at the cervical level, up to 30% of all fibers in the vagus nerve are myelinated (Thompson et al 2019a, Verlinden et al 2016) so it should be possible to record a signal viable for imaging, provided recording times are long enough. Also, electrical stimulation will need to be replaced with a clever recording paradigm which will allow time-difference EIT recordings with sufficiently high SNR.
Acknowledgements
Research supported by the UK Medical Research Council (MRC grant No:MR/R01213X/1) and USA National Institute of Health (NIH SPARC grant No: 1OT2OD026545-01).
We thank Dr. Francesco Iacoviello and Professor Paul Shearing from UCL Electrochemical Innovation Lab for granting access to the microCT machine used in this study.
Author E. Ravagli would like to thank Christopher Chapman and Mayo Faulkner for their technical support in electrode manufacturing and EIT reconstruction.
References
- Adler A, Gaggero PO and Maimaitijiang Y 2011. Adjacent stimulation and measurement patterns considered harmful Physiol. Meas 32 731M4. [DOI] [PubMed] [Google Scholar]
- Aristovich K, Donegá M, Blochet C, Avery J, Hannan S, Chew DJ and Holder D 2018. Imaging fast neural traffic at fascicular level with electrical impedance tomography: proof of principle in rat sciatic nerve J. Neural Eng 15 056025. [DOI] [PubMed] [Google Scholar]
- Aristovich K, Donega M, Fjordbakk C, Tarotin I, Chapman C, Viscasillas J, Stathopoulou T-R, Crawford A, Chew D, Perkins J and Holder D 2019. Complete optimisation and in-vivo validation of the spatially selective multielectode array for vagus nerve neuromodulation [DOI] [PubMed]
- Aristovich K Y, Packham BC, Koo H, Santos G S dos, McEvoy A and Holder DS 2016. Imaging fast electrical activity in the brain with electrical impedance tomography Neuroimage 124 204–13 [DOI] [PMC free article] [PubMed] [Google Scholar]
- Aristovich KY, Dos Santos GS and Holder DS 2015. Investigation of potential artefactual changes in measurements of impedance changes during evoked activity: implications to electrical impedance tomography of brain function Physiol. Meas 36 1245–59 [DOI] [PMC free article] [PubMed] [Google Scholar]
- Aristovich KY, Santos G S dos, Packham BC and Holder DS 2014. A method for reconstructing tomographic images of evoked neural activity with electrical impedance tomography using intracranial planar arrays Physiol. Meas 35 1095–109 [DOI] [PubMed] [Google Scholar]
- Avery J, Dowrick T, Faulkner M, Goren N, Holder D, Avery J, Dowrick T, Faulkner M, Goren N and Holder D 2017. A Versatile and Reproducible Multi-Frequency Electrical Impedance Tomography System Sensors 17 280. [DOI] [PMC free article] [PubMed] [Google Scholar]
- Avery J, Dowrick T, Witkowska-Wrobel A, Faulkner M, Aristovich K and Holder D 2019. Simultaneous EIT and EEG using frequency division multiplexing Physiol. Meas 40 034007. [DOI] [PubMed] [Google Scholar]
- Ben-Menachem E 2001. Vagus nerve stimulation, side effects, and long-term safety. J. Clin. Neurophysiol 18 415–8 [DOI] [PubMed] [Google Scholar]
- Birmingham K, Gradinaru V, Anikeeva P, Grill WM, Pikov V, McLaughlin B, Pasricha P, Weber D, Ludwig K and Farnm K 2014. Bioelectronic medicines: a research roadmap Nat. Rev. Drug Discov 13 399–400 [DOI] [PubMed] [Google Scholar]
- Brown BH and Seagar AD 1987. The Sheffield data collection system. Clin. Phys. Physiol. Meas 8 Suppl A 91–7 Online: http://www.ncbi.nlm.nih.gov/pubmed/3568577 [DOI] [PubMed] [Google Scholar]
- Chapman CAR, Aristovich K, Donegá M, Fjordbakk CT, Stathopoulou T-R, Viscasillas J, Avery J, Perkins JD and Holder D 2019. Electrode fabrication and interface optimization for imaging of evoked peripheral nervous system activity with electrical impedance tomography (EIT) J. Neural Eng 16 016001. [DOI] [PubMed] [Google Scholar]
- Dowrick T and Holder D 2018. Phase division multiplexed EIT for enhanced temporal resolution Physiol. Meas 39 034005. [DOI] [PubMed] [Google Scholar]
- Fabrizi L, McEwan A, Oh T, Woo EJ and Holder DS 2009. An electrode addressing protocol for imaging brain function with electrical impedance tomography using a 16-channel semi-parallel system Physiol. Meas [DOI] [PubMed] [Google Scholar]
- Fouchard A, Coizet V, Sinniger V, Clarendon D, Pemet-Gallay K, Bonnet S and David O 2016. Functional monitoring of peripheral nerves from electrical impedance measurements J. Physiol 110 361–71 [DOI] [PubMed] [Google Scholar]
- Gilad O and Holder DS 2009. Impedance changes recorded with scalp electrodes during visual evoked responses: Implications for Electrical Impedance Tomography of fast neural activity Neuroimage [DOI] [PubMed] [Google Scholar]
- Graham BM and Adler A 2007. Electrode placement configurations for 3D EIT Physiol. Meas 28 S29–14 [DOI] [PubMed] [Google Scholar]
- Holder D 2005. Electrical impedance tomography: methods, history, and applications (Institute of Physics Pub; ) [Google Scholar]
- Hope J, Aristovich K, Chapman CAR, Volschenk A, Vanholsbeeck F and McDaid A 2019. Extracting impedance changes from a frequency multiplexed signal during neural activity in sciatic nerve of rat: preliminary study in vitro Physiol. Meas 40 034006. [DOI] [PubMed] [Google Scholar]
- Hope J, Vanholsbeeck F and McDaid A 2018a. A model of electrical impedance tomography implemented in nerve-cuff for neural-prosthetics control. Physiol. Meas 39 044002 Online: http://www.ncbi.nlm.nih.gov/pubmed/29547133 [DOI] [PubMed] [Google Scholar]
- Hope J, Vanholsbeeck F and McDaid A 2018b. Drive and measurement electrode patterns for electrode impedance tomography (EIT) imaging of neural activity in peripheral nerve Biomed. Phys. Eng. Express 4 067002. [DOI] [PubMed] [Google Scholar]
- Jehl M, Dedner A, Betcke T, Aristovich K, Klofkom R and Holder D 2015. A Fast Parallel Solver for the Forward Problem in Electrical Impedance Tomography IEEE Trans. Biomed. Eng 62 126–37 [DOI] [PubMed] [Google Scholar]
- Licursi de Alcantara AC, Salgado HC and Sassoli Fazan VP 2008. Morphology and morphometry of the vagus nerve in male and female spontaneously hypertensive rats Brain Res 1197 170–80 [DOI] [PubMed] [Google Scholar]
- Liston A, Bayford R and Holder D 2012. A cable theory based biophysical model of resistance change in crab peripheral nerve and human cerebral cortex during neuronal depolarisation: implications for electrical impedance tomography of fast neural activity in the brain Med. Biol. Eng. Comput 50 425–37 [DOI] [PubMed] [Google Scholar]
- Liu A and Joe B 1994. Relationship between tetrahedron shape measures BIT 34 268–87 [Google Scholar]
- Nielsen TN, Kurstjens GAM and Struijk JJ 2011. Transverse versus longitudinal tripolar configuration for selective stimulation with multipolar cuff electrodes IEEE Trans. Biomed. Eng 58 913–9 [DOI] [PubMed] [Google Scholar]
- Oh T, Gilad O, Ghosh A, Schuettler M and Holder DS 2011. A novel method for recording neuronal depolarization with recording at 125-825 Hz: Implications for imaging fast neural activity in the brain with electrical impedance tomography Med. Biol. Eng. Comput [DOI] [PubMed] [Google Scholar]
- Sabbah HN, Ilsar I, Zaretsky A, Rastogi S, Wang M and Gupta RC 2011. Vagus nerve stimulation in experimental heart failure Heart Fail. Rev 16 171–8 [DOI] [PMC free article] [PubMed] [Google Scholar]
- Stein RB, Nichols TR, Jhamandas J, Davis L and Charles D 1977. Stable long-term recordings from cat peripheral nerves. Brain Res. 128 21–38 Online: http://www.ncbi.nlm.nih.gov/pubmed/871910 [DOI] [PubMed] [Google Scholar]
- Thompson N, Mastitskaya S and Holder D 2019a. Avoiding off-target effects in electrical stimulation of the cervical vagus nerve: Neuroanatomical tracing techniques to study fascicular anatomy of the vagus nerve J. Neurosci. Methods 325. [DOI] [PMC free article] [PubMed] [Google Scholar]
- Thompson N, Ravagli E, Mastitskaya S, Iacoviello F, Aristovich K, Perkins J, Shearing PR and Holder D 2019b. MicroCT optimisation for imaging fascicular anatomy in peripheral nerves bioRxiv 818237, doi: 10.1101/818237 [DOI] [PMC free article] [PubMed] [Google Scholar]
- Ventouras E, Papageorgiou C, Uzunoglu N, Koulouridis S, Rabavilas A and Stefanis C 2000. Tikhonov Regularization Techniques in Simulated Brain Electrical Tomography Biotechnol. Biotechnol. Equip 14 95–9 [Google Scholar]
- Verlinden TJM, Rijkers K, Hoogland G and Herrler A 2016. Morphology of the human cervical vagus nerve: Implications for vagus nerve stimulation treatment Acta Neurol. Scand 133 173–82 [DOI] [PubMed] [Google Scholar]
- Vonck K, Thadani V, Gilbert K, Dedeurwaerdere S, De Groote L, De Herdt V, Goossens L, Gossiaux F, Achten E, Thiery E, Vingerhoets G, Van Roost D, Caemaert J, De Reuck J, Roberts D, Williamson P and Boon P 2004. Vagus Nerve Stimulation for Refractory Epilepsy: A Transatlantic Experience J. Clin. Neurophysiol 21 283–9 [DOI] [PubMed] [Google Scholar]
- Wagenaar J and Adler A 2016. Electrical impedance tomography in 3D using two electrode planes: characterization and evaluation Physiol. Meas 37 922–37 [DOI] [PubMed] [Google Scholar]


