Abstract
Background
Aberrant gene expression occurs in almost all diseases including constrictive pericarditis (CP). However, the dysregulation of genes underlying the CP remains unclear. This study aims to investigate the potential molecular mechanisms underlying CP and screen hub genes critical for the pathogenesis of CP.
Methods
Differentially expressed mRNAs, miRNAs, lncRNAs and circRNAs in pericardial tissues were screened using RNA-seq in CP patients and controls. Furthermore, functional annotation analysis and protein-protein interaction (PPI) network were carried out to investigate the potential key pathways and identify hub genes in CP. Subsequently, a ceRNA network was established and the key circRNAs were determined by Gene Set Enrichment Analysis (GSEA). Finally, the corresponding RNA-seq results were confirmed and validated with a quantitative real time-PCR (qRT-PCR).
Results
Functional annotation analysis revealed that differentially expressed mRNAs (DEMs) mainly participated in inflammatory response related pathways and the 10 top genes with the highest degree in PPI network were considered as the hub genes. In addition, a total of 377 regulatory relationships among the differentially expressed genes (DEGs) could be constructed, from which a subsequent ceRNA network was also established, while the circRNAs were further validated with qRT-PCR and the key biological pathways were identified using GSEA as well.
Conclusions
The genes determined to have altered expression levels in CP may participate in a number of biological signaling processes leading to inflammation and fibrosis frequently encountered in CP, and, therefore, our novel findings may provide an insight into the pathogenesis, molecular biomarkers, and potential therapeutic targets in CP.
Keywords: Constrictive pericarditis (CP), circRNAs, fibrosis, inflammation, bioinformatics
Introduction
Constrictive pericarditis (CP) is secondary to acute pericarditis and represents the final stage of chronic inflammation of the pericardium. The altered hemodynamics due to a poor filling of the heart caused by the limitation of the stiff pericardium serves as one of major factors contributing to heart failure (1). Although many risk factors were proposed for their potential involvements in patients with CP such as previous cardiac surgery and radiation therapy, most patients present with the idiopathic constrictive pericarditis (IPCP) (2,3). For patients at the end stage of pericardial inflammation, the surgical resection is the primary treatment option for relieving clinical symptoms (4,5), but such procedures also provoke to the formation of fibrosis of the remaining uncut pericardium, causing repeat surgery and increasing mortality. Up to today, there is no other effective treatment to control the progression of the disease (6).
Recent studies show that changes in gene expression could be directly associated with inflammation and the subsequent formation of fibrosis (7-11), the key pathological process underlying the CP. Furthermore, an array of changes in non-coding RNAs, including microRNAs (miRNAs), long non-coding RNAs (lncRNAs) and circular RNAs (circRNAs) were believed to play a critical role in the relevant molecular signaling pathways and biological processes leading to fibrosis. For instance, as competing endogenous RNAs (ceRNA), both lncRNAs and circRNAs are capable of competing against binding of a specific miRNA on its target mRNA, thereby serving as a “miRNA sponge” to affect the expression of downstream genes (12,13). Nevertheless, how these molecular substrates mediate the CP is still poorly understood.
High-throughput sequencing and bioinformatics analysis have been widely exploited to identify specific genes associated with various diseases (14,15). These interesting findings promoted us to explore if there are abnormally expressed genes and signaling pathways involved in the inflammation and fibrosis processes of CP. In the current study, we analyzed the differentially gene expression profile in CP including mRNAs, miRNAs, lncRNAs and circRNAs, and constructed PPI and ceRNA network on this basis. Our novel findings provided critical information for elucidating molecular mechanisms underlying CP and developing both diagnostic tools and therapeutic intervention in the future.
Methods
Clinical specimens
Pericardial specimens were collected from six IPCP patients (four males and two females with a mean age of 49 years old and a range of 23–63 years old) who underwent pericardial resection. Additionally, normal pericardial specimens were obtained from six patients who received the same surgical procedures for medical conditions unrelated to CP. The diagnosis of CP and the normal tissues was independently confirmed by two pathologists. The baseline characteristics of the patients were shown in Table 1. After the surgical resections, the fresh specimens were immediately preserved in liquid nitrogen and stored at −80 °C for further experiments.
Table 1. Baseline characteristics of patients.
| Group | Patient No. | Age (y) | Sex | Cause (operation) | Use |
|---|---|---|---|---|---|
| Case | C2-3 | 23 | F | IPCP (pericardial resection) | Seq + qPCR |
| Case | C4-1 | 48 | M | IPCP (pericardial resection) | Seq + qPCR |
| Case | CP2-2 | 51 | M | IPCP (pericardial resection) | Seq + qPCR |
| Case | CP3-2 | 57 | M | IPCP (pericardial resection) | qPCR |
| Case | C5-2 | 52 | M | IPCP (pericardial resection) | qPCR |
| Case | C6-10 | 63 | F | IPCP (pericardial resection) | qPCR |
| Normal | N3-1 | 48 | M | infective endocarditis (aortic valve replacement) | Seq + qPCR |
| Normal | N6-1 | 53 | M | coronary artery bypass grafting | Seq + qPCR |
| Normal | N7-2 | 27 | F | aortic stenosis (aortic valve replacement) | Seq |
| Normal | N5-1 | 60 | M | aortic stenosis (aortic valve replacement) | qPCR |
| Normal | N4-2 | 62 | M | Mitral stenosis (mitral valve replacement) | qPCR |
| Normal | N2-2 | 44 | F | Mitral stenosis (mitral valve replacement) | qPCR |
F, female; M, male; IPCP, idiopathic constrictive pericarditis; Seq, high-throughput sequencing; qPCR, quantitative real time-PCR.
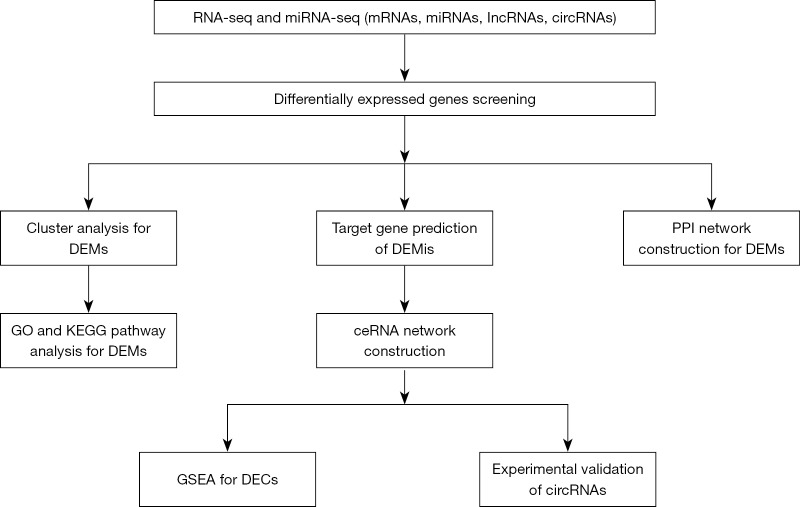
All pericardial specimens were obtained from the Department of cardiac surgery in Shengjing Hospital of China Medical University from 2017 to 2019. This study was approved by the Ethical Committee of Shengjing Hospital (approval number: 2017PS06K). All patients recruited in this study provided informed consent with adequate understanding. The detailed flow chart of this study design was shown in Figure 1.
Figure 1.
Flow chart of the present study. DEMs, differentially expressed mRNAs; DEMis, differentially expressed miRNAs; GO, gene ontology; KEGG, Kyoto Encyclopedia of Genes and Genomes; PPI, protein-protein interaction; ceRNA, competing endogenous RNA; GSEA, Gene Set Enrichment Analysis; DECs, differentially expressed circRNAs.
RNA extraction and RNA-seq analysis
Total RNA was extracted from the CP and control tissues using Trizol reagent (Invitrogen life technologies, Carlsbad, CA) following the manufacturer’s protocol. Illumina transcriptome sequencing RNA was collected with oligo (dT) magnetic beads according to the manufacturer’s specifications. Following fragmenting the RNAs into short sequences with fragmentation buffer, KAPA Stranded RNA-Seq Library Prep Kit (Illumina) was applied to synthesize the cDNA. Finally, sample integrity was assessed on an Agilent 2100 Bioanalyzer. RNA-seq and miRNA-seq of the samples were performed with Illumina HiSeq 4000.
Data processing and differentially expressed genes screening
Fragments-per-kilobase-million (FPKM) in samples was calculated using Cufflinks. The differentially expressed genes (DEGs) between CP and control samples were screened using R software edgeR package (16). The criteria for defining a DEG were as follows: |log2(fold change)| >1, and P value <0.05. Raw and processed original data of RNA-seq and miRNA-seq have been deposited in Gene Expression Omnibus (GEO) and were accessible through GEO at accession number GSE122903 and GSE122904.
Functional enrichment analysis
To determine the biological significance of an arrays of genes critical for the formation of CP, the functional enrichment analysis was performed using clusterProfiler from Bioconductor (17). Gene ontology (GO) includes three categories: biological process (BP), cellular component (CC) and molecular function (MF). Furthermore, the enriched GO terms and Kyoto Encyclopedia of Genes and Genomes (KEGG) pathways with a P value <0.05 were considered significant. The top 10 GO terms and KEGG pathways were visualized using R software ggplot2 package (18).
PPI network construction
The PPI network of CP genes was constructed using STRING (a search tool for the retrieval of interacting genes, http://string-db.org) online database (19). In the current study, the combined score ≥0.7 was considered as the cutoff criterion. The PPI network was visualized on a free bioinformatics platform provided by Cytoscape, (https://cytoscape.org/). Cytoscape app MCODE was also used to screen the potential hub modules.
The ceRNA network construction
MiRNAs with P value <0.01 and |log2(fold change)| ≥1 and circRNAs with P value <0.05 and |log2(fold change)| ≥2 were selected for the construction of the ceRNA network. The miRwalk2.0 and starbase 3.0 were employed to predict the interactions of mRNA-miRNA and miRNA-circRNA, respectively (20,21). By further alignment and prediction of the target genes, a ceRNA network was constructed. KEGG pathway enrichment analysis of the genes within the network was also performed using R software.
GSEA
Potential pathways and biological processes involved in the up-regulated differentially expressed circRNAs (DECs) from the ceRNA network were analyzed using GSEA (http://www.broadinstitute.org/gsea). The gene sets of KEGG were adopted from the Molecular Signatures Database (MSigDB) (22). After repeating 1,000 times to normalize the data according to the default weighted enrichment statistical method, the gene sets with a false discovery rate (FDR) value <0.05 were considered to be significantly significant.
Validation of candidate circRNAs using qRT-PCR
Trizol reagent (Invitrogen) was applied to extract total RNA from the collected tissues according to the manufacturer’s protocol. Total RNA was reverse transcribed into cDNA using SuperScriptTM III Reverse Transcriptase (Invitrogen). The qRT-PCR was conducted in triplicate for each sample by using the comparative Ct method following the manufacturer’s protocol. The primers used were listed in Table 2. The expression of hsa_circ_0008679, hsa_circ_0006238, hsa_circ_13093 and hsa_circ_0070659 was normalized with β-actin.
Table 2. Primer sequences of PCR.
| Gene | Forward primer (5'–3') | Reverse primer (5'–3') |
|---|---|---|
| β-actin (H) | GTGGCCGAGGACTTTGATTG | CCTGTAACAACGCATCTCATATT |
| hsa_circ_0006238 | GCTGAATTGGAGAGCTGAACA | GGGATGCCGTTACTTGGTT |
| hsa_circ_0008679 | TTACCAAGCAGCAGAAAAATCTC | CTTCCTGTAAAGCCTGTTTCAAT |
| hsa_circ_0013093 | CAAACTAGCTGGAAACCCATT | CACTCACATTCTCAGAAAACGG |
| hsa_circ_0070659 | GGACCTACAAAATGAAGATAAGGG | ACACGCAAAACCTGCTGTGA |
Statistical analysis was performed using GraphPad Prism 8. The differences between two groups were compared by using student’s t-test.
Results
The presence of fibrosis in CP tissues
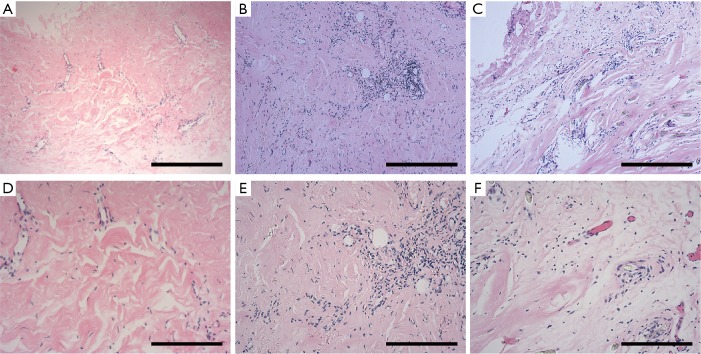
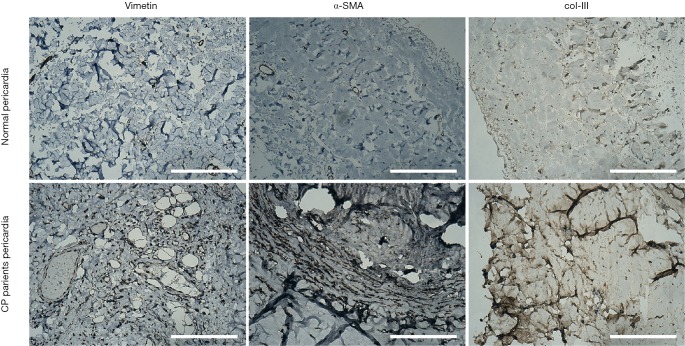
Histological results (Figure 2) of the pericardia from CP patients indicated the presence of inflammation and fibrosis which was confirmed by two pathologists independently. Immunohistological analysis (Figure 3) further revealed high levels of α-smooth muscle actin (α-SMA) isoform, a well-accepted marker of myofibroblast differentiation and fibrosis, along with an abundance of vimentin and collagen type III (col-III) in the fibrous pericardia of CP tissues but not in normal pericardium. Since de novo expressed α-SMA was usually incorporated into neo-formed connective tissue, confirming that there were inflammatory processes occurred in these pericardia, thus these tissues were used in the subsequent experiments.
Figure 2.
Histology of the pericardial specimens from CP patients. Paraffin-embedded pericardial specimens were stained with hematoxylin-eosin (H&E). All these pericardial tissues manifested fibrosis and inflammatory cells infiltration. The inflammatory cell response to injury was mainly composed of lymphocyte and plasmocyte. H&E also showed mesodermal hyperplasia. Bar =400 µm (A,B,C) and 200 µm (D,E,F). CP, constrictive pericarditis.
Figure 3.
Immunohistological analysis of paraffin-embedded CP and control pericardium. Pericardium tissues in CP were shown increased α-Smooth muscle actin (α-SMA) and collagen type III (col-III) compared to tissues in normal, suggesting that fibrosis changes occurred in CP pericardial specimens. Representative photographs were shown. Bar =200 µm. CP, constrictive pericarditis.
The identification of differentially expressed mRNAs, miRNAs, lncRNAs and circRNAs in CP tissues
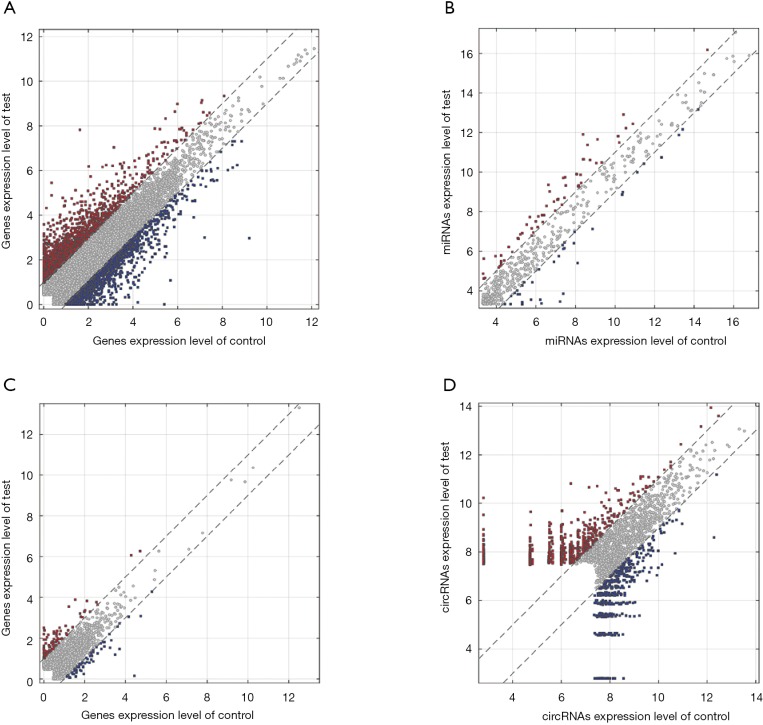
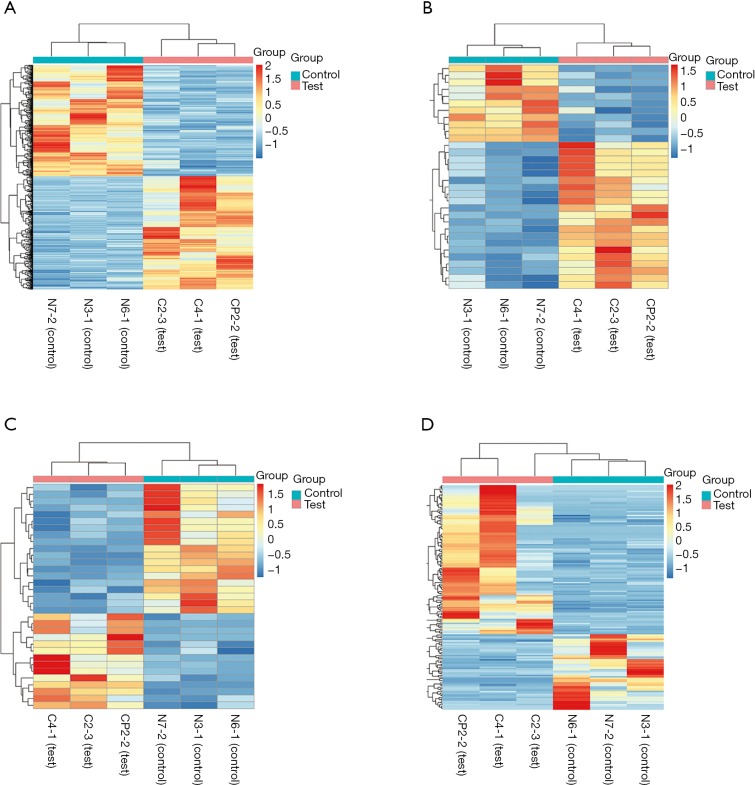
Differentially expressed mRNAs, miRNAs, lncRNAs and circRNAs with |log2(fold change)| >1 and P value <0.05 were identified from three CP specimens and three controls first collected. The scatter plot and heatmap presented the variation of gene expression between CP and control group were shown in Figures 4 and 5. 681 DEMs were screened, and among them, there were 344 up-regulated mRNAs and 337 down-regulated mRNAs (Figures 4A,5A). A total of 32 DEMis were isolated and, among them, 21 DEMis were up-regulated while 11 were down-regulated (Figures 4B,5B). Furthermore, 33 differentially expressed lncRNAs (DELs) were determined, including 14 up-regulated and 19 down-regulated (Figures 4C,5C). Finally, of 155 DECs identified, 103 were up-regulated while 52 were down-regulated (Figures 4D,5D).
Figure 4.
Differentially expressed mRNAs, miRNAs, lncRNAs and circRNAs expression between CP and matched control samples. (A) Scatter plot of mRNAs; (B) Scatter plot of miRNAs; (C) Scatter plot of lncRNAs; (D) Scatter plot of circRNAs. The values on the x- and y-axes are the averaged normalized signal values of groups of samples (log2-scaled). The grey lines are fold change lines. The genes above the higher line and below the lower line indicate >2-fold change between the two compared groups. CP, constrictive pericarditis.
Figure 5.
Heatmap for DEMs, DEMis, DELs and DECs in the two compared groups. (A) Differentially expressed mRNAs (DEMs); (B) differentially expressed miRNAs (DEMis); (C) differentially expressed lncRNAs (DELs); (D) differentially expressed circRNAs (DECs).
Functional annotation of DEMs
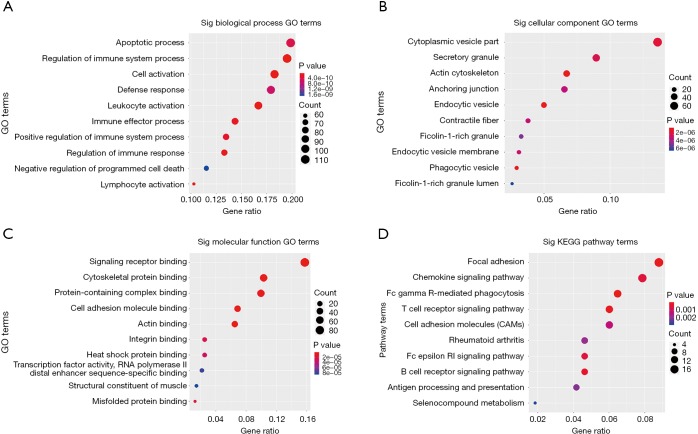
GO and KEGG pathway enrichment analysis were carried out to explore potential biological processes and pathways enriched by DEMs. The top ten enriched BP, CC, MF terms and KEGG pathways are presented in Figure 6. Notably, the enriched BP terms were mainly related to inflammation processes, such as apoptotic process, regulation of immune system process, cell activation and leukocyte activation. Similar to GO terms, KEGG pathway enrichment analysis showed that DEMs are mainly involved in FcγR-mediated phagocytosis, T cell receptor signaling pathway, B cell receptor signaling pathway, cell adhesion molecules (CAMs), focal adhesion and chemokine signaling pathways. In addition, to intensify the reliability, the functional annotation analysis of the up-regulated DEMs was also performed and the results of KEGG pathway enrichment showed that up-regulated DEMs were mainly enriched in inflammatory response-related pathways such as chemokine signaling pathway, T cell receptor signaling pathway and FcγR-mediated phagocytosis (Table 3).
Figure 6.
GO and KEGG pathway enrichment analysis for DEMs. (A) BP; (B) CC; (C) MF; (D) KEGG. GO, gene ontology; KEGG, Kyoto Encyclopedia of Genes and Genomes; BP, biological process; CC, cellular component; MF, molecular function.
Table 3. KEGG pathway enrichment analysis for the up-regulated DEMs (top 10 terms).
| ID | Description | Count | Gene ratio | P value | Q value |
|---|---|---|---|---|---|
| hsa04666 | Fc gamma R-mediated phagocytosis | 11 | 11/131 | 6.85121E-06 | 0.000635 |
| hsa04062 | Chemokine signaling pathway | 15 | 15/131 | 1.6275E-05 | 0.000731 |
| hsa04660 | T cell receptor signaling pathway | 11 | 11/131 | 2.36816E-05 | 0.000731 |
| hsa04514 | Cell adhesion molecules (CAMs) | 12 | 12/131 | 4.2636E-05 | 0.000987 |
| hsa04141 | Protein processing in endoplasmic reticulum | 13 | 13/131 | 8.0365E-05 | 0.001489 |
| hsa04662 | B cell receptor signaling pathway | 8 | 8/131 | 0.000232144 | 0.003274 |
| hsa04670 | Leukocyte transendothelial migration | 10 | 10/131 | 0.00024744 | 0.003274 |
| hsa04612 | Antigen processing and presentation | 8 | 8/131 | 0.000305117 | 0.00343 |
| hsa04664 | Fc epsilon RI signaling pathway | 8 | 8/131 | 0.000333242 | 0.00343 |
| hsa04940 | Type I diabetes mellitus | 6 | 6/131 | 0.000429755 | 0.003981 |
KEGG, Kyoto Encyclopedia of Genes and Genomes; DEMs, differentially expressed mRNAs.
PPI network construction of DEMs
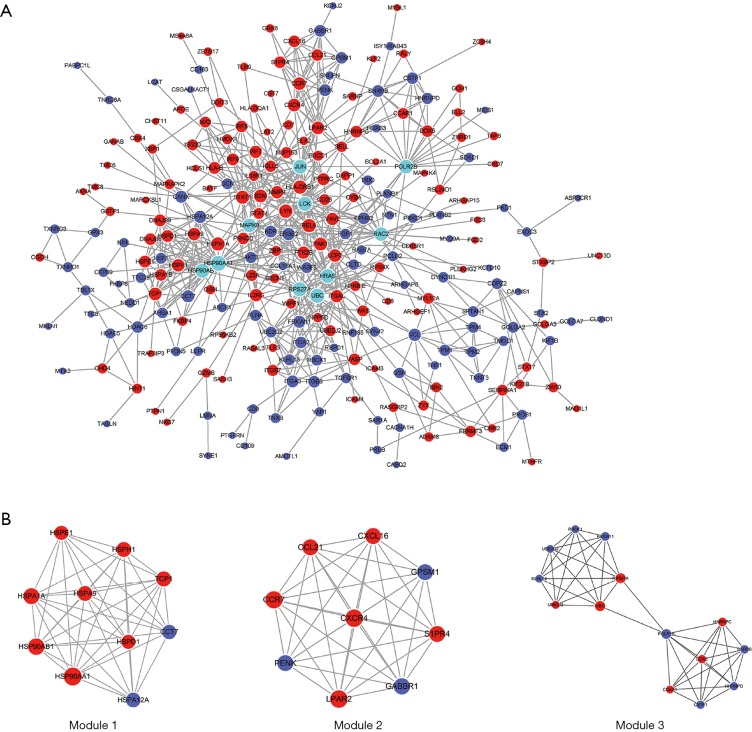
After removal of the unconnected nodes and nodes could not connect to the main network, a PPI network consisting of 699 interactions among 248 nodes was established and was shown in Figure 7. Among them, the 10 top genes with the highest degree such as POLR2B, HRAS, JUN, UBC, HSP90AB1, LCK, RPS27A, MAPK8, HSP90AA1 and RAC2 were identified and considered as hub genes (Figure 7A). MCODE in Cytoscape was applied to identify hub module in PPI network, which further revealed the biological functions of the key protein complexes with the highest degree of inter-connections in CP tissues. As illustrated in Figure 7B, top three modules with the highest score were selected as the potential hub modules (Module 1, 2, 3), where the hub genes such as HSP90AB1, HSP90AA1, POLR2B, UBC and RPS27A were included.
Figure 7.
PPI network. The red nodes represent up-regulated genes, while the purple nodes represent down-regulated genes and the cyan nodes represent top 10 genes with the highest degree. The size of nodes represents the degree of each node. The edges represent interactions. PPI, protein-protein interactions.
The ceRNA network and qRT-PCR
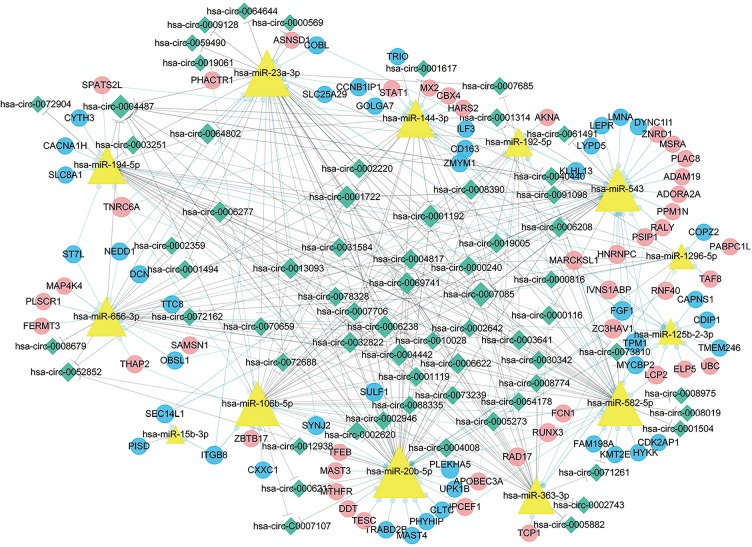
By building a ceRNA network, a role of mRNAs, lncRNAs and circRNAs after competitively combined with miRNAs in the progression of the CP was further investigated. As shown in Figure 8, a total of 377 interactions between the selected genes were identified and visualized. It was notably that a multitude of circRNAs (green rhombuses) were included, which serve as ceRNAs to capture down-stream miRNAs (yellow triangles), thereby regulating the expression of mRNAs (red and blue filled circles, respectively) to influence the phenotype. In addition, hsa-miR-20b-5p, hsa-miR-23a-3p, hsa-miR-656-3p, hsa-miR-194-5p and hsa-miR-543 were also found to possess the highest degree in the network. Furthermore, the DEMs within the network were found to mainly enrich in hypertrophic cardiomyopathy and dilated cardiomyopathy as demonstrated (P value <0.05) in Figure 9.
Figure 8.
The ceRNA network. The blue rounds represent down-regulated protein coding mRNAs, while the red rounds represent up-regulated protein coding mRNAs. The yellow triangles represent miRNAs. The green rhombuses represent circRNAs. The gray solid lines represent the circRNA-miRNA regulatory relationships and the light green lines represent miRNA-mRNA regulatory relationships. The size of the node represents its degree in the network, and the bigger is the node, the higher is the degree. ceRNA, competing endogenous RNA.
Figure 9.

KEGG pathway enrichment analysis for DEMs within the ceRNA network. KEGG, Kyoto Encyclopedia of Genes and Genomes; DEMs, differentially expressed mRNAs; ceRNA, competing endogenous RNA.
In addition, we analyzed the expression of a subset of DECs with high fold change in the ceRNA network. qRT-PCR analysis of CP and control tissues was used to validate the following up-regulated circRNAs, namely hsa_circ_0008679 (fold change =3.98), hsa_circ_0006238 (fold change =34.53), hsa_circ_0013093 (fold change =7.94) and hsa_circ_0070659 (fold change =35.16), respectively. The results showed that the expression patterns of hsa_circ_0008679, hsa_circ_0006238 and hsa_circ_0013093 were consistent with the RNA-seq results. Moreover, Hsa_circ_0070659 demonstrated a similar tendency in expression detected by qRT-PCR and RNA-seq analysis (P value >0.05) (Figure 10).
Figure 10.
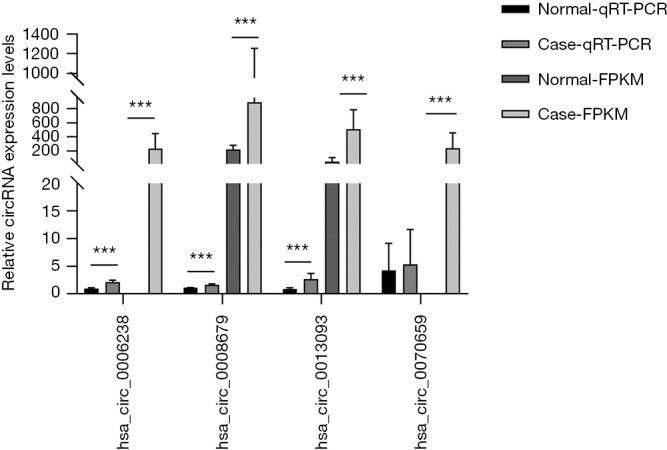
qRT-PCR and RNA-seq results on 4 circRNAs in clinical specimens. For qRT-PCR, the target gene expression was normalized to β-actin (ΔCt). For RNA-seq, the expression level was normalized to FPKM. Results are presented as mean ± SD (Normal-qRT-PCR, n=5; Case-qRT-PCR, n=6; Normal-FPKM, n=3; Case-FPKM, n=3). ***, P<0.001.
GSEA
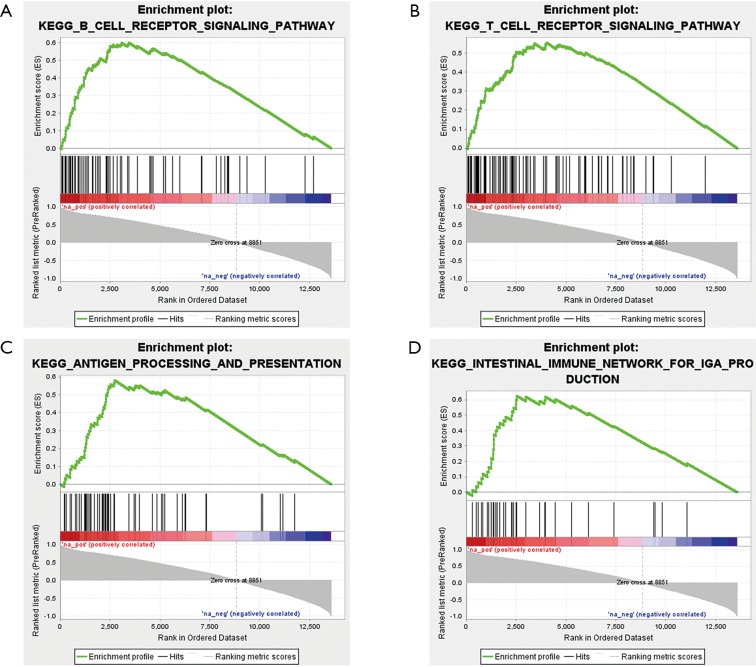
After identifying differentially expressed circRNAs in the ceRNA network, GSEA was employed to explore potential signaling pathways of these circRNAs. As an example, part of the KEGG pathway enrichment analysis results of circRNA hsa_circ_0008679 were shown in Figure 11. We found that hsa_circ_0008679 was involved in many inflammation-related pathways. The gene sets of CP were enriched in a total of 50 pathways, including “B cell receptor signaling pathway” (Figure 11A), “T cell receptor signaling pathway” (Figure 11B), “antigen processing and presentation” (Figure 11C) and “intestinal immune network for IgA production” (Figure 11D), respectively. Collectively, these signaling pathways may participate in the biological responses to tissue injury following biological insults.
Figure 11.
KEGG pathway enrichment analysis of circRNA hsa_circ_0008679. (A) Enrichment of genes in the KEGG B cell receptor signaling pathway; (B) enrichment of genes in the KEGG T cell receptor signaling pathway; (C) enrichment of genes in the KEGG antigen processing and presentation; (D) enrichment of genes in the KEGG intestinal immune network for IgA production. KEGG, Kyoto Encyclopedia of Genes and Genomes.
Discussion
In this study, we employed RNA-seq on the tissues isolated from patients with CP and detected a number of the differentially expressed genes such as mRNAs, miRNAs, lncRNAs and circRNAs. An array of hub genes and potential signaling pathways associated with inflammation and fibrosis in CP were identified by functional annotation analysis and the construction of PPI network based on the DEGs. The ceRNA network was constructed and we found that genes in the network were mainly involved in pathway of hypertrophic cardiomyopathy and dilated cardiomyopathy. More importantly, several circRNAs such as hsa_circ_0008679, hsa_circ_0006238 and hsa_circ_0013093 were confirmed to be up-regulated in CP as verified by qRT-PCR. Finally, GSEA analysis of these circRNAs within the ceRNA network revealed their functions in inflammation related biological pathways.
We took advantage of RNA-seq to screen 681 DEMs, 32 DEMis, 33 DELs and 155 DECs in this CP cohort study. The results of functional enrichment analysis revealed that DEMs were primarily enriched in several inflammatory processes related GO biological processes. Furthermore, KEGG enrichment analysis also revealed that up-regulated DEMs were highly enriched in the pathways related to inflammation, such as Fc gamma R-mediated phagocytosis, T cell receptor signaling pathway, B cell receptor signaling pathway and chemokine signaling pathway, indicating that prominent inflammation processes may underline the CP formation. Our findings are consistent with the notion that overexpression genes were involved in fibrosis and inflammation as seen in tuberculous pericarditis samples (23).
The PPI network which was constructed based on aberrantly expressed mRNAs in CP revealed a group of hub genes with the highest degree of intra-module connectivity such as POLR2B, HRAS, JUN, UBC, HSP90AB1, LCK, RPS27A, MAPK8, HSP90AA1 and RAC2. Among the hub genes, HSP90AB1, HSP90AA1, POLR2B, UBC and RPS27A were contained in the three hub modules identified by MCODE. With their known biological activity in various biological processes, these hub genes could constitute molecular substrates facilitating fibrosis of CP. For example, proteins coded by MAPK8, RAC2 and JUN were involved in inflammatory response related pathways such as focal adhesion, T cell receptor signaling pathway, B cell receptor signaling pathway and cell adhesion molecules (CAMs) (24-26). In addition, TGFβRI complex consisting of extracellular HSP90AA1 and HSP90AB1 binds to TGFβ receptor I participates in TGFβ-mediated collagen production in myocardial fibroblasts (27). These results have been confirmed in an aortic banding model with pathological cardiac remodeling as level of Hsp90 expression increased in remodeled mice (27). Overexpressed MAPK8, a C-Jun N-Terminal Kinase 1 and an potent factor for promoting fibrosis of liver and kidney (28,29), has been shown to accelerate myocardial fibrosis in diabetes (30). Meanwhile high activation of MAPK8 is reported in high breast density and tumor stroma, which is associated with fibrosis, inflammation and dryness (31). RAC2 and JUN also contribute to fibrosis of lung, liver and kidney (32,33). Taken together, these hub genes are closely related to inflammation and fibrosis, and their function in CP warrants further study.
By further alignment and prediction of the selected differentially expressed genes, a ceRNA regulatory network was established. Interestingly, the genes in the network could modulate cardiac remodeling, because they were enriched in several pathways associated with hypertrophic cardiomyopathy and dilated cardiomyopathy. It is notably that hsa-miR-20b-5p, hsa-miR-656-3p, hsa-miR-106b-5p, hsa-miR-23a-3p, hsa-miR-194-5p and hsa-miR-543 could play a critical role in the pathogenesis of CP as suggested by the ceRNA network. There is evidence that hsa-miR-23a is up-regulated in hypertrophic cardiomyopathy and skeletal muscle atrophy, suggesting that miR-23a is highly correlated with cardiac hypertrophy (34-36). Nie et al. demonstrated that the overexpression of circulating miR-194 is significantly related to the impaired human cardiac function, including ejection fraction and NT-proBNP level (37). Even though the effects of hsa-miR-543, hsa-miR-656-3p, hsa-miR-106b-5p and hsa-miR-20b-5p in CP and other cardiac diseases have not been reported, therefore, our findings could form a framework to launch more investigations on this issue. Additionally, we also discovered STAT1 and RUNX3, two transcriptional factors in the network with known the role in inflammation. For instance, cross-talk between TLR and JAK/STAT signaling pathways suggests that STAT1 plays a significant role in TLR-induced inflammation (38). Lotem found that IL-2-activated CD8(+) T and NK cells contained three times higher Runx3-regulated genes that were common to both cell types. CD8(+) T and NK Runx3-regulated genes were mainly involved in immune-associated terms including lymphocyte activation, migration, cytotoxicity, proliferation and cytokine production, emphasizing the role of Runx3 played in inflammatory response (39). Runx3 has been confirmed to be overexpressed in mature CD8-T cell and NK cell, which plays a paramount role in cell proliferation and activation (40,41).
As far as we know, a molecular mechanism whereby how the circRNAs regulate the fibrosis of CP development has not been well addressed. In our study, the expression of hsa_circ_0008679, hsa_circ_0006238 and hsa_circ_0013093 were confirmed to be significantly up-regulated in CP samples but not in controls. As suggested by ceRNA network analysis, circRNAs serve as ceRNAs to capture miRNAs, and ultimately alter the gene expression pattern in CP formation, in which hsa_circ_0008679 functions as a sponge of hsa-miR-656-3p. Furthermore, both hsa_circ_0006238 and hsa_circ_0013093 serve as sponges of hsa-miR-106b-5p, hsa-miR-23a-3p and hsa-miR-20b-5p, respectively, to regulate down-stream gene expression. It has been reported that hsa-miR-23a positively promotes cardiac hypertrophy, but little is known about how hsa-miR-656-3p, hsa-miR-106b-5p and miR-20b-5p affect the progression of CP (35,36). The result of GSEA indicated that hsa_circ_0008679 was engaged in many pathways related to immune response. As we know, little has been discovered about the role of hsa_circ_0008679, the dysregulated circRNAs in our study possess the potential value in CP. Since our results were based on a computational prediction, more molecular biological experiments are needed to further delineate the roles of these circRNAs identified in CP. Taken together, our results provide novel evidence and insightful information regarding molecular mechanisms of CP.
Conclusions
We conducted RNA-seq on CP tissues to identify the differentially expressed mRNAs, miRNAs, lncRNAs and circRNAs, which may be potentially associated with CP development. Among them, hub genes such as JUN, MAPK8, HSP90AA1, HSP90AB1 and RAC2 were involved in the immune and fibrosis related pathway. In addition, hsa_circ_0008679, hsa_circ_0006238 and hsa_circ_0013093 were identified to be differentially expressed in CP. Taken together, our results might provide a novel insight for identifying biomarkers and potential therapeutic targets in CP management.
Supplementary
The article’s supplementary files as
Acknowledgments
Funding: This work was supported by the National Natural Science Foundation of China (grant No. 81571686), Young Scientists Fund of the National Natural Science Foundation of China (grant No. 81901763) and Key Projects of Liaoning Natural Science Foundation (grant No. 20180530064).
Ethical Statement: The authors are accountable for all aspects of the work in ensuring that questions related to the accuracy or integrity of any part of the work are appropriately investigated and resolved. This study was approved by the Ethical Committee of Shengjing Hospital (approval number: 2017PS06K). Written informed consent was obtained from the patient for publication of this study and any accompanying images.
Footnotes
Data Sharing Statement: Available at http://dx.doi.org/10.21037/atm-20-2912.
Conflicts of Interest: All authors have completed the ICMJE uniform disclosure form (available at http://dx.doi.org/10.21037/atm-20-2912). The authors have no conflicts of interest to declare.
References
- 1.Oliver I, Treasure T. Constrictive pericarditis. BMJ 2012;345:e3995. 10.1136/bmj.e3995 [DOI] [PubMed] [Google Scholar]
- 2.Imazio M. Idiopathic recurrent pericarditis as an immune-mediated disease: current insights into pathogenesis and emerging treatment options. Expert Rev Clin Immunol 2014;10:1487-92. 10.1586/1744666X.2014.965150 [DOI] [PubMed] [Google Scholar]
- 3.Porta-Sánchez A, Sagristà-Sauleda J, Ferreira-González I, et al. Constrictive Pericarditis: Etiologic Spectrum, Patterns of Clinical Presentation, Prognostic Factors, and Long-term Follow-up. Revista Espanola De Cardiologia 2015;68:1092-100. [DOI] [PubMed] [Google Scholar]
- 4.Chowdhury UK, Subramaniam GK, Kumar AS, et al. Pericardiectomy for constrictive pericarditis: a clinical, echocardiographic, and hemodynamic evaluation of two surgical techniques. Ann Thorac Surg 2006;81:522-9. 10.1016/j.athoracsur.2005.08.009 [DOI] [PubMed] [Google Scholar]
- 5.Szabó G, Schmack B, Bulut C, et al. Constrictive pericarditis: risks, aetiologies and outcomes after total pericardiectomy: 24 years of experience. Eur J Cardiothorac Surg 2013;44:1023-8; discussion 1028. 10.1093/ejcts/ezt138 [DOI] [PubMed] [Google Scholar]
- 6.Welch TD. Constrictive pericarditis: diagnosis, management and clinical outcomes. Heart 2018;104:725-31. 10.1136/heartjnl-2017-311683 [DOI] [PubMed] [Google Scholar]
- 7.Camporeale A, Marino F, Papageorgiou A, et al. STAT3 activity is necessary and sufficient for the development of immune-mediated myocarditis in mice and promotes progression to dilated cardiomyopathy. EMBO Mol Med 2013;5:572-90. 10.1002/emmm.201201876 [DOI] [PMC free article] [PubMed] [Google Scholar]
- 8.Han L, Li X, Zhang G, et al. Pericardial interstitial cell senescence responsible for pericardial structural remodeling in idiopathic and postsurgical constrictive pericarditis. J Thorac Cardiovasc Surg 2017;154:966-75.e4. 10.1016/j.jtcvs.2017.03.115 [DOI] [PubMed] [Google Scholar]
- 9.Horita S, Nakamura M, Shirai A, et al. Regulatory roles of nitric oxide and angiotensin II on renal tubular transport. World J Nephrol 2014;3:295-301. 10.5527/wjn.v3.i4.295 [DOI] [PMC free article] [PubMed] [Google Scholar]
- 10.Jenke A, Holzhauser L, Löbel M, et al. Adiponectin promotes coxsackievirus B3 myocarditis by suppression of acute anti-viral immune responses. Basic Res Cardiol 2014;109:408. 10.1007/s00395-014-0408-y [DOI] [PubMed] [Google Scholar]
- 11.Liu X, Tan M, Gong D, et al. Characteristics of pericardial interstitial cells and their implications in pericardial fibrocalcification. J Mol Cell Cardiol 2012;53:780-9. 10.1016/j.yjmcc.2012.09.008 [DOI] [PubMed] [Google Scholar]
- 12.Jia N, Tong H, Zhang Y, et al. CeRNA Expression Profiling Identifies KIT-Related circRNA-miRNA-mRNA Networks in Gastrointestinal Stromal Tumour. Front Genet 2019;10:825. 10.3389/fgene.2019.00825 [DOI] [PMC free article] [PubMed] [Google Scholar]
- 13.Xu H, Wang C, Song H, et al. RNA-Seq profiling of circular RNAs in human colorectal Cancer liver metastasis and the potential biomarkers. Mol Cancer 2019;18:8. 10.1186/s12943-018-0932-8 [DOI] [PMC free article] [PubMed] [Google Scholar]
- 14.Huang H, Zhang Q, Ye C, et al. Identification of prognostic markers of high grade prostate cancer through an integrated bioinformatics approach. J Cancer Res Clin Oncol 2017;143:2571-9. 10.1007/s00432-017-2497-0 [DOI] [PMC free article] [PubMed] [Google Scholar]
- 15.Liu T, Zhang Q, Zhang J, et al. Y. EVmiRNA: a database of miRNA profiling in extracellular vesicles. Nucleic Acids Res 2019;47:D89-93. 10.1093/nar/gky985 [DOI] [PMC free article] [PubMed] [Google Scholar]
- 16.Robinson MD, McCarthy DJ, Smyth GK. edgeR: a Bioconductor package for differential expression analysis of digital gene expression data. Bioinformatics 2010;26:139-40. 10.1093/bioinformatics/btp616 [DOI] [PMC free article] [PubMed] [Google Scholar]
- 17.Yu G, Wang LG, Han Y, et al. clusterProfiler: an R package for comparing biological themes among gene clusters. Omics 2012;16:284-7. 10.1089/omi.2011.0118 [DOI] [PMC free article] [PubMed] [Google Scholar]
- 18.Ginestet C. ggplot2: Elegant Graphics for Data Analysis. Journal of the Royal Statistical Society Series a-Statistics in Society 2011;174:245.
- 19.Szklarczyk D, Morris JH, Cook H, et al. The STRING database in 2017: quality-controlled protein-protein association networks, made broadly accessible. Nucleic Acids Res 2017;45:D362-8. 10.1093/nar/gkw937 [DOI] [PMC free article] [PubMed] [Google Scholar]
- 20.Dweep H, Gretz N. miRWalk2.0: a comprehensive atlas of microRNA-target interactions. Nat Methods 2015;12:697. 10.1038/nmeth.3485 [DOI] [PubMed] [Google Scholar]
- 21.Li JH, Liu S, Zhou H, et al. starBase v2.0: decoding miRNA-ceRNA, miRNA-ncRNA and protein-RNA interaction networks from large-scale CLIP-Seq data. Nucleic Acids Res 2014;42:D92-7. 10.1093/nar/gkt1248 [DOI] [PMC free article] [PubMed] [Google Scholar]
- 22.Subramanian A, Tamayo P, Mootha VK, et al. Gene set enrichment analysis: a knowledge-based approach for interpreting genome-wide expression profiles. Proc Natl Acad Sci U S A 2005;102:15545-50. 10.1073/pnas.0506580102 [DOI] [PMC free article] [PubMed] [Google Scholar]
- 23.Matthews K, Deffur A, Ntsekhe M, et al. A Compartmentalized Profibrotic Immune Response Characterizes Pericardial Tuberculosis, Irrespective of HIV-1 Infection. Am J Respir Crit Care Med 2015;192:1518-21. 10.1164/rccm.201504-0683LE [DOI] [PMC free article] [PubMed] [Google Scholar]
- 24.Bonnardel J, T'Jonck W, Gaublomme D, et al. Stellate Cells, Hepatocytes, and Endothelial Cells Imprint the Kupffer Cell Identity on Monocytes Colonizing the Liver Macrophage Niche. Immunity 2019;51:638-54.e9. 10.1016/j.immuni.2019.08.017 [DOI] [PMC free article] [PubMed] [Google Scholar]
- 25.Thauland TJ, Hu KH, Bruce MA, et al. Cytoskeletal adaptivity regulates T cell receptor signaling. Sci Signal 2017. doi: . 10.1126/scisignal.aah3737 [DOI] [PMC free article] [PubMed] [Google Scholar]
- 26.Zhang Q, Wang HY, Liu X, et al. Cutting Edge: ROR1/CD19 Receptor Complex Promotes Growth of Mantle Cell Lymphoma Cells Independently of the B Cell Receptor-BTK Signaling Pathway. J Immunol 2019;203:2043-8. 10.4049/jimmunol.1801327 [DOI] [PMC free article] [PubMed] [Google Scholar]
- 27.García R, Merino D, Gomez JM, et al. Extracellular heat shock protein 90 binding to TGFbeta receptor I participates in TGFbeta-mediated collagen production in myocardial fibroblasts. Cell Signal 2016;28:1563-79. 10.1016/j.cellsig.2016.07.003 [DOI] [PubMed] [Google Scholar]
- 28.Ma FY, Flanc RS, Tesch GH, et al. A pathogenic role for c-Jun amino-terminal kinase signaling in renal fibrosis and tubular cell apoptosis. J Am Soc Nephrol 2007;18:472-84. 10.1681/ASN.2006060604 [DOI] [PubMed] [Google Scholar]
- 29.Zhao G, Hatting M, Nevzorova YA, et al. Jnk1 in murine hepatic stellate cells is a crucial mediator of liver fibrogenesis. Gut 2014;63:1159-72. 10.1136/gutjnl-2013-305507 [DOI] [PubMed] [Google Scholar]
- 30.Liu X, Qi F, Wu W. Effect of intervention in the diacylglycerol-protein kinase C signaling pathway on JNK1 expression and its downstream signaling in diabetic cardiomyopathy. Mol Med Rep 2014;9:979-84. 10.3892/mmr.2014.1904 [DOI] [PubMed] [Google Scholar]
- 31.Lisanti MP, Tsirigos A, Pavlides S, et al. JNK1 stress signaling is hyper-activated in high breast density and the tumor stroma: connecting fibrosis, inflammation, and stemness for cancer prevention. Cell Cycle 2014;13:580-99. 10.4161/cc.27379 [DOI] [PMC free article] [PubMed] [Google Scholar]
- 32.Joshi S, Singh AR, Wong SS, et al. Rac2 is required for alternative macrophage activation and bleomycin induced pulmonary fibrosis; a macrophage autonomous phenotype. PLoS One 2017;12:e0182851. 10.1371/journal.pone.0182851 [DOI] [PMC free article] [PubMed] [Google Scholar]
- 33.Schulien I, Hockenjos B, Schmitt-Graeff A, et al. The transcription factor c-Jun/AP-1 promotes liver fibrosis during non-alcoholic steatohepatitis by regulating Osteopontin expression. Cell Death Differ 2019;26:1688-99. 10.1038/s41418-018-0239-8 [DOI] [PMC free article] [PubMed] [Google Scholar]
- 34.Hernandez-Torres F, Aranega AE, Franco D. Identification of regulatory elements directing miR-23a-miR-27a-miR-24-2 transcriptional regulation in response to muscle hypertrophic stimuli. Biochim Biophys Acta 2014;1839:885-97. [DOI] [PubMed]
- 35.Lin Z, Murtaza I, Wang K, et al. miR-23a functions downstream of NFATc3 to regulate cardiac hypertrophy. Proc Natl Acad Sci U S A 2009;106:12103-8. 10.1073/pnas.0811371106 [DOI] [PMC free article] [PubMed] [Google Scholar]
- 36.Wang K, Lin ZQ, Long B, et al. Cardiac hypertrophy is positively regulated by MicroRNA miR-23a. J Biol Chem 2012;287:589-99. 10.1074/jbc.M111.266940 [DOI] [PMC free article] [PubMed] [Google Scholar]
- 37.Nie H, Pan Y, Zhou Y. Exosomal microRNA-194 causes cardiac injury and mitochondrial dysfunction in obese mice. Biochemical and Biophysical Research Communications 2018;503:3174-9. 10.1016/j.bbrc.2018.08.113 [DOI] [PubMed] [Google Scholar]
- 38.Luu K, Greenhill CJ, Majoros A, et al. STAT1 plays a role in TLR signal transduction and inflammatory responses. Immunol Cell Biol 2014;92:761-9. 10.1038/icb.2014.51 [DOI] [PubMed] [Google Scholar]
- 39.Lotem J, Levanon D, Negreanu V, et al. Runx3-mediated transcriptional program in cytotoxic lymphocytes. PLoS One 2013;8:e80467. 10.1371/journal.pone.0080467 [DOI] [PMC free article] [PubMed] [Google Scholar]
- 40.Cruz-Guilloty F, Pipkin ME, Djuretic IM, et al. Runx3 and T-box proteins cooperate to establish the transcriptional program of effector CTLs. J Exp Med 2009;206:51-9. 10.1084/jem.20081242 [DOI] [PMC free article] [PubMed] [Google Scholar]
- 41.Woolf E, Xiao C, Fainaru O, et al. Runx3 and Runx1 are required for CD8 T cell development during thymopoiesis. Proc Natl Acad Sci U S A 2003;100:7731-6. 10.1073/pnas.1232420100 [DOI] [PMC free article] [PubMed] [Google Scholar]
Associated Data
This section collects any data citations, data availability statements, or supplementary materials included in this article.
Supplementary Materials
The article’s supplementary files as


