Abstract
Background
To explore the key genes in renal tubular necrosis.
Methods
Microarray datasets GSE69644, GSE27168, and GSE2027 were downloaded from the Gene Expression Omnibus database. Differentially expressed genes (DEGs) were identified and we performed functional enrichment analysis. The network of protein interaction and gene interaction was constructed, and the module analysis was conducted using Cytoscape.
Results
A total of 543 DEGs and 13 hub genes were identified. The correlation analysis between the hub genes and the clinical characteristics of tubular necrosis indicated that the patients with high expression of SPAG5 and BIRC5 had better renal function. Patients with high expression of KIF14, KIF20A, MAD2L1, CKAP2, CDC25C, and CENPEN had poor renal function. Four of those hub genes participate in the cell cycle, apoptosis, and mismatch repair by regulating important genes in the pathway.
Conclusions
Our study suggests that CDC25C, MAD2L, BIRC5, and EXO1 participate in the cell cycle, apoptosis, and mismatch repair during renal tubule necrosis (RTN) and have an impact on renal function.
Keywords: Renal, tubular, necrosis, tubular injury
Introduction
Renal tubule necrosis (RTN) is an important intermediate process in the progression of kidney disease and the decline of renal function, which frequently occurs in Acute renal injury (AKI) and chronic kidney disease (CKD) (1,2). There are many causes of RTN, such as ischemia-reperfusion (3), drug-induced nephrotoxicities, such as cisplatin (4-6), aristolochic acid (7,8), and imbalance of regulatory factors, such as excessive expression of TGFβ (9,10). More and more basic studies have proved that abnormal gene expression and mutation affect the occurrence and development of RTN (11-13). Necrosis of renal tubules lacks early intervention measures, leading to increased mortality and mortality in patients with acute renal injury and chronic renal insufficiency (14).
It is essential to understand the precise molecular mechanism of RTN progress and to develop effective treatment strategies. In recent years, microarray technology and bioinformatic analysis have been widely used to searching genetic alterations at the genome level, which helps us identify the differentially expressed genes (DEGs) and functional pathways involved in the process of RTN. In the present study, three messenger RNA (mRNA) microarray datasets from the Gene Expression Omnibus (GEO) were downloaded and analyzed to obtain DEGs between necrotic tubules and normal tubules. Then we use Gene Ontology (GO), protein-protein interaction (PPI) network analyses and Kyoto Encyclopedia of Genes and Genomes (KEGG) pathway enrichment analysis those we can explore the potential molecular mechanism of RTN.
Methods
Microarray data
GEO (http://www.ncbi.nlm.nih.gov/geo) (15) is a public functional genomics data repository of high throughput gene expression data, chips, and microarrays. Three gene expression datasets [GSE69644 (16), GSE27168, and GSE20247 (17)] were downloaded from GEO (Affymetrix Human Genome U219 Array, Affymetrix Human Genome U133 Plus 2.0 Array, Illumina HumanWG-6 v3.0 expression beadchip). According to the annotation information in the platform, the probes were transformed into corresponding gene symbols. The GSE69644 dataset includes 2 tubular necrosis samples and 2 non-necrosis samples. GSE27168 includes 6 tubular necrosis samples and 6 non-tubular necrosis samples. GSE20247 includes 3 tubular necrosis samples and 3 non-necrosis samples.
Identification of DEGs
GEO2R is an interactive web tool to identify DEGs across experimental conditions. Using GEO2R (http://www.ncbi.nlm.nih.gov/geo/geo2r) to screen the DEGs between renal tubular necrosis and nonrenal tubular necrosis. DEGs screened from three data sets were used to map volcanoes. The adjusted P values (adj. P) and Benjamini and Hochberg false discovery rates were applied to supply a balance between the discovery of statistically significant genes and the limitations of false-positives. P value <0.05 and logFC (fold change) >1.5 were considered statistically significant adj.
KEGG and GO enrichment analyses of DEGs
GO is a major bioinformatics tool to annotate genes and analyze the biological process of these genes (18). Functional enrichment analysis of DEGs using the Biological Networks Gene Ontology tool (BiNGO) (19). (version 3.0.3) The plugin of Cytoscape. KEGG is a database resource for understanding high-level functions and biological systems (20).
PPI network construction and module analysis
The Search Tool for the Retrieval of Interacting Genes (STRING; http://string-db.org) (version 11.0) (21) online database was used to predict PPI network. Interaction with a combined score >0.4 was considered statistically significant. Cytoscape (version 3.7.2) is an open-source bioinformatics software platform for visualizing molecular interaction networks (22). Molecular Complex Detection (MCODE) (version 1.5.1) of Cytoscape is an APP based on the topology to cluster a given network, can be used to find densely connected regions (23). Cytoscape was used to draw PPI networks and using MCODE to identify the most important modules in the PPI network.
The selection criteria are: MCODE scores >2, degree cut-off =2, node score cut-off =0.2, Max depth =100 and k-score =2.
Hub genes selection and analysis
Hub genes with degrees ≥10 were selected. Biological process analysis of hub gene by BINGO (19).
Association with the clinical database
Data are collected from Nephroseq v5 online platform (https://nephroseq.org). Pearson correlation analysis of hub gene and GFR in nephrotic patients, the insignificant results were not shown. All tests were two‐tailed, and P<0.05 considered statistically significant.
Results
Identification of DEGs in RTN
After standardization of the microarray results, we found DEGs (6,643 in GSE69644, 6,159 in GSE27168 and 2,227 in GSE20247). The DEGs obtained were used to draw volcanic maps (Figure 1). As shown in the Venn diagram, the common overlap of three data sets contains 543 genes (Figure 2).
Figure 1.
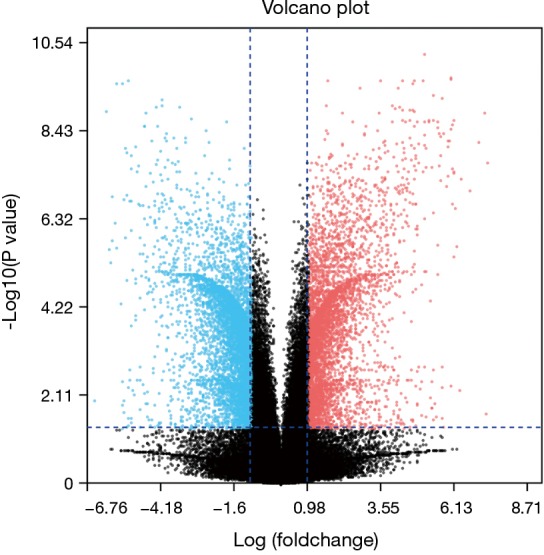
The screening conditions of DEGs in the data set were P<0.05 and logFC interval (≥1.5 or ≤−1.5). Blue is the gene with decreased expression, and red is the gene with increased expression. DEGs, differentially expressed genes.
Figure 2.
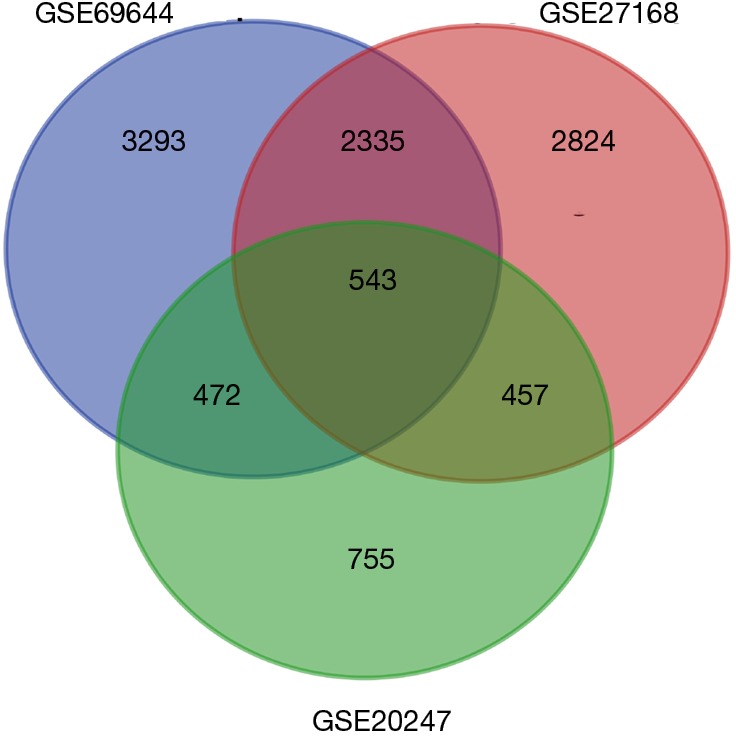
The DEGs of the three data sets were analyzed. There were 543 identical DEGs in the three data sets. DEGs, differentially expressed genes.
KEGG and GO enrichment analyses of DEGs
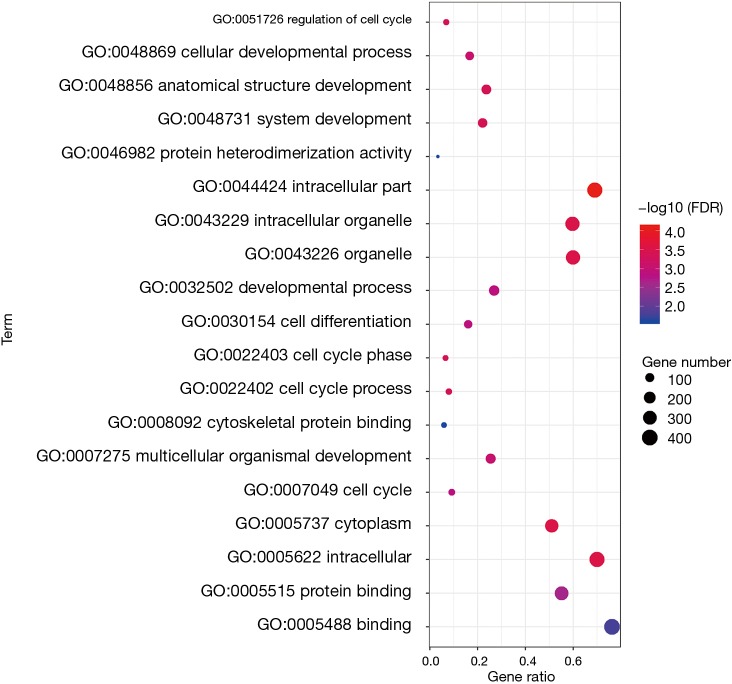
To analyze the biological classification of DEG, we used the biological networks oncology tool (bingo) (version 3.0.3) and KEGG to analyze the function and pathway enrichment. The results of the GO analysis showed that the changes in the biological process (BP) of DEGs were rich in the cell cycle, cell cycle process, system development, cell cycle stage, and anatomical structure development (Figure 3). The changes in molecular function (MF) focused on protein binding, binding, cytoskeleton protein binding, and protein heterodimeric activity (Figure 3). The changes of cell components of DEGs were concentrated in intracellular, cytoplasmic, intracellular, organelle and intracellular organelle (Figure 3). KEGG pathway analysis showed that DEG was enriched in the metabolic pathway, PI3K Akt signaling pathway, and MAPK signaling pathway (Table 1).
Figure 3.
After functional enrichment analysis of common DEGs, their CC, BP and MF results were summarized into a bubble chart.
Table 1. KEGG pathway enrichment analysis of DEGs.
| Term | Description | Count |
|---|---|---|
| hsa01100 | Metabolic pathways | 41 |
| hsa04151 | PI3K-Akt signaling pathway | 17 |
| hsa04010 | MAPK signaling pathway | 15 |
| hsa04510 | Focal adhesion | 14 |
| hsa04360 | Axon guidance | 13 |
| hsa04068 | FoxO signaling pathway | 13 |
| hsa04015 | Rap1 signaling pathway | 12 |
| hsa04144 | Endocytosis | 11 |
| hsa04530 | Tight junction | 11 |
KEGG, Kyoto Encyclopedia of Genes and Genomes; DEGs, differentially expressed genes.
PPI network construction and module analysis
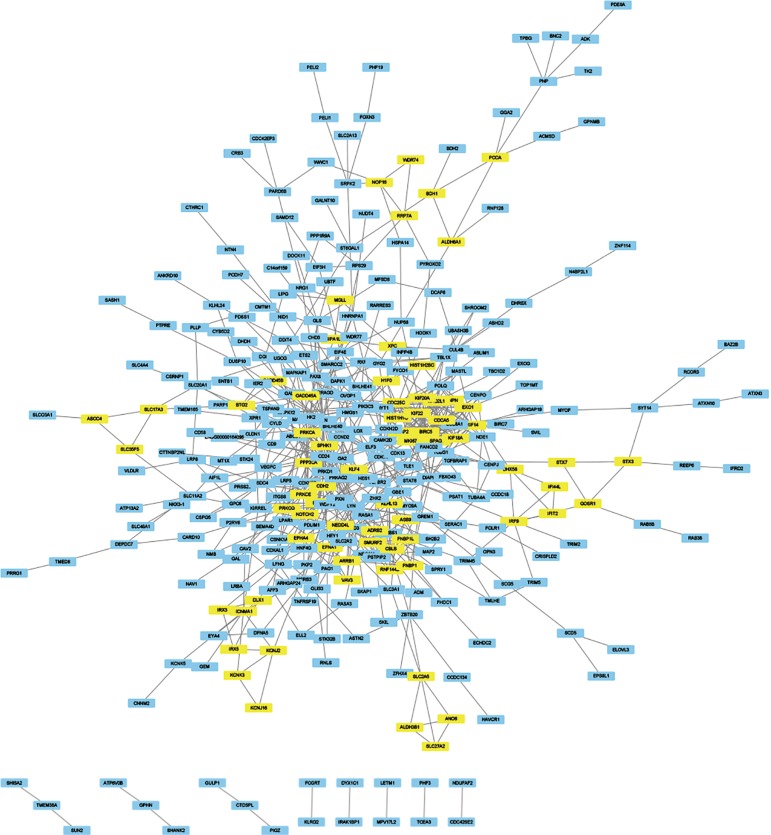
The module analysis of PPI network is analyzed by using Cytoscape (Figure 4).The most important module is Figure 5. The function analysis of the genes involved in this module by bingo shows that the genes of this module were enriched in the cell cycle, mitosis, and cell process (see Table 2).
Figure 4.
Through the string website, the 543 DEGs were analyzed according to medium confidence (0.4), and the analysis data were derived. Import the data into Cytoscape for drawing and use the MCODE module to analyze and get several important modules (score ≥3), which are marked with yellow. DEGs, differentially expressed genes.
Figure 5.
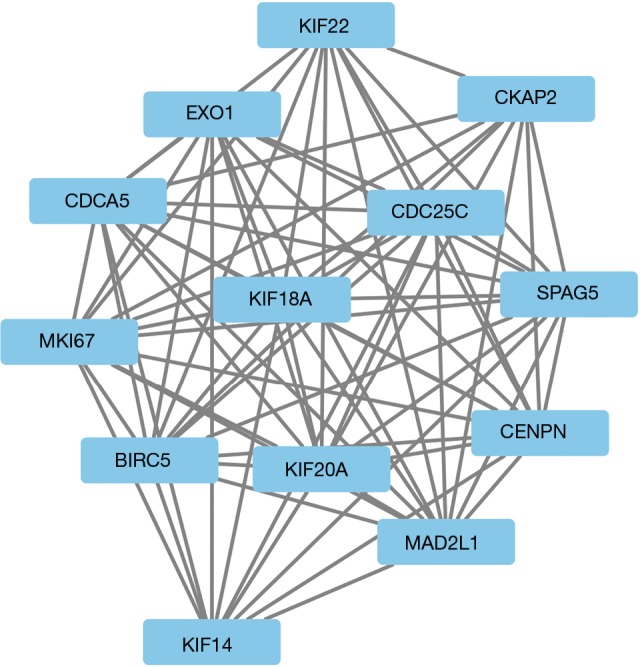
The most important module (score =12.167) was selected, which involved 13 genes.
Table 2. GO and KEGG pathway enrichment analysis of DEGs in the most significant module.
| Term | Description | Count | P value | FDR |
|---|---|---|---|---|
| GO:0000279 | M phase | 9 | 6.00E-13 | 1.37E-10 |
| GO:0022403 | Cell cycle phase | 9 | 4.16E-12 | 4.76E-10 |
| GO:0007049 | Cell cycle | 10 | 1.57E-11 | 1.20E-09 |
| GO:0022402 | Cell cycle process | 9 | 5.67E-11 | 3.24E-09 |
| GO:0000087 | M phase of mitotic cell cycle | 7 | 2.45E-10 | 1.12E-08 |
| GO:0000278 | Mitotic cell cycle | 7 | 6.24E-09 | 2.38E-07 |
| GO:0000280 | Nuclear division | 6 | 1.45E-08 | 4.16E-07 |
| GO:0007067 | Mitosis | 6 | 1.45E-08 | 4.16E-07 |
| GO:0048285 | Organelle fission | 6 | 1.82E-08 | 4.64E-07 |
| GO:0009987 | Cellular process | 12 | 6.22E-03 | 3.70E-02 |
| hsa04110 | Cell cycle | 2 | – | – |
| hsa04210 | Apoptosis | 1 | – | – |
| hsa03430 | Mismatch repair | 1 | – | – |
KEGG, Kyoto Encyclopedia of Genes and Genomes; DEGs, differentially expressed genes.
Hub gene selection and analysis
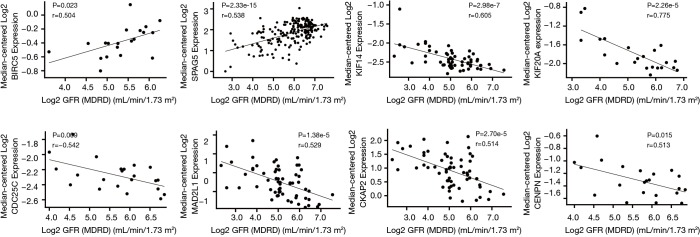
A total of 13 genes have been identified as key genes with degree ≥10. The names, abbreviations, and functions of these central genes were shown in Table 3. Descriptive data comes from gene cards (https://www.genecards.org/). The hot map of hub gene expression showed the folding changes between tubular necrosis group and non-tubular necrosis group (Figure 6). The network of hub genes and their co-expressed genes was analyzed by using a coexpedia online platform (Figure 7). The biological process of the hub gene was analyzed and visualized by using the bioscope (version 3.0.3) plug-in (Figure 8). Analysis of gene expression profile in nephrotic patients using the online platform of nephroseq V5 (Figure 9).
Table 3. Functional roles of 13 hub genes with degree ≥10.
| No. | Gene symbol | Full name | Function |
|---|---|---|---|
| 1 | SPAG5 | Sperm associated antigen 5 | Essential component of the mitotic spindle required for normal chromosome segregation and progression into anaphase |
| 2 | EXO1 | Exonuclease 1 | Functions in DNA mismatch repair (MMR) to excise mismatch-containing DNA tracts directed by strand breaks located either 5' or 3' to the mismatch |
| 3 | MAD2L1 | MAD2 mitotic arrest deficient-like 1 (yeast) | Component of the spindle assembly checkpoint that prevents the onset of anaphase until all chromosomes are properly aligned at the metaphase plate |
| 4 | BIRC5 | Baculoviral IAP repeat-containing 5 | Multitasking protein that has dual roles in promoting cell proliferation and preventing apoptosis |
| 5 | MKI67 | Marker of proliferation Ki-67 | Required to maintain individual mitotic chromosomes dispersed in the cytoplasm following nuclear envelope disassembly |
| 6 | CENPN | Centromere protein N | Component of the CENPA-NAC complex, a complex that plays a vital role in the assembly of kinetochore proteins, mitotic progression, and chromosome segregation |
| 7 | CDCA5 | Cell division cycle associated 5 | Regulator of sister chromatid cohesion in mitosis stabilizing cohesin complex association with chromatin |
| 8 | KIF22 | Kinesin family member 22 | Kinesin family member that participates in spindle formation and the movements of chromosomes during mitosis and meiosis |
| 9 | KIF20A | Kinesin family member 20A | Mitotic kinesin required for chromosome passenger complex (CPC)-mediated cytokinesis |
| 10 | CDC25C | Cell division cycle 25C | Functions as a dosage-dependent inducer in mitotic control |
| 11 | CKAP2 | Cytoskeleton-associated protein 2 | Possesses microtubule-stabilizing properties. Involved in regulating aneuploidy, cell cycling, and cell death in a p53/TP53-dependent manner (By similarity) |
| 12 | KIF14 | Kinesin family member 14 | Regulates cell growth through regulation of cell cycle progression and cytokinesis |
| 13 | KIF18A | Kinesin family member 18A | Microtubule-depolymerizing kinesin, which plays a role in chromosome congression |
Figure 6.
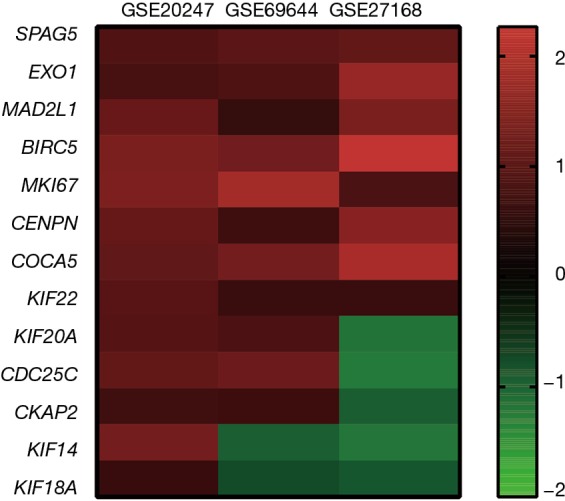
The logFC values of the 13 hub genes in the data set were collected and made into a heat map. These 13 genes were elevated in RTN. RTN, renal tubule necrosis.
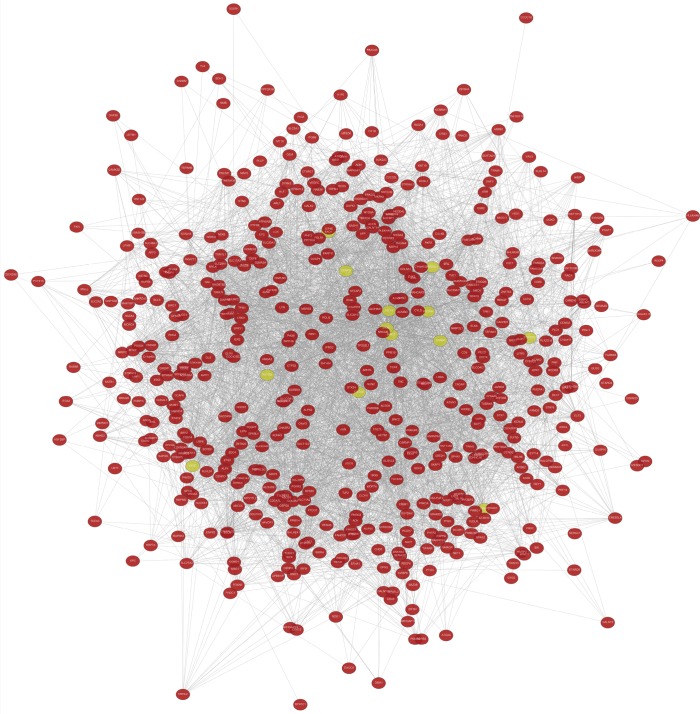
Figure 7.
543 common DEGs were introduced into the website of Coexpedia for analysis, and then the location of 13 key genes and their relationship with other genes were identified. These 13 genes are closely related to other DEGs. DEGs, differentially expressed genes.
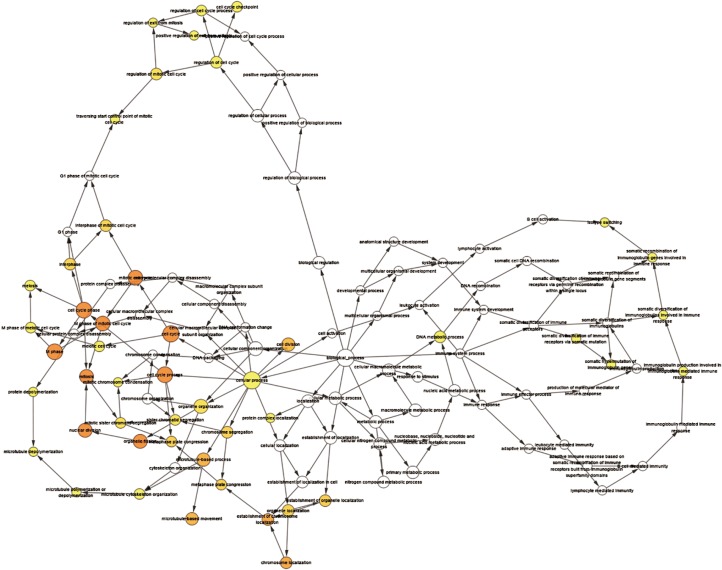
Figure 8.
Through the bingo plug-in of Cytoscape, the 13 hub genes were analyzed. The functions of these genes involve cell cycle and mitosis.
Figure 9.
The clinical data of 13 hub genes were retrieved from the Neproseq website, and the relationship between the expression of these genes and eGFR of renal function was analyzed.
Discussion
In this study, 543 DEGs were identified from three sets of data, and an important high score module was obtained through protein interaction network string analysis and MCODE analysis, with a total of 13 key genes. Coexpedia (http://www.coexpedia.org/) was used to analyze gene interactions. Thirteen hub genes were closely related to the surrounding genes. They were at the core of 543 degrees. We found that these genes were closely related to cell cycle, mitosis, and cell process. We obtained the logFC values of 13 key genes in three data sets and drew a heat map. Thermogram showed a high expression of 13 hub genes in the RTN group. Subsequently, we contacted the nephroseq database (www.nephroseq.org/). The results of the clinical association showed that SPAG5 and BIRC5 had a moderate positive correlation with GFR, and patients with high expression of these genes usually had better GFR. KIF14, kIF20A, CDC25C, MAD2L1, CKAP2, and CENPN were highly or moderately negatively correlated with GFR, and GFR was poor in patients with overexpression of these genes. The samples of MKI167, CDCA5, KIF18A, KIF22, and EXO1 were too short of reaching a reliable conclusion, so they were included in the reference.
A total of 13 hub genes were obtained in our study, among which 4 involved pathways have certain research value for RTN. For example, CDC25C and MAD2L1 participate in the cell cycle (hsa0410), BIRC5 were involved in apoptosis (hsa04210), and EXO1 were involved in mismatch repair (hsa03430). In the study of the pathway, we found that MAD2L1 has an effect on PTTG and ESP1 through APC, and PTTG plays an important role in regulating protein in p53/TP53 pathway and DNA repair (24). PTTG plays an important role in cell cycle and apoptosis (25). ESP1 plays a central role in chromosome segregation (26,27). CDC25C regulates cyclin-dependent kinase 1 (CDK1) and plays a key role in the cell cycle (28). CASP3/CASP7, a downstream gene of BIRC5, participates in the activation cascade of caspases and were responsible for the execution of apoptosis (29,30). EXO1 translation protein is exoenzyme 1, which are directly involved in the DNA mismatch repair process (31,32). Their biological processes were abundant and related to cell cycle, apoptosis, and DNA repair. By combining with the database, we found that the expression of these genes was positively or negatively correlated with the GFR level of nephrotic patients, and the expression of these genes was closely related to the renal function.
To sum up, we found 543 common DEGs through each data set’s DEGs and venn map and carried out bioinformatics methods such as protein interaction analysis, gene interaction analysis, and module analysis, and finally, obtained an important module. We believe that 4 genes in this module participate in the process of RTN, which can regulate the cell cycle, apoptosis, and DNA damage repair. At the same time, in the kidney disease database, the expression of these four genes has an impact on the renal function of patients.
Renal tubular injury widely exists for the development of renal diseases, including acute renal injury, chronic renal failure, IgA, and lupus kidney. Renal tubular injury has an important effect on the prognosis of nephrotic patients. The four key genes identified in this study may be helpful for the treatment or diagnosis of renal tubular injury. With the development of clinical treatments, it is possible to reduce tubular necrosis and improve the prognosis of patients by intervening in the expression of these genes. By detecting the expression of these genes, it is also possible to predict renal tubular injury in patients undergoing renal puncture. However, due to the small number of samples in this study, more basic experiments are needed to verify the results of this study.
Supplementary
The article’s supplementary files as
Acknowledgments
Funding: This work was supported by Guangxi Science and Technology Program 1598011-6.
Ethical Statement: The authors are accountable for all aspects of the work in ensuring that questions related to the accuracy or integrity of any part of the work are appropriately investigated and resolved.
Footnotes
Conflicts of Interest: All authors have completed the ICMJE uniform disclosure form (available at http://dx.doi.org/10.21037/tau.2019.11.24). The authors have no conflicts of interest to declare.
References
- 1.Han SJ, Li H, Kim M, et al. Kidney Proximal Tubular TLR9 Exacerbates Ischemic Acute Kidney Injury. J Immunol 2018;201:1073-85. 10.4049/jimmunol.1800211 [DOI] [PMC free article] [PubMed] [Google Scholar]
- 2.von Mässenhausen A, Tonnus W, Linkermann A. Cell Death Pathways Drive Necroinflammation during Acute Kidney Injury. Nephron 2018;140:144-7. 10.1159/000490807 [DOI] [PubMed] [Google Scholar]
- 3.Nakazawa D, Kumar SV, Marschner J, et al. Histones and Neutrophil Extracellular Traps Enhance Tubular Necrosis and Remote Organ Injury in Ischemic AKI. J Am Soc Nephrol 2017;28:1753-68. 10.1681/ASN.2016080925 [DOI] [PMC free article] [PubMed] [Google Scholar]
- 4.Cozzolino M, Ciceri P, Galassi A. Hyperphosphatemia: a novel risk factor for mortality in chronic kidney disease. Ann Transl Med 2019;7:55. 10.21037/atm.2018.06.50 [DOI] [PMC free article] [PubMed] [Google Scholar]
- 5.Fukasawa H, Furuya R, Yasuda H, et al. Anti-cancer agent-induced nephrotoxicity. Anticancer Agents Med Chem 2014;14:921-7. 10.2174/1871520614666140127105809 [DOI] [PubMed] [Google Scholar]
- 6.Miller RP, Tadagavadi RK, Ramesh G, et al. Mechanisms of Cisplatin nephrotoxicity. Toxins (Basel) 2010;2:2490-518. 10.3390/toxins2112490 [DOI] [PMC free article] [PubMed] [Google Scholar]
- 7.Jiang Z, Bao Q, Sun L, et al. Possible role of mtDNA depletion and respiratory chain defects in aristolochic acid I-induced acute nephrotoxicity. Toxicol Appl Pharmacol 2013;266:198-203. 10.1016/j.taap.2012.07.008 [DOI] [PubMed] [Google Scholar]
- 8.Li Y, Liu Z, Guo X, et al. Aristolochic acid I-induced DNA damage and cell cycle arrest in renal tubular epithelial cells in vitro. Arch Toxicol 2006;80:524-32. 10.1007/s00204-006-0090-4 [DOI] [PubMed] [Google Scholar]
- 9.Ji X, Wang H, Wu Z, et al. Specific Inhibitor of Smad3 (SIS3) Attenuates Fibrosis, Apoptosis, and Inflammation in Unilateral Ureteral Obstruction Kidneys by Inhibition of Transforming Growth Factor β (TGF-β)/Smad3 Signaling. Med Sci Monit 2018;24:1633-41. 10.12659/MSM.909236 [DOI] [PMC free article] [PubMed] [Google Scholar]
- 10.Gentle ME, Shi S, Daehn I, et al. Epithelial cell TGFβ signaling induces acute tubular injury and interstitial inflammation. J Am Soc Nephrol 2013;24:787-99. 10.1681/ASN.2012101024 [DOI] [PMC free article] [PubMed] [Google Scholar]
- 11.Pavkovic M, Vaidya VS. MicroRNAs and drug-induced kidney injury. Pharmacol Ther 2016;163:48-57. 10.1016/j.pharmthera.2016.03.016 [DOI] [PMC free article] [PubMed] [Google Scholar]
- 12.Fang W, Wang Z, Li Q, et al. Gpr97 Exacerbates AKI by Mediating Sema3A Signaling. J Am Soc Nephrol 2018;29:1475-89. 10.1681/ASN.2017080932 [DOI] [PMC free article] [PubMed] [Google Scholar]
- 13.Yamanishi Y, Kitaura J, Izawa K, et al. TIM1 is an endogenous ligand for LMIR5/CD300b: LMIR5 deficiency ameliorates mouse kidney ischemia/reperfusion injury. J Exp Med 2010;207:1501-11. 10.1084/jem.20090581 [DOI] [PMC free article] [PubMed] [Google Scholar]
- 14.Zuk A, Bonventre JV. Acute Kidney Injury. Annu Rev Med 2016;67:293-307. 10.1146/annurev-med-050214-013407 [DOI] [PMC free article] [PubMed] [Google Scholar]
- 15.Edgar R, Domrachev M, Lash AE. Gene Expression Omnibus: NCBI gene expression and hybridization array data repository. Nucleic Acids Res 2002;30:207-10. 10.1093/nar/30.1.207 [DOI] [PMC free article] [PubMed] [Google Scholar]
- 16.Choi YM, Kim HK, Shim W, et al. Mechanism of Cisplatin-Induced Cytotoxicity Is Correlated to Impaired Metabolism Due to Mitochondrial ROS Generation. PLoS One 2015;10:e0135083. 10.1371/journal.pone.0135083 [DOI] [PMC free article] [PubMed] [Google Scholar]
- 17.Hills CE, Willars GB, Brunskill NJ. Proinsulin C-peptide antagonizes the profibrotic effects of TGF-beta1 via up-regulation of retinoic acid and HGF-related signaling pathways. Mol Endocrinol 2010;24:822-31. 10.1210/me.2009-0391 [DOI] [PMC free article] [PubMed] [Google Scholar]
- 18.Ashburner M, Ball CA, Blake JA, et al. Gene ontology: tool for the unification of biology. The Gene Ontology Consortium. Nat Genet 2000;25:25-9. 10.1038/75556 [DOI] [PMC free article] [PubMed] [Google Scholar]
- 19.Maere S, Heymans K, Kuiper M. BiNGO: a Cytoscape plugin to assess overrepresentation of gene ontology categories in biological networks. Bioinformatics 2005;21:3448-9. 10.1093/bioinformatics/bti551 [DOI] [PubMed] [Google Scholar]
- 20.Kanehisa M. The KEGG database. Novartis Found Symp 2002;247:91-101. 10.1002/0470857897.ch8 [DOI] [PubMed] [Google Scholar]
- 21.Franceschini A, Szklarczyk D, Frankild S, et al. STRING v9.1: protein-protein interaction networks, with increased coverage and integration. Nucleic Acids Res 2013;41:D808-15. 10.1093/nar/gks1094 [DOI] [PMC free article] [PubMed] [Google Scholar]
- 22.Smoot ME, Ono K, Ruscheinski J, et al. Cytoscape 2.8: new features for data integration and network visualization. Bioinformatics 2011;27:431-2. 10.1093/bioinformatics/btq675 [DOI] [PMC free article] [PubMed] [Google Scholar]
- 23.Bandettini WP, Kellman P, Mancini C, et al. MultiContrast Delayed Enhancement (MCODE) improves detection of subendocardial myocardial infarction by late gadolinium enhancement cardiovascular magnetic resonance: a clinical validation study. J Cardiovasc Magn Reson 2012;14:83. 10.1186/1532-429X-14-83 [DOI] [PMC free article] [PubMed] [Google Scholar]
- 24.Hamid T, Kakar SS. PTTG/securin activates expression of p53 and modulates its function. Mol Cancer 2004;3:18. 10.1186/1476-4598-3-18 [DOI] [PMC free article] [PubMed] [Google Scholar]
- 25.Panguluri SK, Kakar SS. Effect of PTTG on endogenous gene expression in HEK 293 cells. BMC Genomics 2009;10:577. 10.1186/1471-2164-10-577 [DOI] [PMC free article] [PubMed] [Google Scholar]
- 26.Zou H, McGarry TJ, Bernal T, et al. Identification of a vertebrate sister-chromatid separation inhibitor involved in transformation and tumorigenesis. Science 1999;285:418-22. 10.1126/science.285.5426.418 [DOI] [PubMed] [Google Scholar]
- 27.Hauf S, Waizenegger IC, Peters JM. Cohesin cleavage by separase required for anaphase and cytokinesis in human cells. Science 2001;293:1320-3. 10.1126/science.1061376 [DOI] [PubMed] [Google Scholar]
- 28.Mori Y, Inoue Y, Taniyama Y, et al. Phosphorylation of the centrosomal protein, Cep169, by Cdk1 promotes its dissociation from centrosomes in mitosis. Biochem Biophys Res Commun 2015;468:642-6. 10.1016/j.bbrc.2015.11.004 [DOI] [PubMed] [Google Scholar]
- 29.Nicholson DW, Ali A, Thornberry NA, et al. Identification and inhibition of the ICE/CED-3 protease necessary for mammalian apoptosis. Nature 1995;376:37-43. 10.1038/376037a0 [DOI] [PubMed] [Google Scholar]
- 30.Cabrera JR, Bouzas-Rodriguez J, Tauszig-Delamasure S, et al. RET modulates cell adhesion via its cleavage by caspase in sympathetic neurons. J Biol Chem 2011;286:14628-38. 10.1074/jbc.M110.195461 [DOI] [PMC free article] [PubMed] [Google Scholar]
- 31.Qiu J, Qian Y, Chen V, et al. Human exonuclease 1 functionally complements its yeast homologues in DNA recombination, RNA primer removal, and mutation avoidance. J Biol Chem 1999;274:17893-900. 10.1074/jbc.274.25.17893 [DOI] [PubMed] [Google Scholar]
- 32.Genschel J, Bazemore LR, Modrich P. Human exonuclease I is required for 5' and 3' mismatch repair. J Biol Chem 2002;277:13302-11. 10.1074/jbc.M111854200 [DOI] [PubMed] [Google Scholar]
Associated Data
This section collects any data citations, data availability statements, or supplementary materials included in this article.
Supplementary Materials
The article’s supplementary files as


