

Abstract
In recent years, there has been a surge of interest in the general factor of psychopathology (“p”), which is intended to summarize broad psychiatric comorbidity into a single index. In this study, rather than attempting to validate this model using statistical techniques, we compared the magnitude (as indicated by the variance explained in the respective indicators) and the predictive validity of the “p” factor with those of the general factor of intelligence (“g”). To compare the magnitude, for “g”, we analyzed fifteen Wechsler Adult Intelligence Scale subtests (N=1,200). For “p”, we analyzed fourteen psychiatric diagnoses in Swedish adults (N=909,699), eight self‐ and parent‐rated psychopathology scales in Swedish adolescents (N=2,069), and sixteen parent‐rated psychopathology scales in Swedish children (N=14,589). To compare the predictive validity, we analyzed Swedish male military conscripts (N=414,595, mean age: 18.3 years) with measures on both “g” and “p” (derived from eight psychiatric diagnoses). We then examined their unique associations with three intelligence‐related outcomes (annual income, highest education, and university entrance exam scores), and sixteen adverse outcomes (e.g., suicidal behavior, psychotropic medication prescription, and criminality) retrieved from registers (mean age at follow‐up = 29.2 years). Results indicated that the magnitudes of “g” and “p” were very similar. Controlling for “p”, “g” significantly predicted later education (standardized beta, β=0.38, SE=0.01) and university entrance exam scores (β=0.48, SE=0.01). Controlling for “g”, “p” significantly predicted all adverse outcomes (mean β=0.32; range: 0.15 to 0.47). These findings support the notion that psychopathology indicators can be combined into a single score, similar to how intelligence subtests are combined into a general intelligence score. This “p” score might supplement specific diagnoses when formulating a management plan and predicting prognosis.
Keywords: General factor of psychopathology, p factor, general factor of intelligence, g factor, magnitude, predictive validity, psychiatric comorbidity, mental disorders, clinical utility
Individuals who perform well on one intelligence subtest tend to perform well on all other intelligence subtests1, 2. This empirical observation is the reason why intelligence subtests are combined into a single score, commonly labeled “g” (general intelligence factor). Introduced over a century ago, this factor has offered utility for researchers and clinicians3, 4, 5. For example, it predicts future education about as well as height predicts weight 6 .
Similar to the intelligence domain, individuals who suffer from one mental health problem are at increased risk of suffering from virtually all other mental health problems7, 8, 9, 10. For example, in a Danish population study of three million individuals, all psychiatric diagnoses were positively associated 11 . Recently, Lahey et al12, 13 proposed that a general factor of psychopathology could serve as a useful summary of this comorbidity. Caspi et al 14 replicated this general factor of psychopathology and labeled it “p”, to highlight its similarity to “g”.
Just as “g” predicts future education, studies indicate that “p” predicts future adverse outcomes, highlighting its clinical utility. For example, the cumulative burden of parent‐rated psychiatric problems in childhood predicts adverse outcomes in adolescence and young adulthood over and above specific psychiatric problems15, 16, 17, 18. To date, however, no studies have examined whether general psychopathology severe enough to warrant psychiatric diagnoses in late adolescence predicts register‐based adverse outcomes in young adulthood. Furthermore, no studies have examined whether “p” predicts adverse outcomes over and above “g”, which is important because they are moderately negatively associated14, 19.
The first goal of the present study was to compare the magnitude of the general factors of psychopathology and intelligence. The magnitude of a general factor is determined by the strength of the overlap among its indicators. For example, because the correlations among intelligence subtests are relatively large, the magnitude of “g” is also relatively large 20 . If “p” were to have a similar magnitude as “g”, then it might be useful to combine indicators of psychopathology into a single “p” score, just as intelligence subtests are summed into a single “g” score.
The second goal of this study was to compare the predictive validity of “p” and “g”, after adjusting for their overlap. If “p” were to uniquely predict unfavorable outcomes as well as “g” uniquely predicts favorable outcomes, then “p” might offer the psychiatric domain clinical and research utility. For example, it might supplement primary diagnoses when formulating the management plan and predicting prognosis.
METHODS
Samples
To measure the magnitude of the general intelligence factor, we relied on summary data from six US standardization subsamples published in the fourth edition of the Wechsler Adult Intelligence Scale (WAIS‐IV) 1 . We combined the six subsamples (20‐25 years old; 25‐30 years old; 30‐35 years old; 35‐45 years old; 45‐55 years old; and 55‐65 years old; each N=200) into a single sample (20‐65 years old; N=1,200).
To measure the magnitude of the general psychopathology factor, we relied on three different samples.
First, we examined that magnitude in adulthood by analyzing all individuals born in Sweden between 1969 and 1979 from the Multi‐Generation Register (N=1,056,041), such that the participants were between 35 and 45 years old at the end of the follow‐up period at December 31, 2013. After excluding subjects who had died or migrated before the end of the study period, the final sample included 909,699 individuals.
Second, we examined that magnitude in adolescence by analyzing 16‐year old individuals from the Swedish Twin Study of Child and Adolescent Development (TCHAD) 21 . At age 16, 1,067 (74%) of the parents and 2,369 (82%) of the twins responded. There was both self‐ and parent‐report information on 2,069 individuals.
Third, we examined that magnitude in childhood by analyzing 9‐year old individuals from the Child and Adolescent Twin Study in Sweden (CATSS) (N=14,589) 22 . The response rate was 75%.
To compare the predictive validity of the general factors of intelligence and psychopathology, we examined Swedish male military conscripts born between 1980 and 1992 (N=414,595; mean age: 18.3 years). Over 95% of all Swedish males attended the mandatory conscription evaluation 23 . We excluded all participants who had died (except from suicide) or migrated.
The study was approved by the Regional Ethical Review Board in Stockholm. Informed consent was acquired from the twin samples. By law, register data do not require informed consent because they are pseudonymized.
Measures
To measure the magnitude of the general factor of intelligence, we analyzed the Pearson correlations among the fifteen WAIS‐IV subtests.
To measure the magnitude of the general factor of psychopathology among the 35‐45 year old population sample, we linked the participants to the National Patient Register, which captures inpatient (1969‐2013) and outpatient (2001‐2013) psychiatric diagnoses according to the ICD‐8 (1969‐1986), ICD‐9 (1987‐1996) or ICD‐10 (1997‐present). This register covers 99% of psychiatric inpatient and 70 to 95% of psychiatric outpatient admissions 24 . We examined whether the individuals had ever been diagnosed with depression, anxiety, obsessive‐compulsive disorder (OCD), post‐traumatic stress disorder (PTSD), eating disorders, alcohol misuse, drug abuse, attention‐deficit hyperactivity‐disorder (ADHD), oppositional defiant/conduct disorder (ODD), autism, tics, bipolar disorder, schizophrenia, and schizoaffective disorder.
To measure the magnitude of the general factor of psychopathology among the 16‐year olds, we relied on parent‐ and self‐ratings from the Child Behavior Checklist (CBCL) 25 . This consists of eight continuous scales measuring anxiety/depression, withdrawn behavior, somatic complaints, social problems, thought problems, attention problems, rule‐breaking behavior, and aggressive behavior. The CBCL is reliable and well‐validated (e.g., the mean test‐retest reliability of parent ratings was 0.90 across eight days, and 0.70 across 24 months) 26 .
To measure the magnitude of the general factor of psychopathology among the 9‐year olds, we relied on parent ratings on the Autism‐Tics, AD/HD and other Comorbidities inventory (A‐TAC) 27 , which consists of continuous scales measuring problems with coordination, sensory issues, inattention, impulsivity, learning, organization, memory, language, sociability, flexibility, tics, compulsions, OCD, oppositional defiance, and conduct problems. Furthermore, we included the parent‐rated Screen for Child Anxiety Related Emotional Disorders (SCARED), which measures anxiety, and the parent‐rated Short Mood and Feelings Questionnaire (SMFQ), which measures depression. These scales have good psychometric properties (e.g., the mean test‐retest reliability of the A‐TAC scales based on clinician interviews across two months was 0.85)27, 28, 29, 30.
To measure the general factor of intelligence at conscription, we included general intelligence scores from the Computer Aided Testing ‐ Swedish Enlistment Battery (CAT‐SEB), administered during the conscription evaluation 23 . The CAT‐SEB included 12 subtests (mean internal consistency = 0.83; range = 0.70 to 0.93) and took on average 62 min to complete. The general factor score reliability estimate was 0.90 31 .
To measure the general factor of psychopathology at conscription, we linked the military conscripts to the National Patient Register to examine if they had been diagnosed with anxiety, depression, PTSD, bipolar disorder, drug abuse, alcohol misuse, ODD and ADHD prior to conscription (we excluded diagnoses of schizophrenia, schizoaffective disorder, autism, tics, and eating disorders because these did not co‐occur frequently enough to estimate tetrachoric correlations).
We then examined whether the participants had experienced a wide variety of outcomes after conscription. We included three intelligence‐related outcomes. From the Longitudinal Integration Database for Health Insurance and Labor Market Studies Register (LISA; coverage: 1990‐2013), we included the highest annual log of income and the highest obtained education level. We also included the highest score on the Swedish Scholastic Aptitude Test (SweSAT), a voluntary test administered twice a year (end of coverage: 2015) that grants admission to Swedish universities 32 .
We further examined sixteen adverse outcomes. From the National Patient Register, we included diagnoses of acute drug and alcohol intoxication (i.e., overdoses), and diagnoses of certain and uncertain suicide attempts. We combined certain suicide diagnoses with death from suicide (identified in the Death Register). From the Prescribed Drug Register (coverage: 2005‐2013), we included prescriptions of anxiolytic, sedative, antidepressant, stimulant, anti‐alcohol, anti‐opioid, lithium, antiepileptic, and antipsychotic medications (classified according to the Anatomical Therapeutic Chemical, ATC system). From the National Crime Register (coverage: 1973‐2013), we included court convictions of property or violent crimes. From LISA, we included use of social welfare benefits. All adverse outcomes were treated as binary variables.
The mean follow‐up time from date of conscription was 10.9±3.3 years. We included year of birth as a covariate to adjust for unequal follow‐up times and diagnostic secular trends. Table 1 displays prevalence rates and average time‐to‐event by outcome.
Table 1.
Adverse outcome statistics
| Outcome | Descriptive | Time‐to‐event (years, mean±SD) |
|---|---|---|
| Acute drug intoxication (%) | 0.68 | 6.93±3.65 |
| Acute alcohol intoxication (%) | 1.80 | 5.12±3.67 |
| Suicide attempt, certain (%) | 1.10 | 6.05±3.64 |
| Suicide attempt, uncertain (%) | 1.57 | 5.54±3.50 |
| Prescription of anxiolytics (%) | 10.61 | 9.15±3.80 |
| Prescription of sedatives (%) | 9.08 | 9.46±3.79 |
| Prescription of SSRIs (%) | 12.25 | 9.89±3.82 |
| Prescription of stimulants (%) | 1.69 | 10.53±3.67 |
| Prescription of anti‐alcohol medication (%) | 0.97 | 9.28±3.68 |
| Prescription of anti‐opioid medication (%) | 0.13 | 11.84±3.17 |
| Prescription of lithium (%) | 0.26 | 10.67±3.56 |
| Prescription of antiepileptics (%) | 2.43 | 10.30±3.70 |
| Prescription of antipsychotics (%) | 2.19 | 9.96±3.78 |
| Property crimes (%) | 2.96 | 4.62±3.67 |
| Violent crimes (%) | 4.21 | 5.31±3.48 |
| Use of social welfare benefits (%) | 16.07 | 2.92±2.55 |
| Highest median annual income in SEK (median absolute deviation) | 254,400 (87,770) | 8.59±3.52 |
| Education level, range 1‐7 (SD) | 4.43 (1.12) | 9.89±3.28 |
| Highest SweSAT score, range 0.05‐2 (SD) | 1.01 (0.44) | 3.98±3.04 |
SSRIs – selective serotonin reuptake inhibitors, SEK – Swedish krona, SweSAT – Swedish Scholastic Aptitude Test
Education level: 1= less than 9 years, 2= 9 years, 3= 1‐2 years of high school, 4= 3 years of high school, 5= 1‐2 years of undergraduate college, 6= 3 or more years of undergraduate college, 7= graduate studies
Statistical analyses
We estimated the magnitude of the general factors in three ways. We relied on a visual examination of the correlation distributions and their means; on the variance accounted for by the first principal component (PC1); and on the explained common variance (ECV) 20 . The ECV is the ratio of the variance explained by the general factor divided by the variance explained by the full factor model33, 34. It ranges from 0 (none of the modeled variance is attributable to the general factor) to 1 (all of the modeled variance is attributable to the general factor).
To derive the ECV, we conducted exploratory factor analyses (EFAs) of the intelligence and the mental health measures. We relied on exploratory rather than confirmatory factor analysis because we did not have strong hypotheses regarding the loading patterns, and because we expected the data to have a complex structure (i.e., that the cross‐loadings would not equal zero).
We determined how many factors to extract based on the scree plot, which contrasts the eigenvalues against the eigenvectors (for the WAIS‐IV subsamples, we computed the eigenvalues separately in each subsample, and then derived their means) 35 . Eigenvectors that account for less than one unit of variance might be attributable to sample variation 36 . We then rotated the extracted factors to a general and several specific factors using the Direct Schmid‐Leiman rotation 37 . This rotation funnels the variance shared among all indicators into a general factor, and the variance unique to subsets of the indicators into uncorrelated specific factors. Simulations indicate that this rotation performs well 38 .
For the adolescent sample, we only analyzed the overlap between the self‐ and parent‐ratings to minimize potential rater bias. For the six WAIS‐IV standardization subsamples, we combined all correlation matrices into a single histogram; computed the PC1 separately in each subsample and derived their mean (PC1); and estimated the ECV from a single EFA with the loadings constrained to equality across the six different age groups.
For the assessment of predictive validity, we examined the dimensionality of the eight mental disorders using the scree plot 35 , and rotated the EFA solution toward one general and several uncorrelated specific factors using the Direct Schmid‐Leiman approach 37 . Subsequently, we used exploratory structural equation modeling to regress each of the outcomes onto the general intelligence scale, the exploratory general and specific factors, and birth year in a multiple regression framework to estimate their unique effects 39 .
We used probit regression for the binary outcomes, and linear regression after outcome standardization (mean = 0; variance = 1) for the continuous outcomes. This allowed for comparing the regression betas on the same scale across the differently distributed outcomes. All analyses were conducted with the Mplus software, and the rotation matrices were derived using the R‐package GPArotation40, 41.
For the general factor magnitude sensitivity analyses, we extracted up to two factors more than that indicated by the scree plot because the ECV index varies by dimensionality. We subscripted the ECV index to display how many extracted factors it was based on (e.g., ECV3 indicates that it was based on three extracted factors). Furthermore, because there are several ways to identify a general factor 42 , we re‐estimated the ECVs using a bifactor rotation 43 . For the six differently aged WAIS‐IV standardization samples, we examined whether the factor loadings could be constrained to equality without a loss in model fit when computing the ECV index.
For the predictive validity sensitivity analyses, we first conducted the analyses without a general factor, using an oblique (correlated) Geomin rotation. Second, we attempted to extract an additional factor above and beyond that indicated by the scree plot, and to use a bifactor rotation. Third, we re‐ran the analyses after excluding all participants who had died (except from suicide) five or more years after conscription.
RESULTS
The scree plots for the four samples are displayed in Figure 1. Figure 2 displays that the distributions of the correlations were similar for the WAIS‐IV subtests and the psychopathology measures. Furthermore, the mean correlations, the PC1 and the ECV indices were highly similar in the two domains. This indicates that the magnitudes of the general factors of intelligence and psychopathology were largely indistinguishable.
Figure 1.

Scree plots for adult intelligence, and adult, adolescent and child psychopathology
Figure 2.

Histograms of correlations among Wechsler Adult Intelligence Scale (WAIS‐IV) subtests in adulthood, and among psychopathology measures in adulthood, adolescence and childhood. PC1= variance accounted for by first principal component, ECV= explained common variance index, where the sub‐index indicates factor dimensionality
The scree plot of the eight mental disorders at conscription indicated the presence of two factors (Table 2). All disorders loaded substantially on the general factor (mean loading = .55; range: .44 to .66). The first specific factor captured internalizing problems (depression loading = .64; anxiety loading = .48), and the second specific factor captured externalizing problems (ODD loading = .52; drug abuse loading = .39).
Table 2.
Exploratory factor analysis of psychiatric diagnoses assigned prior to conscription
| Rotation: Direct Schmid‐Leiman | |||
|---|---|---|---|
| Psychiatric diagnosis | General psychopathology factor | Specific internalizing factor | Specific externalizing factor |
| Depression | 0.66 | 0.64 | 0.03 |
| Anxiety | 0.53 | 0.48 | 0.05 |
| Post‐traumatic stress disorder | 0.54 | 0.42 | 0.12 |
| Bipolar disorder | 0.55 | 0.33 | 0.22 |
| Alcohol misuse | 0.44 | 0.07 | 0.37 |
| Drug abuse | 0.54 | 0.16 | 0.39 |
| Oppositional‐defiance/conduct disorder | 0.62 | 0.10 | 0.52 |
| Attention‐deficit/hyperactivity disorder | 0.54 | 0.09 | 0.45 |
Loadings equal to or greater than 0.30 are bolded
Root mean square error of approximation = 0.005, 90% CI: 0.004‐0.005, confirmatory fit index = 0.983, Tucker‐Lewis index = 0.963,
χ2=127.771, df=13, p<0.001
We then regressed each outcome onto the general intelligence factor and the general and specific psychopathology factors in a multiple regression framework. Figure 3 displays that the general intelligence factor uniquely and significantly predicted later education (β=0.38, SE=0.01) and SweSAT scores (β=0.48, SE=0.01), but not annual income (β=0.00, SE=0.01). The general factor of psychopathology uniquely and significantly predicted all sixteen adverse outcomes (mean β=0.32; range: 0.15 to 0.47). Individuals scoring one standard deviation above the mean on the general factor of psychopathology had, on average, after transforming the mean probit beta to an odds ratio, a 79% higher risk of suffering the adverse outcomes.
Figure 3.

Unique associations between general psychopathology (p) and general intelligence (g) factors measured at conscription and later outcomes. The standardized betas for income, education level and SweSAT were based on linear regression. SSRIs – selective serotonin reuptake inhibitors, SweSAT – Swedish Scholastic Aptitude Test
As displayed in Figure 4, the specific psychopathology factors primarily predicted related outcomes (e.g., the specific internalizing, but not the specific externalizing, factor predicted prescription of selective serotonin reuptake inhibitors, SSRIs), showing that covariation not accounted for by the general factor of psychopathology also had predictive validity.
Figure 4.
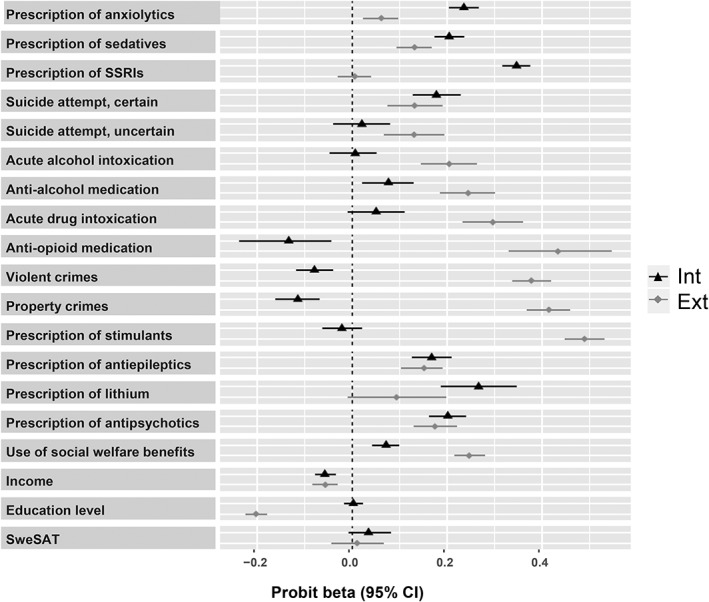
Unique associations between specific internalizing (Int) and externalizing (Ext) factors measured at conscription and later outcomes (all associations adjusted for general psychopathology and intelligence). The standardized betas for income, education level and SweSAT were based on linear regression. SSRIs – selective serotonin reuptake inhibitors, SweSAT – Swedish Scholastic Aptitude Test
For the magnitude comparison, the ECV indices remained similar between intelligence and psychopathology, regardless of dimensionality and general factor rotation. For the WAIS‐IV subsamples, the factor loadings could be constrained to equality across the six subsamples without a loss in model fit (results available upon request).
For the predictive validity analyses, the betas based on the correlated factors model were similar to the specific factors in the original analyses, but obviously did not demonstrate the effect of the general factor. Although we attempted to extract a third exploratory factor from the eight mental disorders at conscription, this factor contained only small loadings (e.g., mean Varimax loading = –0.03; range: –0.07 to 0.10). This suggested over‐extraction, and did not permit proceeding to a Direct Schmid‐Leiman or bifactor rotation. The betas also remained similar when we re‐ran the analyses after excluding all participants who had died (except from suicide) five years or later after conscription (results available upon request).
DISCUSSION
Our findings document that the general factors of intelligence and psychopathology have similar magnitudes, indicating that it might be useful to combine psychopathology indicators into a “p” score, just as WAIS‐IV subtests are combined into a “g” score.
Furthermore, whereas previous research had demonstrated that parent‐rated general psychopathology in childhood predicts adverse outcomes in adolescence and young adulthood15, 16, 17, 18, we additionally demonstrated that a general psychopathology factor based on psychiatric diagnoses predicts register‐based adverse outcomes a decade later in young adulthood, even when holding general intelligence constant. To put the magnitude of these associations in context, the general factor of psychopathology predicted the adverse outcomes about as well as psychotherapy predicts subsequent well‐being, or about as well as sleeping aid medication reduces short‐term insomnia 6 .
It remains unclear what the general factor of psychopathology measures. Hypotheses include the personality trait neuroticism, impulsivity, or irrational thinking44, 45, 46. We speculate that the general factor of psychopathology might quantify overall distress and impairment, similar to how the general factor of intelligence quantifies gross abstract reasoning. However, given the lack of consensus about the meaning of the century‐old general factor of intelligence 4 , it might be unrealistic to expect a solution to this conundrum anytime soon.
Regardless of interpretation, the general factor of intelligence has offered clinical and research utility over the past century, suggesting that the general factor of psychopathology might do so too47, 48. In terms of clinical utility, the general factor of psychopathology might supplement diagnoses. A continuous or binned (e.g., small, medium and large) general psychopathology score might assist with prognosis; might differentiate among patients with the same primary diagnosis to indicate who might need additional care; and might help individuals who present with a large number of symptoms, but fail to meet diagnostic criteria for a diagnosis, to gain access to care.
In terms of research utility, we echo past arguments that it might be beneficial to isolate the general factor of psychopathology when examining associations with risk factors13, 14. As an analogy, a hypothetical association between processing speed and future level of education might not indicate specificity; however, if such an association were to remain after isolating general intelligence, it would lend stronger support to the unique role of rapid thinking in educational success.
This work should be interpreted in light of certain limitations. First, the predictive results were limited to men only. Although past research has demonstrated that a parent‐rated general psychopathology factor predicted teacher‐rated adverse outcomes years later in a sample of girls, it would be important to examine if these results replicate among females 17 . Furthermore, some of the diagnoses tend to co‐occur with the outcomes (e.g., depression and prescription of SSRIs), which might have increased the associations. However, the adverse outcomes occurred on the average eight years after conscription, and the general psychopathology factor predicted more independent outcomes (e.g., criminality and use of social welfare benefits) equally well.
Second, it is possible that the associations among mental health indicators are influenced by collider bias 49 . Individuals with multiple disorders might be more prone to seek mental health assistance, leading to an overestimation of associations among disorders in national registers. In contrast, individuals with multiple syndromes might be less prone to participate in survey research, leading to an underestimation of associations among symptom scales. Despite these potential ascertainment biases, the general factor magnitude metrics were remarkably similar regardless of sampling method. On a related note, it is possible that the general factor of psychopathology might partly represent a rating bias; however, for the adolescent sample, we analyzed the magnitude only based on the overlap between self‐ and parent‐report data. Furthermore, it seems unlikely that a rating bias would predict such a wide range of adverse outcomes years later.
Third, because it is challenging to predict time‐to‐event data in a structural equation modeling framework, we only predicted the probability of whether the outcomes occurred or not. Survival analyses would additionally have predicted the probability of the events as a function of time.
Fourth, it is important to keep in mind that observed data that appear to consist of a general factor could be generated by processes lacking a general factor50, 51, 52, 53. Because it is difficult to infer the true data generating process, it is probably wise to harbor a healthy level of skepticism toward all nosological models to protect against reification 54 . Nevertheless, even if a process without a general factor had generated the observed data patterns in this study, the general factor of psychopathology might still be a convenient summary index of such underlying process.
Finally, although the general factors of intelligence and psychopathology had similar magnitude and predictive validity, there are also substantive differences between the two domains. In contrast to psychopathology, intelligence tests have a logically correct answer, whereas short‐term fluctuations are generally more important in the mental health domain (e.g., a depressive episode might warrant temporary suicide prevention efforts).
In conclusion, whereas current diagnostic systems measure diagnoses relatively well, they place less emphasis on broad symptomatology. It might be useful to combine psychopathology indicators into a single score, similar to how intelligence subtests are combined into a general intelligence score. Such a single score might supplement specific diagnoses when developing treatment plans or predicting prognosis.
ACKNOWLEDGEMENTS
This study was supported by the Swedish Research Council through the Swedish Initiative for Research on Microdata in the Social and Medical Sciences (SIMSAM) framework grant 340‐2013‐5867, and from the Swedish Research Council grant 2017‐01358. The funding sources had no role in the design and conduct of the study; the collection, management, analysis and interpretation of data; the preparation, review and approval of the manuscript; and the decision to submit the manuscript for publication.
REFERENCES
- 1. Wechsler D. Wechsler Adult Intelligence Scale ‐ Fourth Edition: technical and interpretive manual. San Antonio: Pearson, 2008. [Google Scholar]
- 2. Carroll JB. Human cognitive abilities: a survey of factor analytic studies. Cambridge: Cambridge University Press, 1993. [Google Scholar]
- 3. Deary IJ. Intelligence. Annu Rev Psychol 2012;63:453‐82. [DOI] [PubMed] [Google Scholar]
- 4. Nisbett RE, Aronson J, Blair C et al. Intelligence: new findings and theoretical developments. Am Psychol 2012;67:130‐59. [DOI] [PubMed] [Google Scholar]
- 5. Spearman C. “General intelligence” objectively determined and measured. Am J Psychol 1904;15:201‐92. [Google Scholar]
- 6. Meyer GJ, Finn SE, Eyde LD et al. Psychological testing and psychological assessment. A review of evidence and issues. Am Psychol 2001;56:128‐65. [PubMed] [Google Scholar]
- 7. Kotov R, Ruggero CJ, Krueger RF et al. New dimensions in the quantitative classification of mental illness. Arch Gen Psychiatry 2011;68:1003‐11. [DOI] [PubMed] [Google Scholar]
- 8. Krueger RF. The structure of common mental disorders. Arch Gen Psychiatry 1999;56:921‐6. [DOI] [PubMed] [Google Scholar]
- 9. Kendler KS, Aggen SH, Knudsen GP et al. the structure of genetic and environmental risk factors for syndromal and subsyndromal common DSM‐IV Axis I and all axis II disorders. Am J Psychiatry 2011;168:29‐39. [DOI] [PMC free article] [PubMed] [Google Scholar]
- 10. Kessler RC, Ormel J, Petukhova M et al. Development of lifetime comorbidity in the World Health Organization World Mental Health Surveys. Arch Gen Psychiatry 2011;68:90‐100. [DOI] [PMC free article] [PubMed] [Google Scholar]
- 11. Plana‐Ripoll O, Pedersen CB, Holtz Y et al. Exploring comorbidity within mental disorders among a Danish national population. JAMA Psychiatry 2019;76:259‐70. [DOI] [PMC free article] [PubMed] [Google Scholar]
- 12. Lahey BB, Applegate B, Hakes JK et al. Is there a general factor of prevalent psychopathology during adulthood? J Abnorm Psychol 2012;121:971‐7. [DOI] [PMC free article] [PubMed] [Google Scholar]
- 13. Lahey BB, Van Hulle CA, Singh AL et al. Higher‐order genetic and environmental structure of prevalent forms of child and adolescent psychopathology. Arch Gen Psychiatry 2011;68:181‐9. [DOI] [PMC free article] [PubMed] [Google Scholar]
- 14. Caspi A, Houts RM, Belsky DW et al. The p factor: one general psychopathology factor in the structure of psychiatric disorders? Clin Psychol Sci 2014;2:119‐37. [DOI] [PMC free article] [PubMed] [Google Scholar]
- 15. Copeland WE, Wolke D, Shanahan L et al. Adult functional outcomes of common childhood psychiatric problems: a prospective, longitudinal study. JAMA Psychiatry 2015;72:892‐9. [DOI] [PMC free article] [PubMed] [Google Scholar]
- 16. Pettersson E, Lahey BB, Larsson H et al. Criterion validity and utility of the general factor of psychopathology in childhood: predictive associations with independently measured severe adverse mental health outcomes in adolescence. J Am Acad Child Adolesc Psychiatry 2018;57:372‐83. [DOI] [PubMed] [Google Scholar]
- 17. Lahey BB, Rathouz PJ, Keenan K et al. Criterion validity of the general factor of psychopathology in a prospective study of girls. J Child Psychol Psychiatry 2015;56:415‐22. [DOI] [PMC free article] [PubMed] [Google Scholar]
- 18. Laceulle OM, Chung JM, Vollebergh WAM et al. The wide‐ranging life outcome correlates of a general psychopathology factor in adolescent psychopathology. Personal Ment Health 2020;14:9‐29. [DOI] [PMC free article] [PubMed] [Google Scholar]
- 19. Grotzinger AD, Cheung AK, Patterson MW et al. Genetic and environmental links between general factors of psychopathology and cognitive ability in early childhood. Clin Psychol Sci 2019;7:430‐44. [DOI] [PMC free article] [PubMed] [Google Scholar]
- 20. Revelle W, Wilt J. The general factor of personality: a general critique. J Res Pers 2013;47:493‐504. [DOI] [PMC free article] [PubMed] [Google Scholar]
- 21. Lichtenstein P, Tuvblad C, Larsson H et al. The Swedish Twin Study of Child and Adolescent Development: the TCHAD‐study. Twin Res Hum Genet 2006;10:7. [DOI] [PubMed] [Google Scholar]
- 22. Anckarsater H, Lundstrom S, Kollberg L et al. The Child and Adolescent Twin Study in Sweden (CATSS). Twin Res Hum Genet 2011;14:495‐508. [DOI] [PubMed] [Google Scholar]
- 23. Carlstedt B. Cognitive abilities – aspects of structure, process and measurement. Göteborg: Göteborgs Universitet, 2000. [Google Scholar]
- 24.Socialstyrelsen. Bortfall och kvalitet om patientregistret. http://www.socialstyrelsen.se.
- 25. Achenbach TM, Ruffle TM. The Child Behavior Checklist and related forms for assessing behavioral/emotional problems and competencies. Pediatr Rev 2000;21:265‐71. [DOI] [PubMed] [Google Scholar]
- 26. Achenbach TM, Rescorla LA. Manual for the ASEBA School‐Age Forms & Profiles. Burlington: University of Vermont, Research Center for Children, Youth, & Families, 2001. [Google Scholar]
- 27. Larson T, Anckarsater H, Gillberg C et al. The Autism‐Tics, AD/HD and other Comorbidities inventory (A‐TAC): further validation of a telephone interview for epidemiological research. BMC Psychiatry 2010;10:1. [DOI] [PMC free article] [PubMed] [Google Scholar]
- 28. Hansson SL, Rojvall AS, Rastam M et al. Psychiatric telephone interview with parents for screening of childhood autism‐tics, attention‐deficit hyperactivity disorder and other comorbidities (A‐TAC) ‐ Preliminary reliability and validity. Br J Psychiatry 2005;187:262‐7. [DOI] [PubMed] [Google Scholar]
- 29. Angold A, Costello EJ, Messer SC et al. The development of a questionnaire for use in epidemiological studies of depression in children and adolescents. Int J Meth Psychiatr Res 1995;5:237‐49. [Google Scholar]
- 30. Birmaher B, Brent DA, Chiappetta L et al. Psychometric properties of the Screen for Child Anxiety Related Emotional Disorders (SCARED): a replication study. J Am Acad Child Adolesc Psychiatry 1999;38:1230‐36. [DOI] [PubMed] [Google Scholar]
- 31. Mårdberg B, Carlstedt B. Swedish Enlistment Battery (SEB): construct validity and latent variable estimation of cognitive abilities by the CAT‐SEB. Int J Select Assess 1998;6:107‐14. [Google Scholar]
- 32. Löfgren K. Validation of the Swedish University Entrance System: selected results from the VALUTA‐Project 2001‐2004. Umeå: Umeå University, 2005. [Google Scholar]
- 33. ten Berge JMF, Socan G. The greatest lower bound to the reliability of a test and the hypothesis of unidimensionality. Psychometrika 2004;69:613‐25. [Google Scholar]
- 34. Rodriguez A, Reise SP, Haviland MG. Evaluating bifactor models: calculating and interpreting statistical indices. Psychol Methods 2016;21:137‐50. [DOI] [PubMed] [Google Scholar]
- 35. Cattell RB. The scree test for the number of factors. Multivar Behav Res 1966;1:245‐76. [DOI] [PubMed] [Google Scholar]
- 36. Kaiser HF. The application of electronic‐computers to factor‐analysis. Educ Psychol Meas 1960;20:141‐51. [Google Scholar]
- 37. Waller NG. Direct Schmid‐Leiman transformations and rank‐deficient loadings matrices. Psychometrika 2018;83:858‐70. [DOI] [PubMed] [Google Scholar]
- 38. Giordano C, Waller NG. Recovering bifactor models: a comparison of seven methods. Psychol Methods (in press). [DOI] [PubMed] [Google Scholar]
- 39. Asparouhov T, Muthen B. Exploratory structural equation modeling. Struct Equ Modeling 2009;16:397‐438. [Google Scholar]
- 40. Bernaards CA, Jennrich RI. Gradient projection algorithms and software for arbitrary rotation criteria in factor analysis. Educ Psychol Meas 2005;65:770‐90. [Google Scholar]
- 41. Muthén LK, Muthén BO. Mplus user's guide, 7th ed. Los Angeles: Muthén & Muthén, 2015. [Google Scholar]
- 42. Yung YF, Thissen D, McLeod LD. On the relationship between the higher‐order factor model and the hierarchical factor model. Psychometrika 1999;64:113‐28. [Google Scholar]
- 43. Jennrich RI, Bentler PM. Exploratory bi‐factor analysis. Psychometrika 2011;76:537‐49. [DOI] [PMC free article] [PubMed] [Google Scholar]
- 44. Carver CS, Johnson SL, Timpano KR. Toward a functional view of the p factor in psychopathology. Clin Psychol Sci 2017;5:880‐9. [DOI] [PMC free article] [PubMed] [Google Scholar]
- 45. Caspi A, Moffitt TE. All for one and one for all: mental disorders in one dimension. Am J Psychiatry 2018;175:831‐44. [DOI] [PMC free article] [PubMed] [Google Scholar]
- 46. Tackett JL, Lahey BB, van Hulle C et al. Common genetic influences on negative emotionality and a general psychopathology factor in childhood and adolescence. J Abnorm Psychol 2013;122:1142‐53. [DOI] [PMC free article] [PubMed] [Google Scholar]
- 47. Kotov R, Krueger RF, Watson D, et al. The Hierarchical Taxonomy of Psychopathology (HiTOP): a dimensional alternative to traditional nosologies. J Abnorm Psychol 2017;126:454‐77. [DOI] [PubMed] [Google Scholar]
- 48. Krueger RF, Kotov R, Watson D et al. Progress in achieving quantitative classification of psychopathology. World Psychiatry 2018;17:282‐93. [DOI] [PMC free article] [PubMed] [Google Scholar]
- 49. Berkson J. Limitations of the application of fourfold table analysis to hospital data. Biometrics 1946;2:47‐53. [PubMed] [Google Scholar]
- 50. Thomson GH. A hierarchy without a general factor. Br J Psychol 1916;8:271‐81. [Google Scholar]
- 51. van der Maas HL, Dolan CV, Grasman RP et al. A dynamical model of general intelligence: the positive manifold of intelligence by mutualism. Psychol Rev 2006;113:842‐61. [DOI] [PubMed] [Google Scholar]
- 52. Bartholomew DJ, Deary IJ, Lawn M. A new lease of life for Thomson's bonds model of intelligence. Psychol Rev 2009;116:567‐79. [DOI] [PubMed] [Google Scholar]
- 53. Borsboom D, Cramer AO. Network analysis: an integrative approach to the structure of psychopathology. Annu Rev Clin Psychol 2013;9:91‐121. [DOI] [PubMed] [Google Scholar]
- 54. Hyman SE. The diagnosis of mental disorders: the problem of reification. Annu Rev Clin Psychol 2010;6:155‐79. [DOI] [PubMed] [Google Scholar]